ORIGINAL RESEARCH ARTICLE
Regional differences in birth prevalence of cleft lip and/or palate in Sweden – a register study of all children born in Sweden between 2000 and 2020
Måns Cornefjord, MDa,b  , Karin Källén, PhDc , Kristina Klintö, SLP, PhDd,e , Mia Stiernman, MD, PhDa,b , Anna-Paulina Wiedel, DDS, PhDa,f and Magnus Becker, MD, PhDa,b
aDepartment of Clinical Sciences in Malmö, Lund University, Malmö, Sweden; bDepartment of Plastic and Reconstructive Surgery, Skåne University Hospital, Malmö, Sweden; cInstitution of Clinical Sciences, Department of Obstetrics and Gynecology, Centre of Reproduction Epidemiology, Tornblad Institute, Lund University, Lund, Sweden; dDivision of Speech Language Pathology, Phoniatrics and Audiology, Department of Clinical Sciences in Lund, Lund University, Sweden; eDivision of Speech Language Pathology, Department of Otorhinolaryngology, Skåne University Hospital, Malmö, Sweden; fDepartment of Oral and Maxillofacial Surgery, Skåne University Hospital, Malmö, Sweden
ABSTRACT
The birth prevalence of cleft lip and/or palate (CL/P) varies globally, and regional differences have previously been observed within Sweden. Updated data on CL/P birth prevalence is needed and has been requested nationally and internationally. This study investigated regional differences and temporal trends in the birth prevalences of CL/P and specific cleft subtypes across Sweden’s six health care regions (HC regions) from 2000 to 2020. Using data from the Swedish Medical Birth Register and the National Register of Congenital Anomalies (coverage 97–99%), the study included 2,230,771 children. Variables included were year and region of birth, and cleft diagnoses: cleft lip and/or palate (CL/P), cleft palate without cleft lip (CP), cleft lip with/without cleft palate (CL ± P), bilateral cleft lip with/without cleft palate (BCL ± P), and unilateral/bilateral cleft lip and palate (UCLP, BCLP). Poisson regression models were used to assess regional differences and trends. The Stockholm HC region had the lowest prevalence for all cleft types except CP. The Northern HC region had a higher CP prevalence, while clefts involving the lip (CL ± P, BCL ± P) were more common in the Southeastern and Southern HC regions. Declining trends were observed in at least two regions for all cleft types except CP. CL/P, CL ± P, and BCL ± P showed decreasing prevalence in three regions. The findings confirm some previously reported regional patterns, including a higher CP birth prevalence in northern Sweden. Potential explanations for the regional differences include genetic variation, differences in attitude towards pregnancy termination, socioeconomic factors, and exposure to other risk factors, but need further examination.
KEYWORDS: Cleft lip and palate; cleft lip; cleft palate; birth prevalence; incidence; Sweden; cleft types; trends; regional differences; geographical differences
Citation: Journal of Plastic Surgery and Hand Surgery 2025; 60: 196–203. DOI: https://doi.org/10.2340/jphs.v60.44798.
Copyright: © 2025 The Author(s). Published by MJS Publishing on behalf of Acta Chirurgica Scandinavica. This is an Open Access article distributed under the terms of the Creative Commons Attribution 4.0 International License (http://creativecommons.org/licenses/by/4.0/), allowing third parties to copy and redistribute the material in any medium or format and to remix, transform, and build upon the material, with the condition of proper attribution to the original work.
Received: 31 May 2025; Accepted: 29 August 2025; Published: 21 October 2025
CONTACT: Måns Cornefjord mans.cornefjord@med.lu.se Department of Plastic and Reconstructive Surgery, Skåne University Hospital, Jan Waldenströms gata 18, SE21428, Malmö, Sweden
Supplemental data for this article can be accessed online at https://doi.org/10.2340/jphs.v60.44798
Competing interests and funding: The authors have no conflicts of interest to declare.
Introduction
The birth prevalence of cleft lip and/or palate (CL/P) is often reported as between 1 and 2 / 1,000 births globally [1–3]; but it has been shown in several studies that it differs between geographical regions and ethnic groups [1, 4]. For example, high birth prevalences have been shown in Native American and Asian populations [1, 4, 5]. On the other hand, the malformation seems to be less common in the African population [1, 6, 7]. The etiology of CL/P is not completely understood, but it seems to be multifactorial. There are known genetic risk factors [2, 8, 9], and it has been shown that a child has a significantly higher risk of being born with a cleft if there are close relatives with CL/P [10–12]. However, environmental factors also contribute. Perhaps the best understood risk factor is maternal smoking, which has been shown to increase the risk in numerous studies [2, 13–15]. Other potential risk factors include, for example, certain medications [2, 16–18], high maternal body mass index (BMI) [19, 20], and nutritional deficiencies [2, 21]. Multivitamin supplements have been shown to have a protective effect [22]. There are also socioeconomic factors that have been shown to increase the risk of CL/P, such as low socioeconomic status [23, 24] and low parental education level [25, 26]. Hence, geographic differences in the birth prevalence of CL/P are likely to be a result of genetic differences between populations in combination with environmental factors.
We recently published a study regarding the birth prevalence of CL/P and its subgroups, namely, cleft palate without cleft lip (CP), cleft lip with/without cleft palate (CL ± P), bilateral cleft lip with/without cleft palate (BCL ± P), unilateral cleft lip and palate (UCLP), and bilateral cleft lip and palate (BCLP), in Sweden during a 21-year period (2000–2020) [27]. In the study, the birth prevalence of CL/P in Sweden during the period was found to be 1.52 / 1,000 births. Earlier studies of CL/P birth prevalence in Sweden have been published by, for example, Hagberg et al. in 1998 [28], Beckman and Myrberg in 1972 [29], and Chetpakdeechit in 2012 [30]. Hagberg et al. included children born in Stockholm and found a CL/P birth prevalence of 2.0 / 1,000 births, whilst Beckman and Myrberg included children born in the northern parts of the country and found a birth prevalence of 1.72 / 1,000 births. Chetpakdeechit et al. focused on CP in the western parts of Sweden, with a birth prevalence of 0.62 / 1,000 births. Beckman and Myrberg reported a different proportion of cleft subtypes in northern Sweden compared to Stockholm, namely a significantly higher birth prevalence of CP.
The Swedish public health care system is decentralized and controlled on a regional level by the 21 Swedish Regions. The Regions are grouped into six larger health care regions (HC-regions, Swedish: Sjukvårdsregioner), with one or two university hospitals serving each HC-region. A map of Sweden with the HC regions highlighted is shown in Figure 1. As CL/P is treated only at the university hospitals, each HC-region also has its own cleft care center. In this study, we wanted to further explore potential geographical differences between the Swedish HC-regions when it comes to the birth prevalences of CL/P and its subtypes, and compare the findings to those presented in previous Swedish studies. Discovering these potential differences would offer an opportunity to further study the reasons behind them in order to better understand the etiology behind CL/P and the reasons for the varying birth prevalences globally.
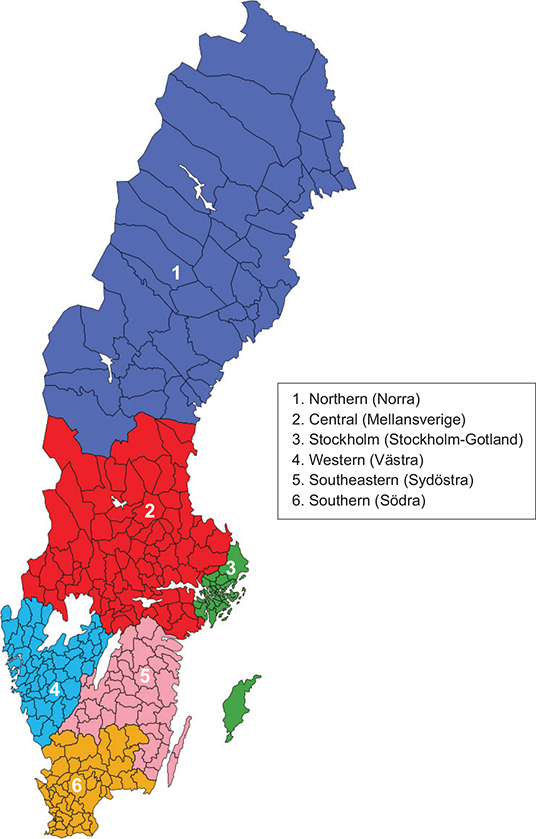
Figure 1. Map of the health care regions and municipalities of Sweden. Modified from Lokal_Profil under CC BY-SA 2.5, via Wikimedia Commons [31].
Aims
The aim of the study was to investigate geographical differences in the birth prevalence of CL/P and its subtypes in Sweden during the years 2000–2020. This was done by examining temporal trends and differences in birth prevalences between HC regions.
Research questions
- What were the birth prevalences of CL/P and certain cleft subtypes in the six Swedish HC-regions during the time period 2000–2020?
- Were there any differences in birth prevalences for CL/P or its subtypes when comparing each HC region with the rest of the country?
- Did the birth prevalences change significantly from 2000 to 2020?
Methods
The study was designed as a register study based on data from the National Medical Birth Register (MFR), and the National Register of Congenital Anomalies (FOK), a subregister of MFR.
Ethics
This study was approved on the 29th of March 2023 by the Swedish Ethical Review Authority with reference number 2023-00945-01.
Participant selection
All children born in Sweden during the years 2000–2020 and registered in MFR were included in the study. The data from MFR and FOK was received from the National Board of Health and Welfare (SoS), which is the organization that manages the registers. Data in MFR is collected at specific timepoints in infancy or computed from data collected at these timepoints. The variables used in this study were collected/computed at the standardized pediatric evaluation that is performed during the first day of life. The only exemption was the year of birth of the child, which was calculated based on the social security number.
Variable selection and data processing
As the datasets from MFR and FOK provided by SoS were designed to be used in more studies than the present one, only variables relevant to the aims were analysed in the present study. Data from MFR and FOK was merged and matched using the individual anonymized ID-numbers that were the same for all research persons in both original datasets. Variables relevant to the aims of the current study were: anonymized ID-number, year of birth of the child, the child’s diagnoses from MFR or FOK according to ICD-10 [32], and the code for the municipality in which the mother had her registered address when the child was born. New variables were computed, specifically indicating whether or not the child had been given certain diagnoses: CL/P, CP, CL ± P, BCL ± P, UCLP, or BCLP. The in- and exclusion of children in the specific groups are described below. Six new variables, indicating whether or not the mother had her registered address in in each of the six HC regions at the time of childbirth, were created based on the municipality code. The HC regions, and hence the variables, were named Northern, Central, Stockholm, Western, Southeastern, and Southern (Swedish: Norra, Mellansverige, Stockholm-Gotland, Västra, Sydöstra, Södra). Hereafter, “place of birth” refers to where the mother had her registered address at childbirth.
Cleft type subgroups
For the analyses focusing on cleft subtypes, five different subgroups were used:
- Group 1: All children with CP (Q35.X diagnosis according to ICD-10).
- Group 2: All children with clefts including the lip: CL±P (Q36.X or Q37.X).
- Group 3: All children with bilateral clefts including the lip: BCL ± P (Q36.0, Q37.2, Q37.4, or Q37.8).
- Group 4: All children with UCLP (Q37.3, Q37.5, or Q37.9).
- Group 5: All children with BCLP (Q37.2, Q37.4, or Q37.8).
Some children had more than one registered cleft diagnosis. If the combination of diagnoses was plausible, the child could be included in two groups. However, if the combination was not plausible, the child was excluded from one of the groups. The rationale for in-/exclusion of these children from the subgroups is described in detail in our previous publication together with a flowchart. In short:
- Children with both a CP and cleft lip without cleft palate (CL-P) diagnosis were included in both group 1 and group 2.
- Children with both a UCLP and bilateral cleft lip without cleft palate (BCL-P) were included in both group 3 and group 5.
- Children with both a CP and either a UCLP or BCLP diagnosis were excluded from the CP group (group 1) and included only in group 4 or group 5.
- Children with both a UCLP and BCLP diagnosis were excluded from the UCLP group (group 4) and included only in group 5.
Statistics
Statistical calculations were performed in IBM SPSS Statistics (version 29.0.2.0) and Microsoft Excel for Mac (version 16.92). Birth prevalence was calculated through dividing the number of cases by the total number of births. Ninety-five percent confidence intervals for birth prevalences were calculated using the following equation: Birtℎ prevalence ± 1.96 standard deviations (SD). SDs were calculated using the following equation:

For trends in birth prevalence over time and differences between HC regions, modified Poisson regression analyses were used. This method was chosen to study the number of events (cleft births) in the population, with a binary dependent variable (cleft diagnosis: yes/no). For trend analyses, year of birth was used as a continuous independent variable. For comparisons between HC regions, one region at a time was compared to the other five regions combined using Poisson regression, with the region in question as a binary independent variable (born in region: yes/no). Children missing data regarding place of birth were excluded from all analyses.
Results
In total, 3,386 of the 2,230,0771 children born in 2000–2020 and included in MFR were given a CL/P diagnosis. One thousand eight hundred and seventy-seven children were lacking information about place of birth and were excluded from the analyses, and among them, six children had been given a CL/P diagnosis. Out of the 3,380 remaining children with a CL/P diagnosis, 308 were born in the Northern HC region, 644 in the Central HC region, 805 in the Stockholm HC region, 618 in the Western HC region, 369 in the Southeastern HC region, and 636 in the Southern HC region.
Following the rationale for inclusion and exclusion of children with more than one cleft diagnosis, eight children were excluded from the CP group as they also had a CLP diagnosis. Twenty-three children were excluded from the UCLP group as they were also given a BCLP diagnosis in the register. Twenty-nine children were included in both the CP and CL ± P group as they were given both diagnoses in the register, and five children were included in both the BCL ± P and the UCLP group for the same reason. Table 1 shows the dataset details for the whole country, whilst the yearly numbers of cases per HC region are shown in Appendices 1–6. All the data used in the statistical calculations and models is shown in the tables and appendices.
| Health care region | All births (%) | CL/P (%) | No CL/P (%) |
| Northern | 184,255 (8.3) | 308 (9.1) | 183,947 (8.3) |
| Central | 431,592 (19.3) | 644 (19.0) | 430,948 (19.3) |
| Stockholm | 570,471 (25.6) | 805 (23.8) | 569,666 (25.6) |
| Western | 418,475 (18.8) | 618 (18.3) | 417,857 (18.8) |
| Southeastern | 224,117 (10.0) | 369 (10.9) | 223,748 (10.0) |
| Southern | 399,984 (17.9) | 636 (18.8) | 399,348 (17.9) |
| Missing data on region of birth* | 1,877 (0.1) | 6 (0.2) | 1,871 (0.1) |
| Sweden | 2,230,771 (100.0) | 3,386 (100.0) | 2,227,385 (100.0) |
| *Excluded from statistical analyses. CL/P: cleft lip and/or palate. |
|||
Birth prevalences
The birth prevalence of CL/P per 1000 births was 1.67 (95% confidence interval 1.49–1.86) in the Northern HC region, 1.49 (1.38–1.61) in the Central HC region, 1.41 (1.31–1.51) in the Stockholm HC region, 1.48 (1.36–1.59) in the Western HC region, 1.65 (1.48–1.81) in the Southeastern HC region, and 1.59 (1.47–1.71) in the Southern HC region. Birth prevalences for the different cleft subtypes per region are shown in Table 2.
Regional differences
The birth prevalences of CL/P and cleft subtypes for each HC region were compared to the rest of the country. In the Northern HC region, a higher birth prevalence of CP was observed compared to the rest of Sweden, with a risk ratio (RR) of 1.319. The Central and Western HC regions showed no significantly different birth prevalences compared to the rest of Sweden. In the Stockholm HC region, all analyses except that of CP showed lower birth prevalences compared to the rest of the country (RR CL/P 0.909, RR CL ± P 0.842, RR BCL ± P 0.711, RR UCLP 0.803, RR BCLP 0.742). In the Southeastern HC region, the birth prevalences of CL ± P (RR 1.173), BCL ± P (RR 1.410), and BCLP (RR 1.447) were higher compared to the rest of Sweden. Lastly, the birth prevalences in the Southern HC region were higher than those of the rest of the country for CL ± P (RR 1.133) and BCL ± P (RR 1.314). The statistically significant findings are presented in Table 3.
Trends over time
The Poisson regression models used to examine trends over time showed varying trends in the different HC regions. No increasing birth prevalences were found. For the whole CL/P group, birth prevalences were declining significantly in the Northern, Central, and Southern HC regions, with RRs per year of 0.968, 0.980, and 0.986, respectively. For CP, no significant changes in birth prevalences were observed. CL ± P birth prevalences showed decreasing numbers in the Northern (RR 0.956), Central (RR 0.976), and Southern (RR 0.973) HC regions. BCL ± P became less common in the Northern (RR 0.942), Western (RR 0.955), and Southern (RR 0.948) HC regions. UCLP birth prevalences showed decreasing numbers in the Northern (RR 0.955) and Southern (RR 0.968) HC regions. Lastly, BCLP birth prevalences showed decreasing numbers in the Western (RR 0.948) and Southern (RR 0.945) HC regions. Notably, no changes in birth prevalences were observed in the Stockholm and Southeastern HC regions.
Although all cleft type subgroups were analyzed for each HC region, only statistically significant findings are presented. Yearly point estimates and the Poisson regression models illustrating the declining birth prevalences found in the Northern, Central, Western, and Southern HC regions are shown graphically in Figures 2–5, respectively. Error bars are only shown for yearly estimates of CL/P birth prevalence. The statistically significant results from the Poisson regression models are shown in Table 4.
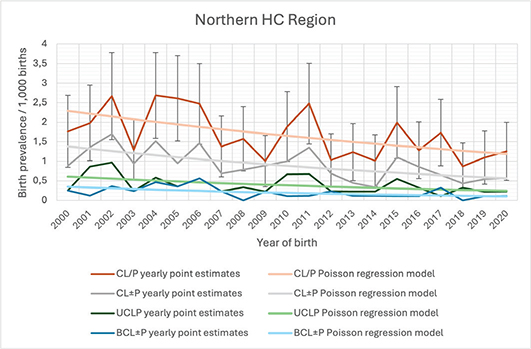
Figure 2. CL/P and cleft subtype birth prevalences, Northern health care region, 2000-2020.
Error bars indicate 95% confidence intervals for CL/P yearly point estimates.
Abbreviations: CL/P = cleft lip and/or palate. CL±P = cleft lip with/without cleft palate. BCL±P = bilateral cleft lip with/without cleft palate. UCLP = unilateral cleft lip and palate.
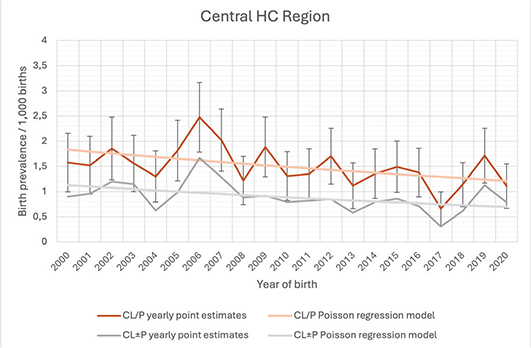
Figure 3. CL/P and cleft subtype birth prevalences, Central health care region, 2000-2020.
Error bars indicate 95% confidence intervals for CL/P yearly point estimates.
Abbreviations: CL/P = cleft lip and/or palate. CL±P = cleft lip with/without cleft palate.
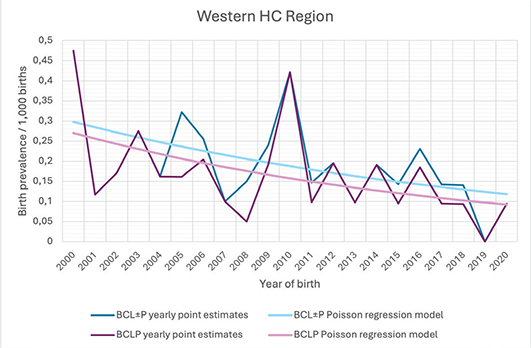
Figure 4. Cleft subtype birth prevalences, Western health care region, 2000-2020.
Abbreviations: BCL±P = bilateral cleft lip with/without cleft palate. BCLP = bilateral cleft lip and palate.
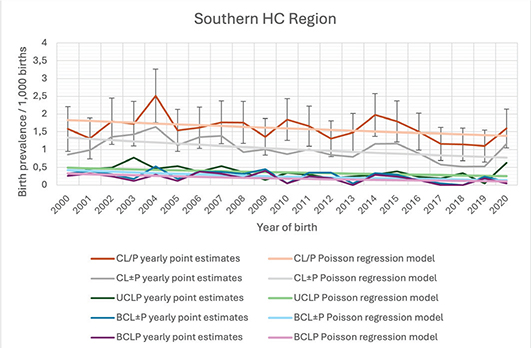
Figure 5. CL/P and cleft subtype birth prevalences, Southern health care region, 2000-2020.
Error bars indicate 95% confidence intervals for CL/P yearly point estimates.
Abbreviations: CL/P = cleft lip and/or palate. CL±P = cleft lip with/without cleft palate. BCL±P = bilateral cleft lip with/without cleft palate. UCLP = unilateral cleft lip and palate. BCLP = bilateral cleft lip and palate.
Discussion
The findings in the present study indicate that there were regional differences in the birth prevalences of CL/P and cleft subtypes in Sweden, both when it comes to absolute numbers and trends during the studied 21-year period. No increasing birth prevalences were found, but decreasing numbers were found in at least two HC regions for all studied subgroups except CP. This is in accordance with the findings in our previous study of the whole country, where decreasing trends were seen for CL/P and all subgroups except CP [27]. However, it should be noted that even if decreasing trends were seen, the relative yearly variations were quite substantial. This was true especially when it comes to the less frequently occurring cleft subtypes (BCL ± P, BCLP).
Differences between HC regions
Statistically significant differences in birth prevalences between specific HC regions and the rest of the country were observed. For the whole CL/P group, the only different birth prevalence could be seen in the Stockholm HC region where it was significantly lower. This seems to be explained by lower birth prevalences of clefts involving the lip (CL ± P, BCL ± P, UCLP, BCLP), which all showed significantly lower birth prevalences in the Stockholm HC region. The reasons for this observation cannot be determined with certainty in this study, but could include the fact that Stockholm is the most densely populated [33] and economically affluent [34] HC region in the country. For this reason, women in Stockholm might have better access to prenatal diagnostics, public or private, than those living in other HC regions. Furthermore it has been shown in previous studies that the risk of CL/P decreases with higher socioeconomic status [23, 24]. However, as public health care is free in Sweden and the socioeconomic level is generally high in the whole country, it seems unlikely that this is the only reason for the lower birth prevalences in Stockholm. Additionally, Stockholm has the highest proportion of people born abroad [35]. Both cultural and genetic differences of the Stockholm population compared to the rest of the country might contribute to the lower birth prevalences observed there. Lastly, Stockholm demonstrated no declining temporal trends for any cleft subtype (see below). Declining trends were seen in all other HC regions except the Southeastern. It is possible that the changes that are currently taking place in other parts of the country have already happened in Stockholm since advancements in health care, public health, and preventive care might reach the most densely populated and affluent areas first.
The Northern HC region was the only region where a higher birth prevalence of CP could be seen compared to the rest of the country, with a birth prevalence of 0.79 / 1,000 births compared to 0.56–0.62 / 1,000 in the other HC regions. Similar findings have been reported in a previous Swedish study [29]. Studies have also shown higher birth prevalences of CP in Finland than in the rest of Europe [36], and a significantly higher proportion of CP in the Finnish CL/P group as a whole [37]. A recent Finnish study suggested that the higher proportion of CP in certain Finnish regions is a result of a higher occurrence of a single nucleotide polymorphism in the IRFF6 gene in these regions [38]. The northern parts of Sweden have historically had close connections with Finland, and a substantial number of people in northern Sweden speak Finnish and/or identify as Finns. Hence, it is likely that the Finnish population is genetically more similar to that of Swedes living in the northern parts of the country than those living in the south.
Clefts involving the lip were more frequently occurring in the Southeastern and Southern HC regions compared to the rest of the country. In both regions, higher birth frequencies of CL ± P and BCL ± P were seen, as well as for BCLP in the Southeastern HC region. That complete clefts (UCLP in both, BCLP in the Southern HC region) were not more common may suggest that the birth prevalence of clefts involving only the lip, a group that was not studied in the present study, was high in the two HC regions. However, it could also be because the effect sizes and groups were too small to detect subtle differences. Indeed, the RRs for UCLP in both HC regions as well as for BCLP in the Southern HC region were above 1.0, although not statistically significant.
Trends over time
The birth prevalence of the whole CL/P group decreased in three out of six HC regions, as did CL ± P and BCL ± P. Complete clefts (UCLP and BCLP) showed decreasing trends in two out of six regions. The trends were most apparent in the Southern HC region, where all birth prevalences except CP showed a decline, and in the Northern HC region, where all but CP and BCLP decreased. The reasons for the stable birth prevalence of CP are discussed more in detail in our previous publication [27], and could include changes in attitudes towards pregnancy termination as prenatal diagnostics through ultrasonography is less sensitive for CP than for CL ± P [39, 40]. It should also be noted that the formation of CP is different from that of CL ± P [2, 41], and it is likely that the effects of both environmental and genetic factors on the risks of a child being born with the specific subtypes differ between subtypes.
Strengths and limitations
A strength of the present study is the large dataset which included the vast majority of children born in Sweden during the years 2000–2020. Since the degree of coverage of MFR is high, the dataset should be highly representative of all children born in Sweden during this period. The high number of included children allowed for detection of trends over time despite the variance in the yearly estimations, and detection of subtle differences between regions. Limitations include the risk of missing data on CL/P diagnoses, although this is likely rare as all children born in Sweden undergo pediatric examination during the first day of life, including palpation of the palate. Erroneous reporting of cleft type, such as a UCLP being reported as a cleft lip and a cleft palate separately might occur more frequently. There were 100 children who were given more than one CL/P diagnosis, approximately 3% of the 3,386 children born with cleft. Assessing how many of them that had erroneously been given two diagnoses is difficult, as reporting two cleft types for the same child could also be correct in some cases. Overall, however, the group with more than one diagnosis was relatively small. It should be acknowledged that reporting errors might occur for children with only one registered diagnosis as well, but the frequency of such errors could not be reliably estimated in the dataset. Lastly, a number of children were lacking data regarding place of birth and were hence excluded from the analyses. This number represented only 0.1% (1,877/2,230,771) of the study population and 0.2% (6/3.386) of the children born with CL/P. Although there was an overrepresentation of children missing data on place of birth in the CL/P group compared to the whole study population, it is unlikely that it affected the results in a significant way since the group with missing data was relatively small.
Clinical relevance
From a clinical perspective, the effect sizes of the differences observed in this study need to be assessed. All significantly decreasing birth prevalence had an RR per year of between 0.942 and 0.986, meaning the risk of a child being born with the diagnosis declined by between 1.4% and 5.8% with every 1-year increase in year of birth. If these trends persist in the future, it will take several years of a 1.4% yearly decrease in birth prevalence before the decline will be clearly noticeable in clinical practice. After 10 years, the birth prevalence will only have decreased by 13.2% (0.94210 = 0.868). However, with a decline of 5.8% per year, the birth prevalence is almost halved over a 10-year period (0.94210 = 0.550). Hence, the birth prevalences where the most pronounced decreases were observed might be most relevant to clinical practice. Bilateral clefts (BCL ± P, BCLP) decreased the most, with RRs per year ranging from 0.942 to 0.955 in the Northern, Western, and Southern HC regions. The decline in birth prevalence of the whole CL/P group, RR per year 0.956, in the Northern HC region should also be noted. This region already has the smallest CL/P population, and with declining birth prevalence, it will become even smaller relative to the other HC regions over time.
Future perspectives
To better understand the reasons behind the regional differences in CL/P birth prevalences in Sweden, and to get a better understanding of the etiology behind the malformation, future studies could focus on examining risk factors and their effect on CL/P birth prevalence. Statistical models adjusted for maternal smoking could be used to determine the effect of smoking on the risk of CL/P. Other risk factors that could be explored include maternal medication use, maternal BMI, parental age, parental education level, and socioeconomic status. Furthermore, abortion rates could be studied further in order to examine whether changes in attitudes towards abortion and changing access to prenatal diagnostics affect the birth prevalence. However, such studies could prove difficult in Sweden where specifying the reason for pregnancy termination is not mandatory. Our dataset includes information regarding many of these potential risk factors, and we plan on continuing our research by examining them further.
Conclusions
In conclusion, decreasing birth prevalences of several cleft subtypes were observed in the different Swedish HC regions. Bilateral clefts decreased the most, something that will change the panorama of cleft phenotypes in the HC regions where these trends could be seen. The Stockholm HC region demonstrated birth prevalences that were lower than the rest of Sweden, for the larger CL/P group as well as for all studied cleft subtypes except CP. Notably, these subtypes all involve clefts of the lip, where the accuracy of antenatal diagnostics using ultrasonography is higher than in the CP group. The reasons for the lower birth prevalences in Stockholm need further examination before conclusions can be drawn, but could include genetics, a different approach to pregnancy termination, or socioeconomic factors. The dataset used in the present study includes variables regarding a wide range of potential risk factors for CL/P. The effect of these risk factors will be examined further in future studies, in order to find explanations for the trends and regional differences observed in this study and to better understand the epidemiology and etiology behind CL/P.
References
[1] Panamonta V, Pradubwong S, Panamonta M, et al. Global birth prevalence of orofacial clefts: a systematic review. J Med Assoc Thai. 2015;98 Suppl 7:S11–S121.
[2] Mossey PA, Little J, Munger RG, et al. Cleft lip and palate. Lancet. 2009;374(9703):1773–1785. https://doi.org/10.1016/S0140-6736(09)60695-4
[3] Murray JC. Gene/environment causes of cleft lip and/or palate. Clin Genet. 2002;61(4):248–256. https://doi.org/10.1034/j.1399-0004.2002.610402.x
[4] Croen LA, Shaw GM, Wasserman CR, et al. Racial and ethnic variations in the prevalence of orofacial clefts in California, 1983–1992. Am J Med Genet. 1998;79(1):42–47. https://doi.org/10.1002/(SICI)1096-8628(19980827)79:1<42::AID-AJMG11>3.0.CO;2-M
[5] Taritsa IC, Ledwon JK, Bajaj A, Gosain AK. 12-Year Trends of Orofacial Clefts in the United States: Highlighting Racial/Ethnic Differences in Prevalence of Cleft Lip and Cleft Palate. Cleft Palate Craniofac J. 2025 May;62(5):820-828. https://doi.org/10.1177/10556656241227033. Epub 2024 Jan 30.
[6] Msamati BC, Igbigbi PS, Chisi JE. The incidence of cleft lip, cleft palate, hydrocephalus and spina bifida at Queen Elizabeth Central Hospital, Blantyre, Malawi. Cent Afr J Med. 2000;46(11): 292–296. https://doi.org/10.4314/cajm.v46i11.8572
[7] Iregbulem LM. The incidence of cleft lip and palate in Nigeria. Cleft Palate J. 1982;19(3):201–205.
[8] Zucchero TM, Cooper ME, Maher BS, et al. Interferon regulatory factor 6 (IRF6) gene variants and the risk of isolated cleft lip or palate. N Engl J Med. 2004;351(8):769–780. https://doi.org/10.1056/NEJMoa032909
[9] Setó-Salvia N, Stanier P. Genetics of cleft lip and/or cleft palate: association with other common anomalies. Eur J Med Genet. 2014;57(8):381–393. https://doi.org/10.1016/j.ejmg.2014.04.003
[10] Mitchell LE, Risch N. Mode of inheritance of nonsyndromic cleft lip with or without cleft palate: a reanalysis. Am J Hum Genet. 1992;51(2):323–332.
[11] Wyszynski DF, Zeiger J, Tilli MT, et al. Survey of genetic counselors and clinical geneticists regarding recurrence risks for families with nonsyndromic cleft lip with or without cleft palate. Am J Med Genet. 1998;79(3):184–190. https://doi.org/10.1002/(SICI)1096-8628(19980923)79:3<184::AID-AJMG6>3.0.CO;2-N
[12] Grosen D, Chevrier C, Skytthe A, et al. A cohort study of recurrence patterns among more than 54,000 relatives of oral cleft cases in Denmark: support for the multifactorial threshold model of inheritance. J Med Genet. 2010;47(3):162–168. https://doi.org/10.1136/jmg.2009.069385
[13] Källén K. Maternal smoking and orofacial clefts. Cleft Palate Craniofac J. 1997;34(1):11–16. https://doi.org/10.1597/1545-1569_1997_034_0011_msaoc_2.3.co_2
[14] Martelli DR, Coletta RD, Oliveira EA, et al. Association between maternal smoking, gender, and cleft lip and palate. Braz J Otorhinolaryngol. 2015;81(5):514–519. https://doi.org/10.1016/j.bjorl.2015.07.011
[15] Wyszynski DF, Duffy DL, Beaty TH. Maternal cigarette smoking and oral clefts: a meta-analysis. Cleft Palate Craniofac J. 1997;34(3):206–210. https://doi.org/10.1597/1545-1569_1997_034_0206_mcsaoc_2.3.co_2
[16] Abrishamchian AR, Khoury MJ, Calle EE. The contribution of maternal epilepsy and its treatment to the etiology of oral clefts: a population based case-control study. Genet Epidemiol. 1994;11(4):343–351. https://doi.org/10.1002/gepi.1370110404
[17] Park-Wyllie L, Mazzotta P, Pastuszak A, et al. Birth defects after maternal exposure to corticosteroids: prospective cohort study and meta-analysis of epidemiological studies. Teratology. 2000;62(6):385–392. https://doi.org/10.1002/1096-9926(200012)62:6<385::AID-TERA5>3.0.CO;2-Z
[18] Brentlinger PE. Folic acid antagonists during pregnancy and risk of birth defects. N Engl J Med. 2001;344(12):933–934; author reply 4–5. https://doi.org/10.1056/NEJM200103223441212
[19] Cedergren M, Källén B. Maternal obesity and the risk for orofacial clefts in the offspring. Cleft Palate Craniofac J. 2005;42(4):367–371. https://doi.org/10.1597/04-012.1
[20] Movva VC, Spangler B, Young AJ, et al. A retrospective review of the association between maternal body mass index and the risk of congenital anomalies. Congenit Anom (Kyoto). 2024;64(1):17–22. https://doi.org/10.1111/cga.12544
[21] Ahmed Sakran K, Mutahar Abotaleb B, Khaled Al-Rokhami R, et al. Analysis of environmental exposures for nonsyndromic cleft lip and/or palate: a case-control study. Iran J Public Health. 2022;51(3):578–586. https://doi.org/10.18502/ijph.v51i3.8934
[22] Johnson CY, Little J. Folate intake, markers of folate status and oral clefts: is the evidence converging? Int J Epidemiol. 2008;37(5):1041–1058. https://doi.org/10.1093/ije/dyn098
[23] Clark JD, Mossey PA, Sharp L, et al. Socioeconomic status and orofacial clefts in Scotland, 1989 to 1998. Cleft Palate Craniofac J. 2003;40(5):481–485. https://doi.org/10.1597/1545-1569_2003_040_0481_ssaoci_2.0.co_2
[24] Lupo PJ, Danysh HE, Symanski E, et al. Neighborhood-based socioeconomic position and risk of oral clefts among offspring. Am J Public Health. 2015;105(12):2518–2525. https://doi.org/10.2105/AJPH.2015.302804
[25] Figueiredo JC, Ly S, Magee KS, et al. Parental risk factors for oral clefts among Central Africans, Southeast Asians, and Central Americans. Birth Defects Res A Clin Mol Teratol. 2015;103(10):863–879. https://doi.org/10.1002/bdra.23417
[26] Mbuyi-Musanzayi S, Kayembe TJ, Kashal MK, et al. Non-syndromic cleft lip and/or cleft palate: Epidemiology and risk factors in Lubumbashi (DR Congo), a case-control study. J Craniomaxillofac Surg. 2018;46(7):1051–1058. https://doi.org/10.1016/j.jcms.2018.05.006
[27] Cornefjord M, Källén K, Klintö K, Stiernman M, Wiedel AP, Becker M. Birth prevalence of cleft lip and/or palate - a register study of all children born in Sweden years 2000-2020. J Plast Surg Hand Surg. 2025 Jun 3;60:120-126. https://doi.org/10.2340/jphs.v60.43739.
[28] Hagberg C, Larson O, Milerad J. Incidence of cleft lip and palate and risks of additional malformations. Cleft Palate Craniofacial J. 1998;35(1):40–45. https://doi.org/10.1597/1545-1569_1998_035_0040_ioclap_2.3.co_2
[29] Beckman L, Myrberg N. The incidence of cleft lip and palate in Northern Sweden. Hum Hered. 1972;22(5):417–422. https://doi.org/10.1159/000152519
[30] Chetpakdeechit W, Mohlin B, Persson C, et al. Cleft extension and risks of other birth defects in children with isolated cleft palate. Acta Odontol Scand. 2010;68(2):86–90. https://doi.org/10.3109/00016350903258003
[31] Lokal_Profil. A map of the health care regions and municipalities of Sweden [Internet]. 2010 [cited 2025 Aug 18]. Available from: https://commons.wikimedia.org/wiki/File:SWE-Map_Sjukv%C3%A5rdsregioner-kommuner.svg

[32] World Health Organization. International statistical classification of diseases and related health problems 10th revision (ICD-10) [Internet]. 2016 [cited 2025 Apr 03]. Available from: https://icd.who.int/browse10/2016/en
[33] Sweden S. Befolkningstäthet i Sverige [Internet]. 2025 [cited 2025 Apr 09]. Available from: https://www.scb.se/hitta-statistik/sverige-i-siffror/manniskorna-i-sverige/befolkningstathet-i-sverige/?
[34] Sweden S. Varied development in gross regional domestic product (GRDP) in 2022 [Internet]. 2024 [cited 2025 Apr 09]. Available from: https://www.scb.se/en/finding-statistics/statistics-by-subject-area/national-accounts/national-accounts/regional-accounts/pong/statistical-news/regional-accounts-2022/
[35] Sweden S. Utrikes födda i Sverige [Internet]. 2025 [cited 2025 Apr 10]. Available from: https://www.scb.se/hitta-statistik/sverige-i-siffror/manniskorna-i-sverige/utrikes-fodda-i-sverige/#utrikes-fodda-per-region
[36] Calzolari E, Bianchi F, Rubini M, et al. Epidemiology of cleft palate in Europe: implications for genetic research. Cleft Palate Craniofac J. 2004;41(3):244–249. https://doi.org/10.1597/02-074.1
[37] Rintala AE. Epidemiology of orofacial clefts in Finland: a review. Ann Plast Surg. 1986;17(6):456–459. https://doi.org/10.1097/00000637-198612000-00004
[38] Rahimov F, Nieminen P, Kumari P, et al. High incidence and geographic distribution of cleft palate in Finland are associated with the IRF6 gene. Nat Commun. 2024;15(1):9568. https://doi.org/10.1038/s41467-024-53634-2
[39] Clementi M, Tenconi R, Bianchi F, et al. Evaluation of prenatal diagnosis of cleft lip with or without cleft palate and cleft palate by ultrasound: experience from 20 European registries. EUROSCAN study group. Prenat Diagn. 2000;20(11):870–875. https://doi.org/10.1002/1097-0223(200011)20:11<870::AID-PD940>3.0.CO;2-J
[40] Guichoud Y, El Ezzi O, de Buys Roessingh AS. Cleft lip and palate antenatal diagnosis: A Swiss University Center performance analysis. Diagnostics. 2023;13:1–10. https://doi.org/10.3390/diagnostics13152479
[41] Dixon MJ, Marazita ML, Beaty TH, et al. Cleft lip and palate: understanding genetic and environmental influences. Nat Rev Genet. 2011;12(3):167–178. https://doi.org/10.1038/nrg2933