ORIGINAL RESEARCH ARTICLE
Validation of the triangular prism method using computed tomography to estimate DIEP flap weight in routine clinical practice – a St Andrew free flap audit registry study
Emma Hanssona,b,c*  , Venkat Ramakrishnanc,d, Olivia Sharpe, Thaj Rehmanf and Mary Morganc,d
aDepartment of Plastic Surgery, Institute of Clinical Sciences, The Sahlgrenska Academy, University of Gothenburg, Gothenburg, Sweden; bDepartment of Plastic Surgery, Sahlgrenska University Hospital, Region Västra Götaland, Gothenburg, Sweden; cSt. Andrew’s Centre for Plastic Surgery and Burns, Broomfield Hospital, Mid and South Essex Hospital Services NHS Trust, Chelmsford, United Kingdom; dSt Andrew’s Anglia Ruskin (StAAR) Research Group, Faculty of Health, Education, Medicine & Social Care, Anglia Ruskin University, Cambridge, United Kingdom; eDepartment of Plastic and Reconstructive Surgery, Royal Marsden Hospital, London, United Kingdom; fDepartment of Clinical Radiology, Basildon University Hospital, Mid and South Essex Hospital Services NHS Trust, Basildon, United Kingdom
ABSTRACT
Introduction: An accurate preoperative estimation of deep inferior epigastric perforator (DIEP) flaps in breast reconstruction facilitates planning. Different methods have been proposed, but few methods have been validated for the degree of agreement with harvested volume, and none have been validated in a more significant cohort. This article aimed to validate the triangular prism method using computed tomography (CT) to estimate DIEP weight in routine clinical practice.
Methods: The triangular prism method, previously described by Nanidis, Ridha, and Jallali, uses CT to estimate DIEP flap weight, used in clinical practice in the department, was evaluated. The study included 1 year of consecutive patients, and data were extracted from the department’s free flap audit registry. Bland Altman plots with mean bias and limits of agreement (LOA) with confidence intervals were drawn to estimate agreement between the estimated and actual flap weight.
Results and conclusions: A total of 164 DIEPs were recorded, and complete data were available for 119 DIEPs (73%). The mean estimated flap weight was 979 g (range: 251–2,125, SD [standard deviation] 448), and the actual flap weight was 937 g (range: 303–2,792, SD 461). The Bland-Altman plot showed that the estimated weight overestimated the actual weight by an average of 41 grams. However, the LOAs of –530 and 614 grams far exceed the a priori set limits of maximum acceptable difference (100 grams) between the estimated and the actual flap weight. Further studies are needed regarding how the triangular prism method can be combined with clinical measurements to become an easily used and reliable tool.
KEYWORDS: DIEP flap; breast reconstruction; flap weight estimation; computed tomography; preoperative planning; microsurgery
Citation: Journal of Plastic Surgery and Hand Surgery 2025; 60: 191–195. DOI: https://doi.org/10.2340/jphs.v60.44801.
Copyright: © 2025 The Author(s). Published by MJS Publishing on behalf of Acta Chirurgica Scandinavica. This is an Open Access article distributed under the terms of the Creative Commons Attribution 4.0 International License (http://creativecommons.org/licenses/by/4.0/), allowing third parties to copy and redistribute the material in any medium or format and to remix, transform, and build upon the material, with the condition of proper attribution to the original work.
Received: 23 April 2025; Accepted: 3 September 2025; Published: 16 October 2025
CONTACT: Emma Hansson emma.hansson.2@gu.se Department of Plastic Surgery, Sahlgrenska University Hospital, Gröna Stråket 8, SE-413 45, Gothenburg, Sweden
*At time of data analysis and writing of the manuscript.
Supplemental data for this article can be accessed online at https://doi.org/10.2340/jphs.v60.44801
Introduction
Abdominal flaps, such as the deep inferior epigastric perforator (DIEP) flap, are the most commonly used free flaps in breast reconstruction. The widespread use of the technique has pushed boundaries, and nowadays, it is also used in thin patients with a limited abdominal pannus, which has created a need for a reliable and clinically applicable method for preoperative estimation of harvestable flap weight. An accurate estimation facilitates preoperative planning, for example, whether a flap needs to be bi-pedicled [1, 2] or stacked with another type of free flap [3], or the range of implants to have available in case of a hybrid breast reconstruction [4].
Different methods have been proposed for the estimation of harvestable flap weight; for example, clinical measurements, including pinch measured with a calliper [5, 6] or computed tomography (CT) measurements requiring designated software [2, 7–9]. Few methods have been validated for the accuracy of prediction of harvested volume, and none have been validated in routine clinical practice with a more significant cohort. One method using routine computed tomography angiography (CTA) without designated software has been described: the triangular prism method [10]. At the St. Andrew Centre of Plastic Surgery and Burns, the triangular prism method has been adopted in routine clinical practice, and therefore, this article evaluates the method.
The triangular prism method using CT to estimate DIEP flap weight was described in 2014 by Nanidis, Ridha, and Jallali [10]. The method calculates the estimated volume based on CTA measurements (performed as standard preoperatively to investigate perforator anatomy and branching patterns) and applies a mathematical formula. The triangular prism method was validated by comparing estimated flap weight with actual flap weight in 32 patients with a mean estimated flap weight of 645 g (range: 293–1,254) and actual flap weight of 642 g (range: 300–1,290) (mean difference 41 g, range: 0–163 and a mean estimated error of 6.8% (range 0–35%) (calculated from the figures given in Tables 1 and 2 of [10]). The method has also been externally validated in 36 patients by Kato et al. [11]. Compared with the actual flap weight, the intraclass correlation coefficients (ICCs) were 0.24 (95% CI [confidence intervals] –0.11 to 0.58), and the mean differences between the estimated and actual weight were –492 (SD [standard deviation] 519) [11].
This article aimed to validate the triangular prism method using CT to estimate DIEP flap weight [9] in routine clinical practice. Data from a consecutive series of patients operated on in the St Andrew’s Centre of Plastic Surgery and Burns and evaluated by the same consultant radiologist were investigated.
Patients and methods
Patients and flap weights
The triangular prism method using CTA to estimate DIEP flap weight [10] is used in clinical practice in the St Andrew’s Centre of Plastic Surgery and Burns and recorded in the department’s free flap audit registry. The study included 1 year of consecutive patients operated on with DIEP flaps, with recorded estimated flap volume and actual flap volume in the registry. Muscle-sparing TRAMs were excluded in keeping with in the original description of the method [10].
The estimated flap volume was calculated as Nanidis, Ridha, and Jallali described previously. The formula uses three measurements from the axial and sagittal CTA performed with the patient in a supine position: the base of the flap (b) defined as extending from the inferior edge of the umbilicus insertion on the rectus sheath to the superior edge of the symphysis pubis, the height of the flap (h) extending from a point created by drawing the line at 45 degrees from the lateral edge of the anterior superior iliac spine to the abdominal skin in the midline, and the thickness of the flap (t) from the skin to the linea alba in the midline. This created a prism from which the volume of a hemi flap can be calculated using the formula Vp = ½*(bh)t, which is then multiplied by the gravity of subcutaneous fat (0.907 g/cm3 ≈ 1 g/cm3) to convert it from cubic centimetres (cm3) to grams (g) to create the flap volume weight if in grams?(Vf) [10]. The same consultant radiologist performed the measurements and calculations on all CTAs (TR). The actual flap weight, all the tissue harvested from the abdomen, was weighed intraoperatively on scales in whole grams. The actual flap weight was considered the gold standard for the harvestable flap volume.
Statistics
As in the original article, descriptive data were given as means, ranges, and SDs. To allow for comparison with previous publications on the method [10, 11], the mean estimate error was calculated as the difference between the estimated flap weight and the actual flap weight divided by the actual flap weight, as in the original publication [10]. To test if the differences between the estimated and actual flap weight met the assumptions of normality, the Kolmogorov-Smirnov test was used. Bland–Altman plots with mean bias and respective 95% limits of agreement (LOA) (mean ± 1.96*SD) with CIs [12, 13] were drawn with differences displayed as grams and as average percentages. For interpretation, a 100 g difference between the estimated and actual flap weight was considered a clinically relevant difference (limit set a priori analyses). A sample size calculation was performed using Lu et al.’s method [14] with an expected SD of 50 and a desired precision of 100, based on the a priori set limit, alpha 0.05 and power 0.8. The calculation was performed with ccalculators.co.uk and showed that a sample size of at least 12 pairs of measurements would be needed to demonstrate agreement. All other statistical analyses were performed using Microsoft® Excel version 16 (Redmont, Washington, USA) and SPSS® version 29 (IBM, Armonk, New York, USA) for Mac.
Protocol and ethics
The study was performed as a service evaluation/clinical audit and approved by the Mid and South Essex NHS Foundation Trust (BPDAQI004). Procedures followed were in accordance with the Helsinki Declaration of 1964, as revised, and the Good Clinical Practice (GCP) guidelines. Data were treated following the General Data Protection Regulation (UK GDPR). The data set generated during this study is available in Electronic Supplement 1.
Results
For the chosen year, which was affected by the COVID-19 pandemic, 164 DIEP flaps were recorded, and of them, there were complete estimated and actual flap weight data for 119 DIEPs (73%). The mean estimated flap weight was 979 g (range: 251–2,125, SD 448), and the actual flap weight was 937 g (range: 303–2,792, SD 461). The mean difference was 42 g (range: –804 to 923, SD 292), and the mean estimate error was 8% (range –47 to 122%, SD 30). In 19 cases (12%), the estimated volume was underestimated by > 20% (mean error –31%, range –20 to –48%) and in 26 patients (16%), the estimated volume was overestimated by > 20% (mean error 55%, range 26–122%).
According to the Kolmogorov–Smirnov test, the differences between the estimated and the actual flap weight did not meet the assumption of normal distribution (p = 0.017). The Bland–Altman plot with differences in grams (Figure 1) showed that the estimated weight overestimated the actual weight with an average of 41 g. As we considered 100 grams a clinically significant difference, a mean difference of 41g has to be considered relatively far from zero, and the LOAs of –530 and 614 g far exceed the a priori set limits of maximum acceptable difference between the estimated and the actual flap weight. According to the Bland–Altman plot with differences in percentages (Figure 2), the bias varies and does not have a certain magnitude. The mean difference between estimated and actual flap weight was 4%. Still, the LOAs of –48 and 56%, respectively, clearly demonstrated that the difference between the two measurements exceeds what can be considered an acceptable difference in routine clinical practice.
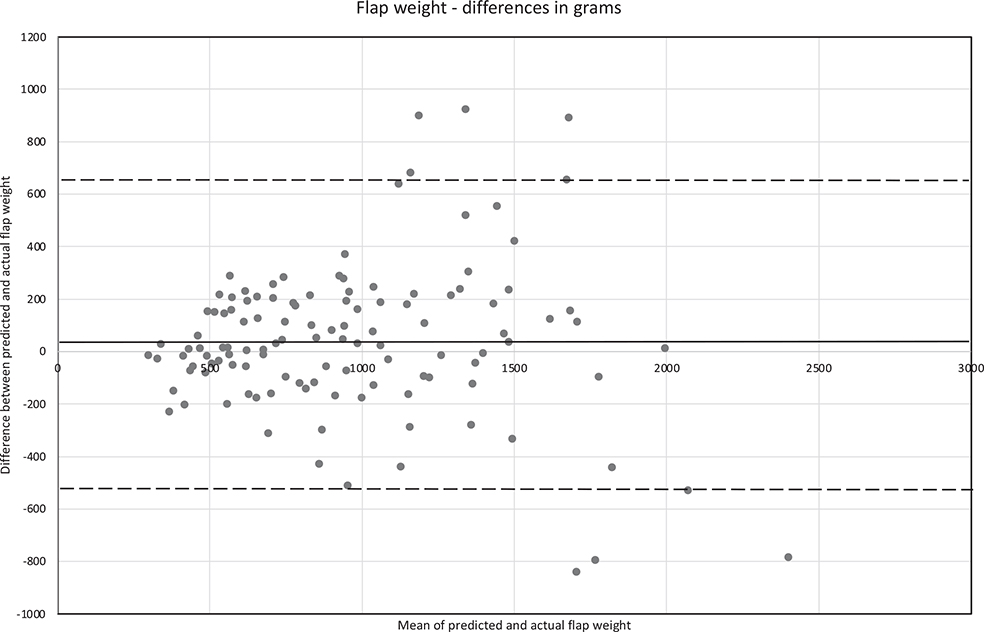
Figure 1. Bland–Altman plot of flap weight with differences in grams. The lower limit of agreement (LOA) is –530 g (CI [confidence intervals] –622 to –439) and upper LOA: 614 g (CI 522–707) (dotted lines). The mean difference between estimated and actual flap weight is 42 g (CI –11 to 95) (solid line).
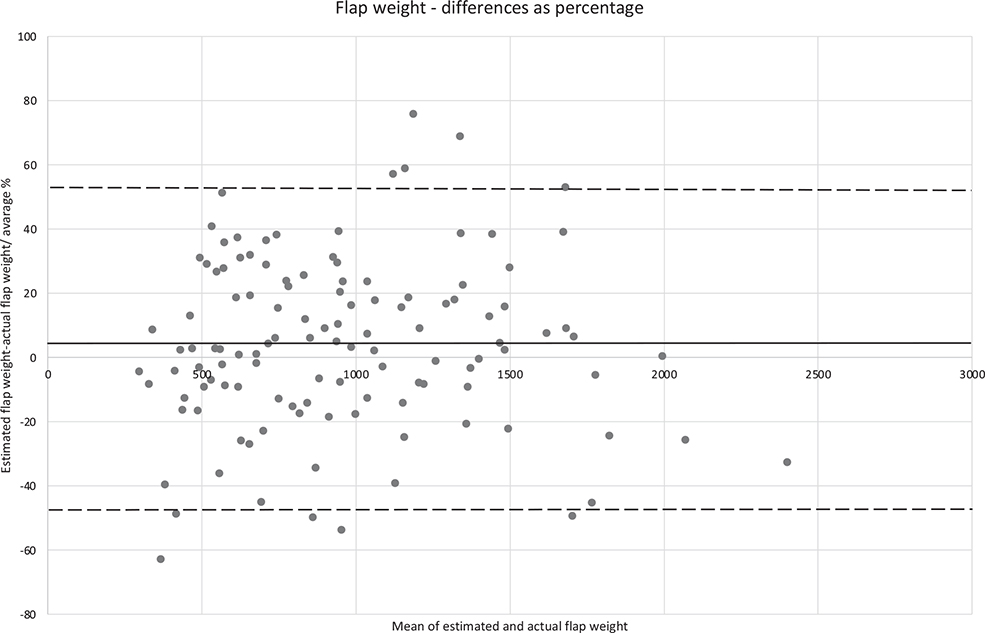
Figure 2. Bland–Altman plot of flap weight with differences as percentages. The lower limit of agreement (LOA) is –48% (CI [confidence intervals] –56 to –40) and the upper LOA is 56% (CI 48–65) (dotted lines). The mean difference between estimated and actual flap weight: 4% (CI –0.7 to –9.0) (solid line).
Discussion
This is the first study investigating the validity of the triangular prism method using CT to estimate DIEP flap weight [10] in routine clinical practice. A consecutive series of patients operated during 1 year in the St Andrew’s Centre of Plastic Surgery and Burns, evaluated by the same radiologist, demonstrated that the method is not accurate enough to estimate harvestable flap weight in individual patients. Bland–Altman plots showed that bias is varying, does not have a certain magnitude and that the difference between the two measurements exceeds what can be considered an acceptable difference in routine clinical practice.
The mean difference between the methods and mean estimated error in this study (41 g and 8%) were very similar to those in the original validation study (43/39 g and 6.8/6.6%) [10] and considerably smaller than in the external validation in which it was –492 g (mean estimated error not reported) [11]. However, the Bland–Altman plots demonstrated that although the mean difference is negligible in our study, it varies considerably, and it is impossible to say anything about the accuracy on an individual patient level, which indicates that the mean difference in method and estimated error might be the wrong method to investigate accuracy between the two methods. The large number of flaps (38%) under or overestimated by more than 20% strengthens this.
The choice of statistical method affects the results. A weakness of Bland–Altman plots is the assumption that the differences between the estimated and actual flap weight are normally distributed, which is not the case in this study. The problem can be solved by logarithmically transforming the data. However, evaluating whether the difference between the methods is clinically relevant becomes impossible. Moreover, Bland and Altman concluded that a non-normal distribution of differences is not as severe when Bland–Altman plots are drawn as in another context, as it is still likely that about 5% of the observations are within about two standard deviations of the mean [13]. Hence, we prioritised clinical interpretability and drew the Bland–Altman plots using the untransformed data.
Some statistical methods might be deceptive when comparing two ways to measure the same variable for accuracy. For example, several previous studies (e.g. [2, 6, 7, 9]) have used the correlation between the estimated and actual flap to validate the method. The correlation investigates the relationship between the two measurements, not their differences. When the same variable is measured with different techniques, there will invariably be a correlation between the two measurements. Therefore, correlations are not recommended for assessing accuracy and agreement between methods [15]. Suppose we perform a Pearson correlation of this study’s estimated and actual flap weight. In that case, we find a coefficient of 0.80 (p < 0.001), illustrating the problem of the statistical method when evaluating agreement. Moreover, it can be difficult to conclude that there is accuracy and agreement between two methods to measure the same variable by formulating a null hypothesis and testing it statistically, as in the original article [10] where a paired t-test was used. A null hypothesis is unlikely to be rejected in a small sample with a minimal trend. A paired t-test compares mean differences between the two measurements in a group with widespread data. The null hypothesis might, therefore, not be rejected, although the difference between the two measurements for individuals is large [15]. Hence, there is a risk that the accuracy of previously published methods to estimate harvestable flap weight might have been overestimated and that agreement might be as poor as demonstrated in this study.
The triangular prism method has a few weaknesses that might affect its accuracy. For example, the method does not consider different body habitus. Some patients might have a more mobile pannus than others, resulting in the harvestable tissue being distributed differently in vivo and on the passive CTA on which the estimation is performed. Moreover, the method does not consider flap design. For example, the surgeon might harvest less or more than the flap defined by the three measurements (b, h and t) by modifying the incision lines and recruiting adipose tissue superiorly and laterally. The issue has previously been recognised by Kato et al., who combined the triangular prism method with physical measurements and found that adding physical measurements resulted in a higher ICC (0.98 (CI –0.11 to 0.98) vs 0.24 (CI 0.83–0.98)) and a minor mean difference between the estimated and actual flap weights (–492 (SD 519) vs –85 (SD 144)) [11]. Hence, the low accuracy found in this study might be explained by a low association between the flap as designed on the CTA and the clinical flap design, which raises the question of whether the triangular prism method by itself is too blunt to estimate harvestable flap weight accurately.
A strength of this study is that it is performed in an actual clinical cohort. However, this is also a weakness and might contribute to the poor accuracy seen in the study. For example, the data are extracted from a clinical audit registry. Some extreme outliers might be explained by the fact that the surgeons have taken less care in registering data accurately than they might have if the data had been collected for a scientific study. For example, in some cases, the surgeons might have forgotten to register the initial flap weight of the entire harvested flap and a hemi flap might have been raised and weighed, or a little trimming might have been performed before weighing (Electronic Supplement 1). Poor registration of the variables estimated and actual flap weight have also led to incomplete data as one or both of the variables were missing for 27% of the DIEPs performed during the chosen year, which might have affected the results; for example, if one of the variables were missed for flaps in a particular weight interval. In brief, the audit registry and study design flaws might have affected the results.
In conclusion, in routine clinical practice, the accuracy of the flap weight estimated with the triangular prism method using CTA is low compared to the actual harvested flap weight. Bland–Altman plots showed that bias is varying, does not have a certain magnitude and that the difference between the two measurements exceeds what can be considered an acceptable difference in routine clinical practice. Further studies are needed regarding how the triangular prism method using CTA can be combined with clinical measurements to become an easily used and reliable tool to estimate harvestable flap weight in routine clinical practice.
References
[1] Patel NG, Rozen WM, Chow WT, et al. Stacked and bipedicled abdominal free flaps for breast reconstruction: Considerations for shaping. Gland Surg. 2016;5(2):115–121. https://doi.org/10.3978/j.issn.2227-684x.2016.02.03
[2] Lee KT, Mun GH. Volumetric planning using computed tomographic angiography improves clinical outcomes in DIEP flap breast reconstruction. Plast Reconstr Surg. 2016;137(5):771e–780e. https://doi.org/10.1097/PRS.0000000000002045
[3] Roggio T, Pantelides NM, Morgan M, et al. Stacked TUG and DIEP flaps to reconstruct a single breast: Expanding the scope of autologous breast reconstruction. J Plast Reconstr Aesthet Surg. 2022;75(9):2974–2981. https://doi.org/10.1016/j.bjps.2022.06.039
[4] Tanna N, Barnett SL, Robinson EL, et al. Hybrid microsurgical breast reconstruction: HyFIL(R) & HyPAD techniques. Clin Plast Surg. 2023;50(2):337–346. https://doi.org/10.1016/j.cps.2022.10.006
[5] Mohanna PN, Farhadi J. A method of preoperatively assessing the volume of abdominal tissue available for an autologous breast reconstruction. Plast Reconstr Surg. 2012;129(4):756e–757e. https://doi.org/10.1097/PRS.0b013e318245e8b4
[6] Woo KJ, Mun GH. Estimation of DIEP flap weight for breast reconstruction by the pinch test. Microsurgery. 2017;37(7):786–792. https://doi.org/10.1002/micr.30217
[7] Minn KW, Hong KY, Lee SW. Preoperative TRAM free flap volume estimation for breast reconstruction in lean patients. Ann Plast Surg. 2010;64(4):397–401. https://doi.org/10.1097/SAP.0b013e3181b143ef
[8] Rosson GD, Shridharani SM, Magarakis M, et al. Three-dimensional computed tomographic angiography to predict weight and volume of deep inferior epigastric artery perforator flap for breast reconstruction. Microsurgery. 2011;31(7):510–516. https://doi.org/10.1002/micr.20910
[9] Eder M, Raith S, Jalali J, et al. Three-dimensional prediction of free-flap volume in autologous breast reconstruction by CT angiography imaging. Int J Comput Assist Radiol Surg. 2014;9(4):541–549. https://doi.org/10.1007/s11548-013-0941-4
[10] Nanidis TG, Ridha H, Jallali N. The use of computed tomography for the estimation of DIEP flap weights in breast reconstruction: A simple mathematical formula. J Plast Reconstr Aesthet Surg. 2014;67(10):1352–1356. https://doi.org/10.1016/j.bjps.2014.05.049
[11] Kato S, Mori H, Koga H, et al. The triangular prism approximation method for volume estimation of deep inferior epigastric artery perforator flap in breast reconstruction. Microsurgery. 2023;43(2):125–130. https://doi.org/10.1002/micr.30972
[12] Bland JM, Altman DG. Statistical methods for assessing agreement between two methods of clinical measurement. Lancet. 1986;1(8476):307–310. https://doi.org/10.1016/S0140-6736(86)90837-8
[13] Bland JM, Altman DG. Measuring agreement in method comparison studies. Stat Methods Med Res. 1999;8(2):135–160. https://doi.org/10.1177/096228029900800204
[14] Lu MJ, Zhong WH, Liu YX, et al. Sample size for assessing agreement between two methods of measurement by Bland-Altman method. Int J Biostat. 2016;12(2):20150039. https://doi.org/10.1515/ijb-2015-0039
[15] Ranganathan P, Pramesh CS, Aggarwal R. Common pitfalls in statistical analysis: Measures of agreement. Perspect Clin Res. 2017;8(4):187–191. https://doi.org/10.4103/picr.PICR_123_17