ORIGINAL RESEARCH ARTICLE
Translation and validation of a Finnish version of the Facial Clinimetric Evaluation (FaCE) Scale
Arttu Mentulaa, Mikko Uimonenb,c, Andrew Lindforda, Sinikka Suominena, Jussi P. Repod and Tuija Ylä-Kotolaa
aDepartment of Plastic Surgery, Helsinki University Hospital, Helsinki University, Helsinki, Finland; bDepartment of Surgery, Central Finland Hospital Nova, Jyväskylä, Finland; cFaculty of Medicine and Health Technology, Tampere University, Tampere, Finland; dUnit of Musculoskeletal Surgery, Department of Orthopedics and Traumatology Tampere, University Hospital, Tampere, Finland
Background: The Facial Clinimetric Evaluation (FaCE) scale is a patient-reported health status instrument developed for assessing the health-related quality of life (HRQoL) in patients with facial nerve paralysis. The aim of this study was to translate and validate the FaCE scale for the Finnish-speaking population.
Methods: The FaCE scale was translated according to international guidelines. Sixty patients in an outpatient clinic prospectively completed the translated FaCE scale and generic HRQoL instrument (15D). The objective facial paralysis grading was made using the Sunnybrook and House-Brackmann scales. Repeated FaCE and 15D instruments were mailed to patients 2 weeks later.
Total scores of the FaCE instrument and subscales were calculated, and floor and ceiling effects were examined. Exploratory factor analysis was made. Internal consistency, reliability, and repeatability were assessed. Convergence with 15D instrument, Sunnybrook, and House-Brackmann scales was examined.
Results: The total internal consistency of the FaCE scale was high (Cronbach’s alpha 0.83). There were no statistically significant differences found between mean scores of the subscales in test-retest analysis (p > 0.05). Intra-class correlations coefficients were high, ranging between 0.78 and 0.92, and the correlations were statistically significant (p < 0.001). There were statistically significant correlations observed between the FaCE scale and the 15D, Sunnybrook, and House-Brackmann scores.
Conclusion: The FaCE scale was successfully translated and validated in Finnish with good validity and reliability. We also demonstrated statistically significant correlations between the generic HRQoL15D instrument and both the Sunnybrook and House-Brackmann physician-based grading scales. The FaCE scale is now ready for use in Finnish facial paralysis patients.
KEYWORDS: Facial paralysis; FaCE scale; Facial Clinimetric Evaluation scale; health-related quality of life; validation; translation
Citation: Journal of Plastic Surgery and Hand Surgery 2023; 58: 33–39. DOI: https://doi.org/10.2340/jphs.v58.6533.
Copyright: © 2023 The Author(s). Published by MJS Publishing on behalf of Acta Chirurgica Scandinavica. This is an Open Access article distributed under the terms of the Creative Commons Attribution-NonCommercial 4.0 International License (https://creativecommons.org/licenses/by-nc/4.0/), allowing third parties to copy and redistribute the material in any medium or format and to remix, transform, and build upon the material for non-commercial purposes, provided proper attribution to the original work.
Received: 29 December 2022; Accepted: 3 April 2023; Published: 14 June 2023
CONTACT Tuija Ylä-Kotola tuija.yla-kotola@hus.fi Department of Plastic Surgery, Helsinki University Hospital, Helsinki University, Helsinki, Finland
Competing interests and funding: The authors report there are no competing interests to declare.
Introduction
Facial paralysis is a severe problem for the patient as it affects facial symmetry and mimetic function, causing failure in closure of the eyelid and difficulty in eating, speaking, and salivating [1]. Peripheral facial paralysis can result from a number of causes, such as idiopathic, infectious, neoplastic, iatrogenic, and accidental trauma [2,3]. Idiopathic facial nerve paralysis, or Bell’s palsy, is the most common. E. Peitersen found that 71% of their Bell’s palsy subjects (N = 1011) recovered full facial function within a year without requiring any intervention [4]. Various treatment options are available for those who do not experience a recovery of facial function.
Static and dynamic surgical interventions include eyelid weights, tarsal procedures, brow lifts, facial slings and nerve grafts, muscle transfers, and microneurovascular muscle transfers [5]. Due to differences in severity, choosing the right treatment option should be done individually for each patient. Besides assessing clinical outcomes of surgical treatment, the evaluation of the effect of surgery can be done using several distinct outcome measures.
There are different instruments to assess the severity and grade of the paralysis. The most commonly used instruments are the House-Brackmann grading scale [6] and the Sunnybrook Facial Grading system [7]. These instruments are utilized by an observer who assigns a grade depending on the severity of impairment of the paralysis. Hence, an observer uses these instruments to assess the anatomical findings. However, they fail to describe the quality of life from the patient’s own perspective in the context of the condition. It is important also to get the patients’ voice heard. One of the areas that can be measured is the quality of life. The quality of life is a term used to measure the overall state of a person, based on health, comfort, and happiness. Health-related quality of life (HRQoL) instruments act as a tool to characterize and compare patients and to measure changes in the condition of the patient over time. This makes it possible for the physician to assess and follow the state of the patient’s quality of life in relation to their illness. Also, the effect of clinical interventions can be assessed as patient-reported outcomes.
There are a number of generic HRQoL measuring instruments. These generic instruments do not focus on any specific disease but instead evaluate the overall HRQoL of the patient. The 15D is a generic HRQoL instrument previously validated and commonly used in Finland.
However, it would be more representative and sensitive in terms of the actual condition, to use disease-specific quality of life questionnaires than using generic HRQoL instruments [8].
The Facial Clinimetric Evaluation (FaCE) scale is a patient-reported health status instrument focused on facial nerve paralysis. It was generated and validated in 2001 at the Baylor College of Medicine in Houston, Texas [9]. This disease-specific quality of life instrument is obligatory when assessing the quality of life of facial paralysis patients in Finland. It is also of vital importance to have such an instrument to be able to assess the effectiveness of different treatments and compare the outcome between different countries. The FaCE scale has been translated and validated in Swedish [10], German [11], French [12], Dutch [13], Chinese [14], Spanish [15], and Brazilian Portuguese [16]. Until now, there have been no instruments available for this purpose in Finnish. To assess the outcomes of surgery in facial paralysis, it is important to have sufficient, validated tools for the assessment.
The aim of this study was to translate and validate the FaCE scale for use in the Finnish-speaking population.
Materials and methods
Translation
The complete translation process was performed according to international guidelines [17,18]. Permission to proceed with the translation and validation of the FaCE scale was obtained from the original author (J.B. Kahn). The original English version of the FaCE scale was translated into Finnish by two independent native Finnish speakers with excellent knowledge of English. The translations were then compared in order to form a consensus version. The consensus version was then translated back into English by a professional native English-speaking translator. A professional medical translator compared the original English version with the back-translation, and no significant differences were detected. The Finnish version of the FaCE scale was tested by two professional physicians familiar with facial paralysis and with five facial paralysis patients. The pilot testing did not reveal any need for changes.
Patients
The translated version of the FaCE scale was then used in 64 facial paralysis patients who were prospectively assessed in an outpatient clinic in the Department of Plastic Surgery at the Helsinki University Hospital. The patients were referred to tertiary health care unit for the assessment of surgical treatment of facial paralysis. The patient records were reviewed for age, gender, etiology, duration of the paralysis, body mass index, smoking, and previous surgical procedures for the facial paralysis.
The objective grading of the paralysis was assessed using both the Sunnybrook grading system and the House-Brackmann Facial Grading System by a plastic surgeon familiar with facial paralysis. The patients completed the FaCE scale and 15D questionnaires in an outpatient clinic at the hospital. Repeat questionnaires were sent to the patients 2 weeks later by mail with a prepaid envelope.
Instruments
The FaCE scale measures both facial disability and impairment and consists of 15 questions. The patient completes the questionnaire grading each answer using a five-item Likert scale, resulting in a calculated score from 0 (worst) to 100 (best). The questions are grouped into six domains (facial movement, facial comfort, oral function, eye comfort, lacrimal control, and social function) [9].
The 15D is a generic HRQoL instrument consisting of 15 dimensions, each rated from 1 to 5 (1 being the best situation, while 5 being the worst situation). The dimensions are mobility, vision, hearing, breathing, sleeping, eating, speech, excretion, usual activities, mental function, discomfort and symptoms, depression, distress, vitality, and sexual activity. As well as providing a multi-dimensional profile of a patient’s health, it provides a single index score (15D score) to be used in a quality-adjusted life-year (QALY) scale. QALY scales range from 0 to 1: 1 being a year lived in perfect health, and experiencing any kind of health-related discomfort results in an index of less than 1 [19].
The House-Brackmann scale is a system used to characterize the impairment of facial paralysis. The patient is asked to perform facial movements in four anatomical areas: brow, eye, nasolabial fold, and oral commissure. The observing physician then rates the degree of movement with grades from 1 (normal movement) to 6 (total paralysis) [6].
The Sunnybrook facial grading system is a clinical instrument completed by an observing physician and has proved to be reliable in assessing peripheral facial palsy [20]. It consists of three sections: resting symmetry, symmetry of voluntary movement, and synkinesis. The weighted scores from each section are combined to form a composite score (Sunnybrook score), which scores from 0 (complete facial paralysis) to 100 (normal facial function).
Statistical methods
Total scores for the FaCE instrument and subscales were calculated, and scores were rescaled to 0–100, with 0 indicating the worst outcome and 100 the best outcome. Missing values were replaced with the mean score of the other items in the scale unless there were more than 50% of missing values. In the event of the latter, those patients were excluded from further analysis.
The distributions of the FaCE scores were assessed. The median score with interquartile range was examined. Scale targeting was assessed by examining floor and ceiling effects in each of the FaCE scales. A cutoff value of 15% was used in assessing the floor or ceiling values with proportions of minimum or maximum scores over the cutoff indicating confirmation of the floor or ceiling effect, respectively. In addition, item-person distribution was examined to assess coverage of the scale.
The internal structure of each item of the FaCE instrument was examined by conducting exploratory factor analysis. The number of factors to be included into factor analysis was determined using parallel analysis. Parallel analysis was conducted by applying the maximum likelihood method with 50 iterations of simulated analysis. Eigenvalues obtained from the observed data were compared to the eigenvalues of 95th percentile of the simulated data to determine the number of factors in further analysis. Exploratory factor analysis with the maximum-likelihood method and the Promax-rotation method was conducted. Eigenvalues of included factors as well as loading values and communality values of the items were analyzed to determine the underlying factor structure for the FaCE instrument. A loading value over 0.4 was interpreted as that item representing the given factor sufficiently. A communality value over 0.5 was interpreted as the given factor sufficiently accounting for variance of the item.
Furthermore, internal consistency of the FaCE and subscales was assessed by calculating Cronbach’s alpha with 95% confidence intervals. Values over 0.70 were interpreted as representing acceptable internal consistency. Values exceeding 0.95 were interpreted as indicating excessive similarity of the items and, thus, redundancy of items from the scale.
Reliability and repeatability of the FaCE subscales were assessed by calculating intra-class correlation coefficients, the standard error of the measurement, and the repeatability coefficient (R) with 95% confidence intervals between the baseline and repeated measures.
In addition, median scores of the repeated measures were compared using Mann–Whitney U-test. An intra-class correlation coefficient value over 0.7 was interpreted as sufficient reliability of the measurement. The standard error of the measurement value was estimated by calculating the square root of the analysis of variance error variance of the repeated measures. The standard error of the measurement values of each scale were compared to the interquartile range of the baseline measurement scores with values close to 0 representing low variation and values close to half of the interquartile range length representing high variance, and, thus, low reliability of the measurement. Generalized linear mixed-effects models fitted by restricted maximum likelihood were used in the estimation of R value. 95% confidence intervals of R were estimated with the Bootstrapping method of 1000 repetitions. R values close to 0 represent high precision of the measurement.
Convergence of the FaCE and subscale scores with 15D dimensions, Sunnybrook instrument, and House-Brackmann instrument scores was examined by calculating the Spearman correlation coefficients between the FaCE and subscale scores and reference scores. The correlation coefficient scores were interpreted as follows: less than 0.3: negligible; 0.3–0.5: low; 0.5–0.7: moderate; and over 0.7: high.
Ethics
A written-informed consent was obtained from each patient, and the study was approved by the Ethics Committee of Helsinki University Hospital, Helsinki, Finland (191/13/03/02/2016).
Results
Sixty patients (94%) returned the questionnaires and were included in the analysis. The median age at the time of evaluation was 55 years, and most of the patients had postoperative facial paralysis. The demographic data are presented in Table 1.
The mean Sunnybrook score was 48.3 (SD 22.3), with a median score of 48 (interquartile range 34–63, range 6–90).
The mean House-Brackmann score was 3.76 (SD 1.19), with a median score of 3.75 (interquartile range 3.00–4.75, range 1.25–6.00).
FaCE scores in total were normally distributed. FaCE scores according to subscale are presented in Table 2. A floor effect was found in the Eye comfort subscale, in which 20% of patients scored the minimum score. Ceiling effects were not found in any of the subscales.
Internal consistency of the FaCE subscales was assessed with Cronbach’s alpha (Table 2). In the Facial comfort, Oral function, and Eye comfort subscales, the internal consistency was acceptable (Cronbach’s alpha > 0.7). In the Social function subscale, Cronbach’s alpha was 0.69, which was also extremely close to the accepted value (0.7). In the Facial movement subscale, Cronbach’s alpha was 0.65. The total internal consistency of the FaCE scale was high (Cronbach’s alpha was 0.83).
Exploratory factor analysis was used to examine the internal structure of each of the FaCE scale items (Table 3). Parallel analysis suggested testing of five factors. The loading values to the factors were over 0.4 in all the items except no. 8. The loading values of item 8 were low on all the potential factors.
Items 4, 6, and 13 loaded onto factor 1, items 1, 2, and 3 loaded onto factor 2, items 5 and 7 loaded onto factor 3, items 9, 10, and 14 loaded onto factor 4, and items 11, 12, and 15 loaded onto factor 5. Eigenvalues of all analyzed factors were over one (range 1.2–4.6). According to exploratory factor analysis, the examined factor structure explained 73% of the total variance of all the items included in the model. Fourteen items loaded onto identical factors as in the original analysis by Kahn et al. [9]. Item 8 did not load onto any of the examined factors, which was seen also in as low communality value (0.3).
The reliability and repeatability of the FaCE subscales in repeated measures are shown in Figure 1. There were no statistically significant differences found between mean scores of the subscales between two repeated measures (p > 0.05). Intra-class correlations coefficients were high, ranging between 0.78 and 0.92, and the correlations were statistically significant (p < 0.001). Standard Error of the Measurement (SEM) and repeatability coefficient values were low, indicating high reliability.
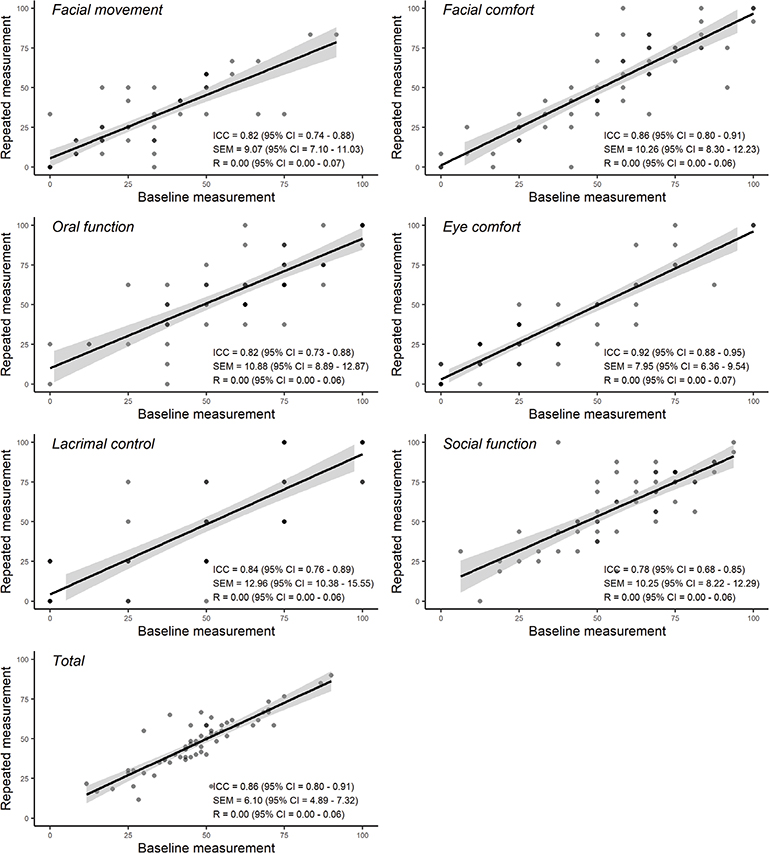
Figure 1. Reliability and repeatability of Facial Clinimetric Evaluation (FaCE) subscales.
There were statistically significant correlations observed between the FaCE scale and 15D, Sunnybrook, and House-Brackmann grading scale scores (Table 4).
The 15D speech values were moderately correlated to the FaCE Oral function subscale (r = –0.51) and FaCE total scores (r = –0.53). The 15D depression values were moderately correlated to FaCE social function subscale scores (r = –0.49).
The Sunnybrook total values correlated strongly (r = 0.80) to the FaCE facial movement subscale and moderately (r = 0.51) to total FaCE scale scores. Sunnybrook movement values correlated strongly to FaCE Facial movement subscale (r = 0.78) and to FaCE total scores (r = 0.51). Also, the Sunnybrook rest value correlated moderately to the FaCE Facial movement subscale score (r = 0.66).
The House-Brackmann total values correlated strongly (r = –0.81) to the FaCE Facial movement subscale and moderately (r = –0.51) to total FaCE scale scores. House-Brackmann forehead values correlated moderately (r = –0.55) to the FaCE Facial movement subscale score. House-Brackmann midface (r = –0.80) and mouth (–0.76) values correlated strongly to the FaCE Facial movement subscale score.
All the correlations mentioned above were also statistically significant (p < 0.05).
Discussion
The FaCE scale was successfully translated and validated in Finnish with good validity and reliability. Compliance within patients was high with 60 out of 64 patients completing the study. We did not notice any difficulties in the translation process of the cultural adaptation of the questionnaire. The patients experienced the Finnish FaCE scale questionnaire to be uncomplicated to complete, and the questions were easily understood. The total internal consistency of the FaCE scale was high. There were no statistically significant differences found between mean scores of the subscales in test-retest analysis, and intra-class correlations coefficients were high.
It is extremely important to have an instrument to measure patient’s quality of life in facial paralysis as the paralysis often causes problems with eating, drinking, speech, vision, and facial esthetics affecting social life and psychological wellbeing. There are only a few instruments available that evaluate the impairment of quality of life with facial paralysis.
In a systematic review by Ho et al., only two questionnaires satisfied the criteria of the impact of facial paralysis on quality of life [21]: the FaCE scale [9] and the Facial Disability Index [22]. There was a third instrument that passed the inclusion and exclusion criteria. This instrument was constructed to study the effect of botulinum toxin on patients with aberrant facial nerve regeneration; however, this instrument lacks published results and validation [23].
The FaCE scale was selected to be translated and validated into Finnish because it fulfilled all of the psychometric standards [21], and it has already been translated into many other languages [10–16]. We chose to subsequently compare and discuss our results with those of our Swedish colleagues [10] because the cultural aspects across the Scandinavian countries are comparable and those countries are geographically close.
In the present study, the total internal consistency of the FaCE scale was shown to be high with a Cronbach’s alpha of 0.83. The Facial movement subscale showed lowest internal consistency with a Cronbach’s alfa of 0.65. In the Swedish study, the internal consistency of this specific subscale was higher (0.82) [10]. This difference might be explained by the finding that self-assessed morbidity may differ according to etiology of facial paralysis [24]. In our study, there were only a few patients with Bell’s palsy compared to 79% in Swedish study, and our patients suffered more severe symptoms of paralysis. All the other FaCE subscales showed good internal validity. In the Swedish validation data, Facial comfort and Social function subscales were the most consistent [10].
Scores within the total FaCE scale were normally distributed without floor or ceiling effects. Reliability in repeated measures was high with intra-class correlation coefficients scores ranging between 0.78 and 0.92. Repeatability was also high with no statistically significant differences between test and retest mean scores of the subscales. Good reliability and repeatability were also reported by Kahn et al. [9] and in the Swedish study [10].
Exploratory factor analysis was used to examine all the subscale items with five factors. Fourteen items loaded onto identical factors as in the original analysis by Kahn et al. [9]. Item 8 did not load onto any of the tested factors. In the original factor analysis, the loading pattern was similar as the same item loaded only onto factor 6, indicating similar structural properties of the FaCE scale after translation and cultural adaptation.
The median age of our patients was 55 years. The mean Sunnybrook score was 48 (median 48), and the mean House-Brackmann score was 3.8 (median 3.8). Surgical treatment of tumors was the main cause of facial paralysis in our study with only five patients having Bell’s palsy (8.3%). In a similar Swedish study, the median age was 59 with a mean Sunnybrook score of 62.7 (median 65.0) and a mean House-Brackmann score of 3.10 (median 3.00). The majority (79%) of the patients had Bell’s palsy [10]. In the original study performed by Kahn et al., 37 patients out of 86 (43%) had Bell’s palsy [9]. The difference between the etiology of facial paralysis is explained by the fact that our patients were referred to plastic surgery for assessment for surgical treatment. Even though our patients’ objective Sunnybrook and House-Brackmann gradings were worse indicating a more severe facial palsy, the reliability and validity were also sufficiently high in this patient group.
In our analysis, Finnish FaCE subscales had statistically significant correlations between specific HRQoL dimensions (15D instrument) and both the Sunnybrook and House-Brackmann physician-based grading scales.
Facial movement correlated strongly to both Sunnybrook and House-Brackmann total scores. Similar high correlation was also found in the Swedish study, with both the Sunnybrook and House-Brackmann scales [10]. This merely confirms the fact that objective physician-based grading scales are focused on facial movement. However, the latter are not able to grade many other aspects of facial palsy such as impairment in social life. In our study, the Social function subscale correlated poorly to both Sunnybrook (r = 0.22) and House-Brackmann (r = –0.26) total scores.
The Oral function subscale correlated moderately to 15D Speech values in our data. This can be explained by the fact that patients self-evaluating their oral function to be compromised may also consider their speaking to be unclear or difficult to understand.
The Social function subscale correlated moderately to 15D Depression values. Also in the Swedish study, the Social function subscale of the FaCE scale correlated moderately to the Social function, Emotional health, and Mental health domains of the SF-36 (Short Form Health Survey with 36 items) general health status instrument used in their study [10]. In the original study by Kahn et al., moderate correlation was found only with social function but not with emotional or mental health [9].
Physician-graded instruments such as the Sunnybrook and House-Brackmann scales only consider the impairment of facial paralysis, leaving out the disability factor as experienced by the patient.
Impaired facial function negatively affects the patient’s quality of life [25,26] and is known to cause psychological distress [27,28].
However, the degree of the paralysis does not necessarily relate to the level of distress felt by the patient [29]. Patients who have difficulties expressing their facial emotions rank their social functioning lower than physical functioning [30]. Also, in a study by Dey J et al., random observers’ and experts’ quality of life ratings of patients with permanent unilateral facial paralysis differed negatively from the patients’ own perceived quality of life [31].
As such, it is important to use both physician-graded instruments to grade objectively the facial tone, symmetry, and function as well as patient-graded quality of life instruments to assess the severity of facial paralysis. Both instruments should be used when evaluating the outcome of surgical treatment and its benefit for the patient.
The rather small study population is the main limitation of our study. Finland is a country with 5.5 million inhabitants, and therefore, it is very difficult to accrue a larger study population with the diagnosis of stable facial paralysis in a reasonable timespan. Although we have acknowledged this limitation, we are delighted by the fact that the response rate was extremely high (94%). Another limitation of this study was the cross-sectional design without follow-up data; due to which we could not assess the responsiveness of the FaCE scale to a change in clinical status. Finally, the small sample size did not allow the use of the item response theory-based methodology in the FaCE scale measurement properties assessment.
Conclusions
The FaCE scale was successfully translated into Finnish, and psychometric properties of the translated version were found to be promising among Finnish facial paralysis patients. We also demonstrated strong correlations between the generic HRQoL 15D instrument and both the Sunnybrook and House-Brackmann physician-based grading scales. With the translated FaCE scale in Finnish, we aim to evaluate the quality of life of Finnish facial paralysis patients in future studies.
References
[1] Hotton M, Huggons E, Hamlet C, et al. The psychosocial impact of facial palsy: a systematic review. Br J Health Psychol. 2020;25(3):695–727. https://doi.org/10.1111/bjhp.12440
[2] Owusu JA, Stewart CM, Boahene K. Facial nerve paralysis. Med Clin North Am. 2018;102(6):1135–1143. https://doi.org/10.1016/j.mcna.2018.06.011
[3] Kochhar A, Larian B, Azizzadeh B. Facial nerve and parotid gland anatomy. Otolaryngol Clin North Am. 2016;49(2):273–284. https://doi.org/10.1016/j.otc.2015.10.002
[4] Peitersen E. Natural history of bell’s palsy. Acta Otolaryngol. 1992;112(Suppl 492):122–124. https://doi.org/10.3109/00016489209136829
[5] Hohman MH, Hadlock TA. Etiology, diagnosis, and management of facial palsy: 2000 patients at a facial nerve center. Laryngoscope. 2014;124(7):E283–E293. https://doi.org/10.1002/lary.24542
[6] House JW, Brackmann DE. Facial nerve grading system. Otolaryngol Head Neck Surg. 1985;93(2):146–147. https://doi.org/10.1177/019459988509300202
[7] Hu WL, Ross B, Nedzelski J. Reliability of the Sunnybrook facial grading system by novice users. J Otolaryngol. 2001;30(4):208–211. https://doi.org/10.2310/7070.2001.20148
[8] Meyers AR, Gage H, Hendricks A. Health-related quality of life in neurology. Arch Neurol. 2000;57(8):1224–1227. https://doi.org/10.1001/archneur.57.8.1224
[9] Kahn JB, Gliklich RE, Boyev KP, et al. Validation of a patient-graded instrument for facial nerve paralysis: the FaCE scale. Laryngoscope. 2001;111(3):387–398. https://doi.org/10.1097/00005537-200103000-00005
[10] Marsk E, Hammarstedt-Nordenvall L, Engström M, et al. Validation of a Swedish version of the Facial Disability Index (FDI) and the Facial Clinimetric Evaluation (FaCE) scale. Acta Otolaryngol. 2013;133(6):662–669. https://doi.org/10.3109/00016489.2013.766924
[11] Volk GF, Steigerwald F, Vitek P, et al. [Facial Disability Index and Facial Clinimetric Evaluation Scale: validation of the German versions]. Laryngorhinootologie. 2014;94(3):163–168. https://doi.org/10.1055/s-0034-1381999
[12] Barry P, Mancini J, Alshukry A, et al. Validation of French versions of the Facial Disability Index and the Facial Clinimetric Evaluation Scale, specific quality of life scales for peripheral facial palsy patients. Clin Otolaryngol. 2019;44(3):313–322. https://doi.org/10.1111/coa.13294
[13] Kleiss IJ, Beurskens CHG, Stalmeier PFM, et al. Quality of life assessment in facial palsy: validation of the Dutch Facial Clinimetric Evaluation Scale. Eur Arch Otorhinolaryngol. 2015;272(8): 2055–2061. https://doi.org/10.1007/s00405-015-3508-x
[14] Li Y, Jiang H, Wang K, et al. [Quality of life survey on patients with peripheral facial paralysis by using Chinese version of the FaCE scale]. Zhonghua Er Bi Yan Hou Tou Jing Wai Ke Za Zhi. 2013;48(1):11–16. https://doi.org/10.1186/1477-7525-11-113
[15] Garcia-Iza L, Chiesa-Estomba CM, Rosell-Romero N, et al. Translation and validation of the Facial Clinimetric Evaluation Scale to Spanish. Otolaryngol Head Neck Surg. 2020;164(6):1179–1185. https://doi.org/10.1177/0194599820969622
[16] Tavares-Brito J, Fonseca ACDO, Torres RP, et al. Facial Clinimetric Evaluation Scale and Synkinesis Assessment Questionnaire translation into Brazilian Portuguese: a validation study. Int Arch Otorhinolaryngol. 2020;24(1):e24–e30. https://doi.org/10.1055/s-0039-1697992
[17] Beaton DE, Bombardier C, Guillemin F, et al. Guidelines for the process of cross-cultural adaptation of self-report measures. Spine. 2000;25(24):3186–3191. https://doi.org/10.1097/00007632-200012150-00014
[18] Wild D, Grove A, Martin M, et al. Principles of good practice for the translation and cultural adaptation process for patient-reported outcomes (PRO) measures: report of the ISPOR Task Force for translation and cultural adaptation. Value Health. 2005;8(2):94–104. https://doi.org/10.1111/j.1524-4733.2005.04054.x
[19] Sintonen H. The 15D instrument of health-related quality of life: properties and applications. Ann Med. 2001;33(5):328–336. https://doi.org/10.3109/07853890109002086
[20] Neely JG, Cherian NG, Dickerson CB, et al. Sunnybrook facial grading system: reliability and criteria for grading. Laryngoscope. 2010;120(5):1038–1045. https://doi.org/10.1002/lary.20868
[21] Ho AL, Scott AM, Klassen AF, et al. Measuring quality of life and patient satisfaction in facial paralysis patients: a systematic review of patient-reported outcome measures. Plast Reconstr Surg. 2012;130(1):91–99. https://doi.org/10.1097/PRS.0b013e318254b08d
[22] VanSwearingen JM, Brach JS. The Facial Disability Index: reliability and validity of a disability assessment instrument for disorders of the facial neuromuscular system. Phys Ther. 1996;76(12):1288–1298. https://doi.org/10.1093/ptj/76.12.1288
[23] Borodic G, Bartley M, Slattery W, et al. Botulinum toxin for aberrant facial nerve regeneration: double-blind, placebo-controlled trial using subjective endpoints. Plast Reconstr Surg. 2005;116(1):36–43. https://doi.org/10.1097/01.PRS.0000169689.27829.C4
[24] Saito DM, Cheung SW. A comparison of facial nerve disability between patients with Bell’s palsy and vestibular schwannoma. J Clin Neurosci. 2010;17(9):1122–1125. https://doi.org/10.1016/j.jocn.2010.01.019
[25] Blom SSAH, Aarts H, Wever CC, et al. Quality of life, social function, emotion, and facial paresis in Dutch vestibular schwannoma patients. Laryngoscope Investig Otolaryngol. 2020;5(3):477–484. https://doi.org/10.1002/lio2.371
[26] Goines JB, Ishii LE, Dey JK, et al. Association of facial paralysis–related disability with patient- and observer-perceived quality of life. JAMA Facial Plast Surg. 2016;18(5):363–369. https://doi.org/10.1001/jamafacial.2016.0483
[27] Van Swearingen JM, Cohn JF, Turnbull J, et al. Psychological distress: linking impairment with disability in facial Neuromotor disorders. Otolaryngol Head Neck Surg. 1998;118(6):790–796. https://doi.org/10.1016/S0194-5998(98)70270-0
[28] Fu L, Bundy C, Sadiq SA. Psychological distress in people with disfigurement from facial palsy. Eye (Lond). 2011;25(10):1322–1326. https://doi.org/10.1038/eye.2011.158
[29] Cross T, Sheard CE, Garrud P, et al. Impact of facial paralysis on patients with acoustic neuroma. Laryngoscope. 2000;110(9):1539–1542. https://doi.org/10.1097/00005537-200009000-00024
[30] Coulson SE, O’Dwyer NJ, Adams RD, et al. Expression of emotion and quality of life after facial nerve paralysis. Otol Neurotol. 2004;25(6):1014–1019. https://doi.org/10.1097/00129492-200411000-00026
[31] Dey JK, Ishii LE, Nellis JC, et al. Comparing patient, casual observer, and expert perception of permanent unilateral facial paralysis. JAMA Facial Plast Surg. 2017;19(6):476–483. https://doi.org/10.1001/jamafacial.2016.1630