ORIGINAL RESEARCH ARTICLE
Computed tomography for visible haematuria – a single nephrographic phase is sufficient for detecting renal cell carcinoma
Kristina Flor Galtunga,b , Peter Mæhre Lauritzena,c, Gunnar Sandbæka,b, Dag Baya, Erica Ponzid,e, Eduard Bacob,f, Nigel Christopher Cowang, Anca Mihaela Naash and Erik Ruda
aDepartment of Radiology, Oslo University Hospital, Oslo, Norway; bInstitute of Clinical Medicine, Faculty of Medicine, University of Oslo, Norway; cDepartment of Life Sciences and Health, Faculty of Health Science, Oslo Metropolitan University, Oslo, Norway; dDepartment of Research Support for Clinical Trials, Clinical Trial Unit, Oslo University Hospital, Oslo, Norway; eOslo Center for Biostatistics and Epidemiology (OCBE), Department of Biostatistics, University of Oslo, Oslo, Norway; fDepartment of Urology, Oslo University Hospital, Oslo, Norway; gDepartment of Radiology, Portsmouth Hospitals University NHS Trust, UK; hDepartment of Pathology, Oslo University Hospital, Oslo, Norway
ABSTRACT
Objectives: No previous studies have compared two computed tomography (CT) protocols in patients presenting with visible haematuria, and most patients undergo a multiphase CT in order to detect upper tract malignancies. We aimed to prospectively compare the diagnostic performance of single- and four-phase CT for detecting renal cell carcinoma (RCC) in patients with visible haematuria.
Materials & methods: ‘A Prospective Trial for Examining Hematuria using Computed Tomography’ (PROTEHCT) was a single-centre prospective paired diagnostic study in patients referred for CT due to painless visible haematuria between September 2019 and June 2021. All patients underwent four-phase CT (control) from which a single nephrographic phase dual energy CT (experimental) was extracted. Both were independently assessed for RCC by randomised radiologists. Histologically verified RCC defined a positive reference standard. Follow-up ascertainment of RCC diagnosis was completed in May 2022. Descriptive statistics were used to calculate the accuracies. Inter-reader agreement was assessed by kappa statistics.
Results: A total of 308 patients (median age, 68 years [interquartile range 53–77, range 18–96], 250 males) were included for analysis. RCC was diagnosed in seven (2.3%) patients during a median follow-up time of 19 months (interquartile range: 15–25). For the control and experimental CT, sensitivity was 100% versus 100%, specificity was 97% versus 98% and accuracy 97% versus 97%. The positive predictive value was 44% versus 50%, and the negative predictive value was 100% versus 100%. The agreement between the control and experimental CT was 98% (k = 0.79).
Conclusion: A single nephrographic phase dual energy CT is sufficient for detecting RCC in patients with visible haematuria.
KEYWORDS: Haematuria; multidetector computed tomography; prospective study; renal cell carcinoma
Citation: Scandinavian Journal of Urology 2024, VOL. 59, 10–18. https://doi.org/10.2340/sju.v59.18467.
Copyright: © 2024 The Author(s). Published by MJS Publishing on behalf of Acta Chirurgica Scandinavica. This is an Open Access article distributed under the terms of the Creative Commons Attribution 4.0 International License (http://creativecommons.org/licenses/by/4.0/), allowing third parties to copy and redistribute the material in any medium or format and to remix, transform, and build upon the material, with the condition of proper attribution to the original work.
Received: 23 August 2023; Accepted: 30 November 2023; Published: 16 January 2023
CONTACT Kristina Flor Galtung kriflo@ous-hf.no Oslo University Hospital (Aker), Postboks 4950 Nydalen, NO-0424 Oslo, Norway
Competing interests and funding: The authors report no conflict of interest.
Introduction
Visible haematuria may be the only sign of urinary tract malignancy, and the clinical workup of this common symptom consumes considerable urological and radiological resources [1, 2]. Urothelial carcinoma (UC) of the bladder is the most common malignant tumour, and it is usually detected by cystoscopy [2, 3]. Renal cell carcinoma (RCC) and upper tract UC (UTUC) are significantly less common and occur in 1–2% and 0.4–1.2%, respectively [2, 3].
A computed tomography (CT) is widely accepted as the initial examination of the upper urinary tract. However, the European Association of Urology (EAU) provides two different CT recommendations for RCC and UTUC, and there are no specific guidelines for assessing patients with visible haematuria [4, 5]. Consequently, many different multiphase CT protocols combining unenhanced, corticomedullary, nephrographic and/or excretory phase acquisitions are used in clinical practice.
Due to the low prevalence of malignancy in the upper urinary tract and the high costs and potential harm from radiation, it is important to establish whether a single-phase CT is sufficient [2, 6, 7]. We recently conducted ‘A Prospective Trial for Examining Hematuria using Computed Tomography’ (PROTEHCT), which is the first prospective comparison of two different CT protocols in patients presenting with painless visible haematuria [8]. We showed that a single nephrographic phase CT was sufficient for detecting UC (bladder UC and UTUC) [8].
For detecting RCC, all previous CT studies are either retrospective and/or performed in patients with an already confirmed renal mass [9–13]. Some conclude that the nephrographic phase is the best, whilst others report that the corticomedullary phase is the best, and yet others say that both phases are needed [9–13]. Furthermore, some conclude that the excretory phase is also needed [11, 13]. The inconsistency in results mirrors the great variation in patient selection and methodology. More importantly, all the studies have limited validity for patients presenting with visible haematuria.
The aim of this study was to prospectively compare the diagnostic performance of a single nephrographic phase and a four-phase CT for detecting RCC in patients presenting with painless visible haematuria.
Materials and methods
This study reports on a secondary outcome of the PROTEHCT study. The inclusion criteria were age >18 years old and at least one occasion of painless visible haematuria. The exclusion criteria were a cystoscopy within 6 months prior to CT, previous or known UC, symptomatic urinary tract infection relieved by antibiotics, symptomatic stone disease, recent catheterisation or instrumentation, estimated glomerular filtration rate (eGFR) < 30 mL/min/1.73 m2, allergy to iodinated contrast media, unable to provide consent for any reason or not wished to participate for any reason.
As for the primary outcome of PROTEHCT, the incidences of bladder UC and UTUC were 13% (95% confidence interval [CI]: 10 to 17) and 1.6% (95% CI: 1 to 4), respectively [8]. The difference in accuracy of four-phase and single NP CT was 1.9% (95% CI: -2.8 to 6.7). Since the upper limit of the 95% CI was below the pre-defined non-inferiority limit of 7.5%, the study concluded that a single nephrographic phase CT was sufficient for detecting UC.
Study design and ethical approval
A single-centre, prospective, paired comparison of two CT protocols for detecting RCC. All patients signed a letter of consent, and the study was approved by the regional ethics committee (2019/395) and registered at ClinicalTrials.gov (NCT04077359). Funding was received from the Oslo University Hospital, and no external funding was received.
Outcomes
A paired comparison of the diagnostic accuracies of single nephrographic phase and four-phase CT for detecting RCC.
CT protocol
All patients underwent a four-phase abdominopelvic CT (unenhanced, corticomedullary phase, dual energy nephrographic phase and excretory phase) using a 128-multidetector Edge CT scanner (Siemens Healthineers, Forchheim, Germany). Patients were asked to drink 1 L of water before the CT examination and requested not to void urine 1 h before the CT. Iohexol 350 mg/mL (Omnipaque, GE Healthcare) was administered according to the body weight (2 mL/kg), and the injection speed was 4 mL/s. The unenhanced scan was followed by three separate contrast enhanced acquisitions performed with bolus tracking with a 200 Hounsfield Unit threshold in the abdominal aorta. The corticomedullary phase was performed at 25 s, the nephrographic phase at 70 s, and the excretory phase at 30 min post threshold. A virtual non-contrast series was reconstructed from the dual energy nephrographic phase (Siemens Syngo Via). All scans were performed in the supine position, and all patients were asked to void urine immediately after the nephrographic phase.
Interventions
The CT examination was separated into a control CT (all four phases) and an experimental CT (dual energy nephrographic phase only).
CT reporting
Three radiologists with 5–13 years uroradiology experience functioned as primary readers, and two radiologists with >20 years general radiology experience as secondary readers.
By flipping a coin for each patient, one primary and one secondary reader were randomly assigned to score the control CT, and another primary and secondary reader to score the experimental CT. In this way, four readers independently scored each patient, and no reader scored both control CT and experimental CT in the same patient. Each reader prospectively scored suspicion of RCC using a five-point Likert scale for solid masses, and Bosniak classification for cystic masses [14]. Likert ≥ 3 and/or Bosniak ≥ 3 defined a positive CT. The unenhanced and the virtual non-contrast served as a baseline for visual assessment of contrast enhancement for the control and experimental CT, respectively. Any renal mass with contrast enhancement deviating from normal renal parenchyma was considered a possible RCC. The control CT was scored in the following order: corticomedullary phase, nephrographic phase and excretory phase, and the highest score defined the overall score. In case of multiple masses, only the largest was registered. Each reader was blinded to the reports of the other readers. The primary reader of the control CT issued the clinical radiology report, which was available to the urologist.
Biopsy, surgery and active surveillance
In case of a positive clinical radiology report, a multidisciplinary team decided upon biopsy, surgery, or active surveillance.
Reference standards
RCC verified by histology, defined a positive reference standard. The reference standard was negative if no RCC was confirmed histologically at the initial workup and during follow-up.
Follow-up
Follow-up ascertainment of RCC diagnosis was completed in May 2022. Patients in active surveillance underwent at least one CT during the follow-up time.
Statistics
Descriptive statistics were used to calculate accuracy, sensitivity, specificity and predictive values with 95% CIs according to Wilson [15]. The differences in accuracy, sensitivity, specificity and predictive values between control and experimental CT were calculated according to Newcombe [16]. The Mann–Whitney U test assessed the difference in age between patients with and without RCC. The area under the curve (AUC) was calculated using the reference standard as the state variable and the Likert scores in the kidney as test variables. Any differences in AUC were analysed according to DeLong [17]. Inter-reader agreement was calculated in percent and Cohen’s Kappa Statistics [18]. A P <0.05 was considered significant. We used IBM SPSS Statistics for Windows, Version 28.0 (Armonk, NY, USA), MedCalc for Windows, version 20.009 (MedCalc Software, Ostend, Belgium) and R version 3.6.1 for statistical analyses.
Results
Between September 2019 and June 2021, 308 patients with painless visible haematuria were included for analyses. Baseline characteristics are summarised in Table 1.
At the initial workup, seven (2.3%, 95% CI: 1 to 5) had RCC. Three RCCs were diagnosed in 250 males (1.2%, 95% CI: 0.4 to 3.5) and four RCCs in 58 females (6.9%, 95% CI: 2.7 to 16). There was no difference in age between patients with or without RCCs (P = 0.9). During a median follow-up time of 19 months (interquartile range [IQR]: 15–25, range 10–31), no additional RCCs were detected.
Six patients underwent radical nephrectomy and one partial nephrectomy (Figures 1 and 2). The median size of the resected tumours was 65 mm (IQR 39–86, range 37–90) (Table 2).
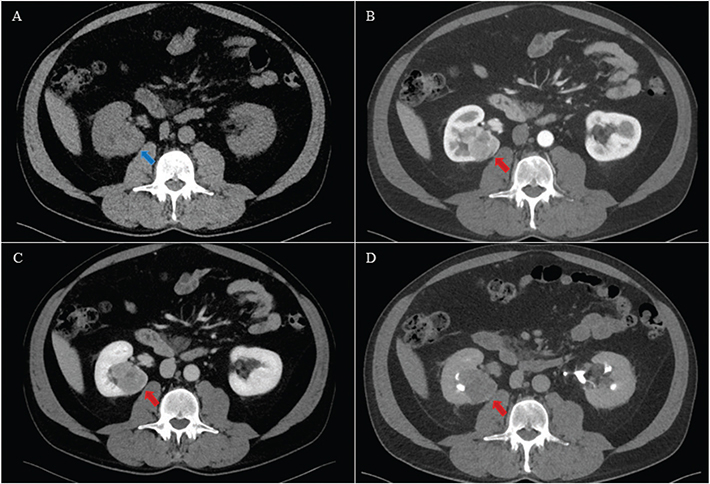
Figure 1. A 63-year-old male with a solid tumour in the right kidney. Histology after radical nephrectomy showed a pT3a clear cell carcinoma. The tumour was isodense with normal renal parenchyma (blue arrow) on axial unenhanced (A), and hypoenhancing (red arrow) on axial corticomedullary phase (B), nephrographic phase (C) and excretory phase (D). Both the control and experimental CTs were scored positive (Likert 5) by both primary and secondary readers.
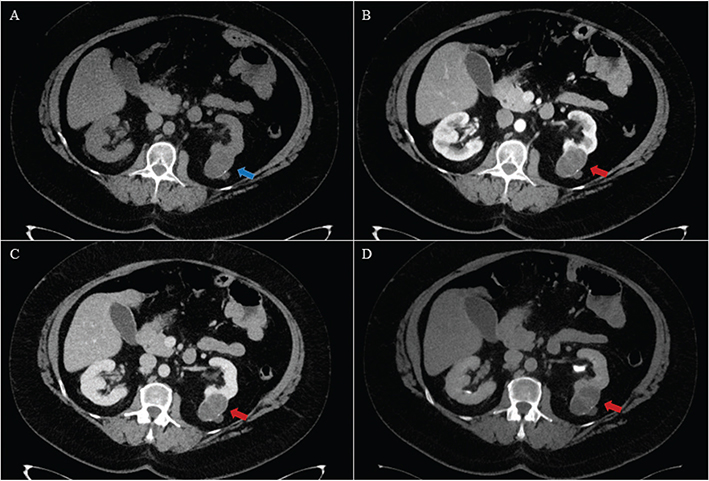
Figure 2. A 54-year-old female with a cystic tumour in the left kidney. Histology after partial nephrectomy showed a multilocular cystic clear cell carcinoma of low malignant potential. The tumour was isodense with normal renal parenchyma (blue arrow) with rim calcifications on axial unenhanced (A), and hypo enhancing (red arrow) on axial corticomedullary phase (B), nephrographic phase (C) and excretory phase (D). Visually, there was little difference in contrast enhancement between the contrast enhanced acquisitions. The primary readers scored the control CT as Bosniak IV (positive) and experimental CT as Bosniak III (positive). The secondary readers scored the control CT as Bosniak IV (positive) and the experimental CT as Bosniak II (negative).
Active surveillance was decided for nine patients (2.9%, 95% CI: 1.5 to 5.5) with a positive clinical radiology report, of which all were classified as false positive. These nine renal masses had a median size of 12 mm (IQR 9–23) at the initial workup. During a median follow-up time of 18 months (IQR: 15–26, range 12–29), the size was unchanged in seven (Figures 3 and 4). One proved to be a simple cyst on ultrasound, and the last was no longer visible on follow-up CT. It was believed to be caused by focal pyelonephritis (Figure 5). The results of the control and experimental CT against the reference standard are shown in Table 3.
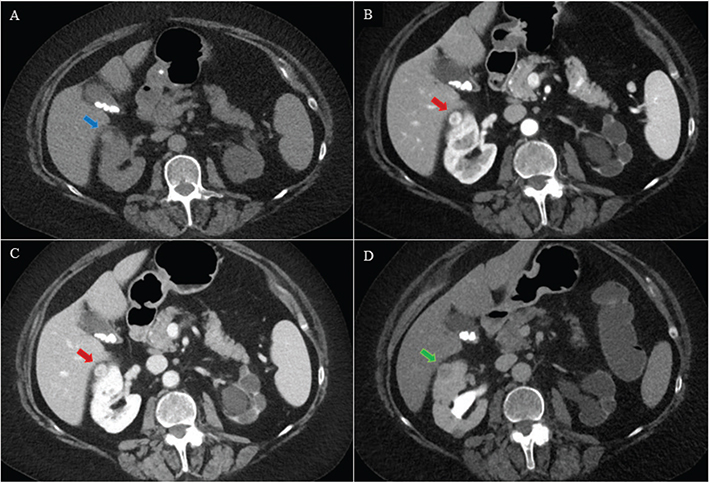
Figure 3. A 74-year-old female with a solid tumour in the right kidney. For both primary and secondary readers, the control and experimental CTs were positive (Likert 4 or 5). Active surveillance was decided, and the tumour size was unchanged during 12 months of follow-up. Hence, all CTs were registered as false positive. The tumour was isodense with normal renal parenchyma (blue arrow) on axial unenhanced (A), and slightly hyper enhancing (red arrow) on axial corticomedullary phase (B), nephrographic phase (C) and hypo enhancing (green arrow) on excretory phase (D).
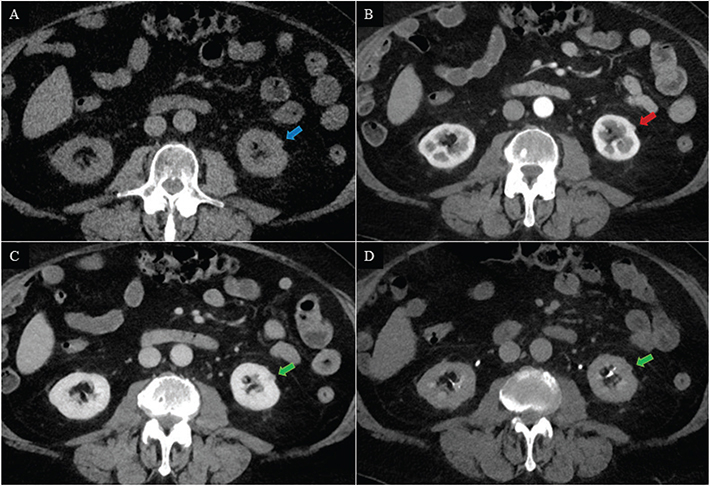
Figure 4. A 77-year-old male with a small exophytic renal mass in the left kidney. The renal mass was isodense to normal renal parenchyma (blue arrow) on axial unenhanced (A), possibly isodense to normal renal parenchyma (red arrow) on corticomedullary phase (B) and hypo enhancing (green arrow) on nephrographic phase (C) and excretory phase (D). The primary readers scored the control CT as Likert 4 (positive), and the experimental CT as Likert 1 (negative). The secondary readers scored the control CT as Likert 2 (negative) and the experimental CT as Likert 4 (positive). Active surveillance was decided, and the size was unchanged during the 18 months follow-up. Hence, the positive CTs were registered as false positive, and the negative CTs were registered as true negative.
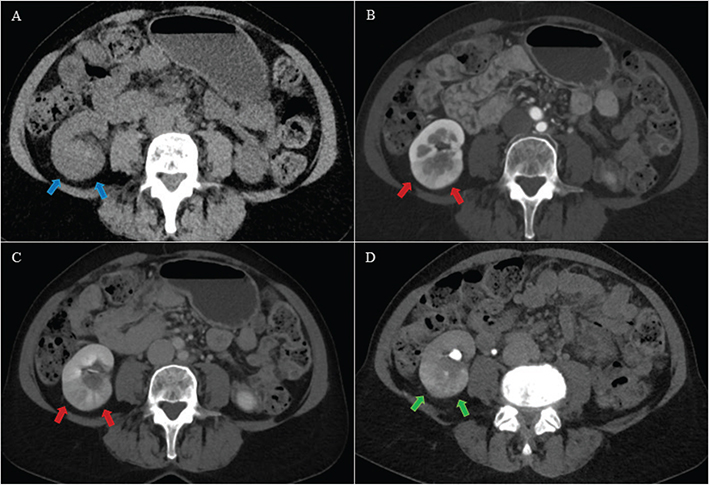
Figure 5. A 55-year-old female with an area with contrast enhancement deviating from normal renal parenchyma in the right kidney. For the primary readers, both control and experimental CTs were positive (Likert 3 and 3). For the secondary readers, both control and experimental CTs were negative (Likert 2 and 1). The deviant area in the right kidney was isodense with normal renal parenchyma (blue arrows) on axial unenhanced (A), hypo enhancing (red arrows) on axial corticomedullary phase (B) and nephrographic phase (C) and hyper enhancing (green arrows) on axial excretory phase (D). Possible differential diagnoses were upper tract urothelial carcinoma, infiltrative renal cell carcinoma and focal pyelonephritis. An ureterorenoscopy and a 3-month follow-up CT were both negative, and the diagnosis was focal pyelonephritis. Both control and experimental CT of the primary readers were registered as false positive, whereas both control and experimental CT of the secondary readers were registered as true negative.
Primary readers
For both the control and experimental CT, the cancer detection rate was 2.3% (95% CI: 1 to 5, 7 out of 308), and the sensitivity was 100% (Table 4). The control and experimental CT specificity was 97% versus 98%, positive predictive value was 44% versus 50%, negative predictive value was 100% versus 100% and accuracy was 97% versus 98%, respectively (Table 4). The inter-reader agreement between control and experimental CT was 98% (k = 0.79) (Table 5).
Secondary readers
The cancer detection rate for the control and experimental CT was 2.3% (95% CI: 1 to 5, 7 out of 308) and 2.0% (95% CI: 0.9 to 4.2, 6 out of 308), respectively. The sensitivity was 100 % and 86%, respectively (Table 4). The experimental CT misclassified one cystic RCC of low malignancy potential as Bosniak 2 (Figure 2). The control and experimental CT specificity was 99% versus 99%, positive predictive value was 64% versus 60%, negative predictive value was 100% versus 100% and accuracy was 99% versus 98%, respectively (Table 4). The inter-reader agreement between control and experimental CT was 98% (k = 0.75) (Table 5).
Discussion
To the best of our knowledge, our study is the first prospective comparison of two CT protocols for detecting RCCs in patients presenting with painless visible haematuria. The diagnostic accuracies were excellent for both CT protocols, showing that a single nephrographic phase dual energy CT suffices, making the four-phase CT redundant.
In our cohort, the rate of RCC was 2.3%, which is in accordance with a recent review reporting RCC in 2% of patients with visible haematuria [3]. This shows that our study population is representative for clinical practice.
The choice of the single nephrographic phase as the experimental CT protocol was the result of our previous retrospective study in patients with haematuria and a negative cystoscopy. In that, we showed that the nephrographic phase was the only phase detecting all UTUCs and RCCs compared to corticomedullary and excretory phase [19].
Two prospective studies have previously compared different CT protocols for detecting RCC, and both concluded that the nephrographic phase was better than the corticomedullary phase [9, 10]. However, only patients with a confirmed solid renal mass were included, and the results are therefore not necessarily valid in a visible haematuria setting. Several retrospective studies have reported conflicting results favouring corticomedullary, nephrographic or excretory phase [11–13].
The agreement between the experimental and control CT was substantial for both primary and secondary readers, indicating that a single nephrographic phase CT is robust. For the primary readers, the sensitivity of the control and experimental CT was 100% versus 100% and the specificities were 97% versus 98%. The secondary readers achieved slightly higher specificities at the expense of lower sensitivity for one reader. In one patient, the experimental CT misclassified a cystic RCC as a Bosniak 2 cyst, and consequently, the sensitivity dropped. In our opinion, this misclassification was an interpretation error rather than a limitation of the CT protocol itself (Figure 2). Sensitivity analysis is challenging in any study with a low prevalence of the target condition due to few cases and wide CIs, as seen in our study. In comparison, a recent systematic review reported a median sensitivity and specificity of 88% (IQR 81–94%) and 75% (IQR 51–90%), respectively [20]. However, all studies were retrospective and showed a great variety in patient selection, CT techniques and aims. Importantly, no studies included patients with painless visible haematuria, and results are difficult to compare.
In our study, the median size of the resected RCCs was 65 mm, and it is not surprising that these tumours were visible on both the control and experimental CT. However, a subset of nine small potential malignant renal tumours, with a median size of 12 mm, were classified as false positive since they were not resected, and there was no growth during the follow-up time. The false positive CTs reduced the positive predictive value for both the control and experimental CT. Despite some variability amongst the readers in identifying these small masses, there was no significant difference in false positive rates between the control and experimental CT scans (Table 4).
The majority of the false positive renal masses exhibited unequivocal contrast enhancement (Figures 3 and 4). In the absence of secondary signs of malignancy, contrast enhancement is the single most important sign of a malignant tumour [21]. Still, enhancement cannot reliably distinguish benign from malignant tumours [21–23]. The low risk of malignancy in smaller tumours and the improbity that they contribute to visible haematuria further complicate the diagnostic evaluation. Consequently, the false positive findings in our study should be interpreted as renal incidental findings, a common phenomenon occurring in approximately 37% of all CTs, with only a few demonstrating clinical relevance [24].
It may be difficult to distinguish a partially dense cyst from a poorly enhancing solid tumour. In these cases, dual energy acquisition with virtual non-contrast images and iodine maps might be useful. However, in our study, contrast enhancement was visually assessed without any pre-defined cut-off values, and the added value of virtual non-contrast and iodine maps is unknown.
All resected tumours in our study were clear cell RCCs, which is the most common RCC subtype [25, 26]. Typically, clear cell carcinomas are hyper vascular implying optimal visibility during the corticomedullary CT phase [27]. However, this does not exclude visibility during the nephrographic phase. Our study revealed that some clear cell RCCs demonstrated hypo enhancement compared to renal cortex (Figures 1 and 2), highlighting the heterogeneity in the radiological presentation of clear cell RCCs. This observation aligns with previous studies, indicating that contrast enhancement is unreliable for distinguishing between different subtypes of renal tumours [21–23]. This is also illustrated by the mixed appearance of chromophobe RCCs [28]. On the other hand, papillary RCCs are typically considered hypo vascular and expected to be best visualised during the nephrographic phase [27]. None of the resected tumours in our study was papillary or chromophobe RCCs.
The classic triad of visible haematuria, flank pain and palpable abdominal mass has become an exceedingly rare presentation, with 60–70% of RCCs now identified incidentally on abdominal imaging [29, 30]. In absence of other specific symptoms, painless visible haematuria remains the main sign of RCC, with UC and stones as the main urological differential diagnoses. The primary role of CT in case of haematuria is to detect upper tract malignancies, and the incidences of RCC and UTUC are equally low. Therefore, it becomes imperative to adopt a unified CT protocol capable of detecting both conditions with a radiation dose ‘as low as reasonably achievable’ (ALARA). Our prior findings indicated that a single nephrographic phase CT sufficed for detecting UC, and the current study reinforces that this protocol is also effective in detecting RCCs. Whilst results pertaining to urinary stone detection are yet to be published, we contend that our study marks a significant step towards establishing a unified and lean CT protocol for patients presenting with painless visible hematuria.
Limitations
The present study reports one of the secondary outcomes of PROTEHCT, and since only seven RCCs were detected, one may question the reliability of our results. This is especially relevant for sensitivity analyses. However, since the incidence of RCCs is only 1–2% in patients with visible haematuria, the vast majority of the CT scans are negative, regardless of protocol. This illustrates the importance of reducing unnecessary CT scans. We report results after a median follow-up time of 19 months, and a longer follow-up might have changed results in terms of fewer false positives and more false negatives. All readers in our study were experienced radiologists, and the primary readers were dedicated uroradiologists. This raises the question of generalisability to less experienced readers. However, the high agreement and small differences in diagnostic accuracies between the control and experimental CT for all readers support that a single nephrographic phase CT is sufficient for detecting RCC for general radiologists too. Still, the performance of a simpler CT examination for less experienced readers is unknown.
Conclusion
A single nephrographic phase dual energy CT is sufficient for detecting RCC in patients with painless visible hematuria. This CT protocol will reduce patient radiation and improve the radiological capacity without compromising the diagnostic accuracy.
Acknowledgements
We would like to thank our CT radiographer team, led by Ms. Gøril Mæland, for making this study possible. We would also thank Mr. Bjørn Næss and Mr. Morten Hørthe (DIPS® electronic patient record) who, without payment, designed and customised a study-specific database within our EPR.
ORCID
Kristina Flor Galtung https://orcid.org/0000-0002-3837-9170
Peter Mæhre Lauritzen https://orcid.org/0000-0002-2309-7218
Erica Ponzi https://orcid.org/0000-0002-6089-3512
Eduard Baco: https://orcid.org/0000-0001-7747-4958
Erik Rud https://orcid.org/0000-0002-3740-2519
References
- [1] Tan WS, Feber A, Sarpong R, et al. Who should be investigated for haematuria? Results of a contemporary prospective observational study of 3556 patients. Eur Urol. 2018;74(1):10–14. https://doi.org/10.1016/j.eururo.2018.03.008
- [2] Fankhauser CD, Waisbrod S, Fierz C, et al. Diagnostic accuracy of ultrasonography, computed tomography, cystoscopy and cytology to detect urinary tract malignancies in patients with asymptomatic hematuria. World J Urol. 2021;39(1):97–103. https://doi.org/10.1007/s00345-020-03171-6
- [3] Rai BP, Escrig JLD, Vale L, et al. Systematic review of the incidence of and risk factors for urothelial cancers and renal cell carcinoma among patients with haematuria. Eur Urol. 2022;82(2):182–192. https://doi.org/10.1016/j.eururo.2022.03.027
- [4] Ljungberg B, Albiges L, Abu-Ghanem Y, et al. European Association of Urology guidelines on renal cell carcinoma: the 2022 update. Eur Urol. 2022;82(4):399–410. https://doi.org/10.1016/j.eururo.2022.03.006
- [5] Rouprêt M, Seisen T, Birtle AJ, et al. European Association of Urology guidelines on upper urinary tract urothelial carcinoma: 2023 update. Eur Urol. 2023;84(1):49–64. https://doi.org/10.1016/j.eururo.2023.03.013
- [6] Georgieva MV, Wheeler SB, Erim D, et al. Comparison of the harms, advantages, and costs associated with alternative guidelines for the evaluation of hematuria. JAMA Intern Med. 2019;179(10):1352–1362. https://doi.org/10.1001/jamainternmed.2019.2280
- [7] Bromage SJ, Liew MPC, Moore KC, Raju B, Shackley DC. The economic implications of unsuspected findings from CT urography performed for haematuria. Br J Radiol. 2012;85(1017):1303–1306. https://doi.org/10.1259/bjr/96070557
- [8] Galtung KF, Lauritzen PM, Sandbæk G, et al. Is a single nephrographic phase computed tomography sufficient for detecting urothelial carcinoma in patients with visible haematuria? A prospective paired noninferiority comparison. Eur Urol Open Sci. 2023;55:1–10. https://doi.org/10.1016/j.euros.2023.06.005
- [9] Szolar DH, Kammerhuber F, Altziebler S, et al. Multiphasic helical CT of the kidney: increased conspicuity for detection and characterization of small (< 3-cm) renal masses. Radiology. 1997;202(1):211–217. https://doi.org/10.1148/radiology.202.1.8988213
- [10] Birnbaum BA, Jacobs JE, Ramchandani P. Multiphasic renal CT: comparison of renal mass enhancement during the corticomedullary and nephrographic phases. Radiology. 1996;200(3):753–758. https://doi.org/10.1148/radiology.200.3.8756927
- [11] Songib NA, Nazri M, Yaakup NA, Nor HM, Sun Z. Multiphase renal CT in the evaluation of renal masses: is the nephrographic phase necessary? Clin Imaging. 2013;37(6):1037–1042. https://doi.org/10.1016/j.clinimag.2013.08.005
- [12] Kopka L, Fischer U, Zoeller G, Schmidt C, Ringert RH, Grabbe E. Dual-phase helical CT of the kidney: value of the corticomedullary and nephrographic phase for evaluation of renal lesions and preoperative staging of renal cell carcinoma. J Urology. 1998;160(4):1586–1587. https://doi.org/10.1016/S0022-5347(01)62634-X
- [13] Yuh BI, Cohan RH, Francis IR, Korobkin M, Ellis JH. Comparison of nephrographic with excretory phase helical computed tomography for detecting and characterizing renal masses. Can Assoc Radiol J. 2000;51(3):170–176.
- [14] Silverman SG, Pedrosa I, Ellis JH, et al. Bosniak classification of cystic renal masses, version 2019: an update proposal and needs assessment. Radiology. 2019;292(2):182646. https://doi.org/10.1148/radiol.2019182646
- [15] Wilson EB. Probable inference, the law of succession, and statistical inference. J Am Stat Assoc. 1927;22(158):209–212. https://doi.org/10.1080/01621459.1927.10502953
- [16] Newcombe RG. Two‐sided confidence intervals for the single proportion: comparison of seven methods. Stat Med. 1998;17(8):857–872. https://doi.org/10.1002/(SICI)1097-0258(19980430)17:8%3C857::AID-SIM777%3E3.0.CO;2-E
- [17] DeLong ER, DeLong DM, Clarke-Pearson DL. Comparing the areas under two or more correlated receiver operating characteristic curves: a nonparametric approach. Biometrics. 1988;44(3):837–845. https://doi.org/10.2307/2531595
- [18] Landis JR, Koch GG. The Measurement of Observer Agreement for Categorical Data. Biometrics 1977;33:159. https://doi.org/10.2307/2529310.
- [19] Rud E, Galtung KF, Lauritzen PM, Baco E, Flatabø T, Sandbæk G. Examining the upper urinary tract in patients with hematuria – time to revise the CT urography protocol? Eur Radiol. 2020;30(3):1664–1670. https://doi.org/10.1007/s00330-019-06521-0
- [20] Vogel C, Ziegelmüller B, Ljungberg B, et al. Imaging in suspected renal-cell carcinoma: systematic review. Clin Genitourin Canc. 2019;17(2):e345–e355. https://doi.org/10.1016/j.clgc.2018.07.024
- [21] Rossi SH, Prezzi D, Kelly-Morland C, Goh V. Imaging for the diagnosis and response assessment of renal tumours. World J Urol. 2018;36(12):1927–1942. https://doi.org/10.1007/s00345-018-2342-3
- [22] Choudhary S, Rajesh A, Mayer NJ, Mulcahy KA, Haroon A. Renal oncocytoma: CT features cannot reliably distinguish oncocytoma from other renal neoplasms. Clin Radiol. 2009;64(5):517–522. https://doi.org/10.1016/j.crad.2008.12.011
- [23] Kang SK, Huang WC, Pandharipande PV, Chandarana H. Solid renal masses: what the numbers tell us. Am J Roentgenol. 2014;202(6):1196–1206. https://doi.org/10.2214/AJR.14.12502
- [24] Meyer HJ, Pfeil A, Schramm D, Bach AG, Surov A. Renal incidental findings on computed tomography. Medicine. 2017;96(26):e7039. https://doi.org/10.1097/MD.0000000000007039
- [25] Warren AY, Harrison D. WHO/ISUP classification, grading and pathological staging of renal cell carcinoma: standards and controversies. World J Urol. 2018;36(12):1913–1926. https://doi.org/10.1007/s00345-018-2447-8
- [26] Nazzani S, Zaborra C, Biasoni D, et al. Renal tumor biopsy in patients with cT1b-T4-M0 disease susceptible to radical nephrectomy: analysis of safety, accuracy and clinical impact on definitive management. Scand J Urol. 2022;56(5–6):367–372. https://doi.org/10.1080/21681805.2022.2092549
- [27] Lee-Felker SA, Felker ER, Tan N, et al. Qualitative and quantitative MDCT features for differentiating clear cell renal cell carcinoma from other solid renal cortical masses. AJR Am J Roentgenol. 2014;203(5):W516–W524. https://doi.org/10.2214/AJR.14.12460
- [28] Raman SP, Johnson PT, Allaf ME, Netto G, Fishman EK. Chromophobe renal cell carcinoma: multiphase MDCT enhancement patterns and morphologic features. Am J Roentgenol. 2013;201(6):1268–1276. https://doi.org/10.2214/AJR.13.10813
- [29] Vasudev NS, Wilson M, Stewart GD, et al. Challenges of early renal cancer detection: symptom patterns and incidental diagnosis rate in a multicentre prospective UK cohort of patients presenting with suspected renal cancer. BMJ Open. 2020;10(5):e035938. https://doi.org/10.1136/bmjopen-2019-035938
- [30] Rosenblad AK, Sundqvist P, Harmenberg U, et al. Surgical waiting times and all-cause mortality in patients with non-metastatic renal cell carcinoma. Scand J Urol. 2022;56(5–6):383–390. https://doi.org/10.1080/21681805.2022.2107067