ORIGINAL RESEARCH ARTICLE
Prospective validation study of a combined urine and plasma test for predicting high-grade prostate cancer in biopsy naïve men
Torben Brøchner Pedersena,b, Mads Hvid Poulsenc,d,e, Martin Lunda, Søren Feddersenf,g, Maher Albitarh, Charlotte Aaberg Poulsena and Lars Lunda,d,g
aDepartment of Urology, Odense University Hospital, Odense, Denmark; bOpen Patient Data Explorative Network (OPEN), Odense University Hospital, Odense, Denmark; cDepartment for Urology, Esbjerg Hospital, University Hospital of Southern Denmark, Esbjerg, Denmark; dAcademy of Geriatric Cancer Research (AgeCare), Odense University Hospital, Odense, Denmark; eDepartment of Regional Health Research, University of Southern Denmark, Esbjerg, Denmark; fDepartment of Clinical Biochemistry, Odense University Hospital, Odense, Denmark; gDepartment of Clinical Research, University of Southern Denmark, Odense, Denmark; hGenomic Testing Cooperative, Irvine, CA, USA
ABSTRACT
Objective: Early and accurate diagnosis of prostate cancer (PC) is crucial for effective treatment. Diagnosing clinically insignificant cancers can lead to overdiagnosis and overtreatment, highlighting the importance of accurately selecting patients for further evaluation based on improved risk prediction tools. Novel biomarkers offer promise for enhancing this diagnostic process. In this study, we aimed to externally validate a previously developed urine and plasma biomarker test in a biopsy-naïve population.
Materials and methods: Urine and blood samples were prospectively collected from 362 biopsy-naïve men with suspected PC before they underwent transrectal prostate biopsies. The expression levels of a 10-gene mRNA panel were quantified using reverse transcription/quantitative polymerase chain reaction of both urine and plasma. These gene expression levels, combined with clinical features and plasma prostate-specific antigen (PSA) levels, were used to predict the presence of International Society of Urological Pathology grade group ≥ 2 PC.
Results: Complete data were available for 314 patients. The sensitivity and specificity of the biomarker test were 87% (95% CI: 79–93%) and 42% (95% CI: 36–49%), respectively. The area under the curve was 0.76 (95% CI: 0.7–0.82) for the biomarker test probability and 0.65 (95% CI: 0.59–0.72) for PSA (p = 0.02). The test’s negative predictive value was 89% (CI: 81–94%).
Conclusion: This study did not replicate the previously reported high accuracy of the biomarker test, highlighting the need for further refinement and robust external validation to ensure reliable performance across diverse patient populations.
KEYWORDS: Prostate neoplasms; prostate specific antigen; diagnosis; validation; biomarkers
Citation: Scandinavian Journal of Urology 2025, VOL. 60, 8–13. https://doi.org/10.2340/sju.v60.42752.
Copyright: © 2025 The Author(s). Published by MJS Publishing on behalf of Acta Chirurgica Scandinavica. This is an Open Access article distributed under the terms of the Creative Commons Attribution 4.0 International License (http://creativecommons.org/licenses/by/4.0/), allowing third parties to copy and redistribute the material in any medium or format and to remix, transform, and build upon the material, with the condition of proper attribution to the original work.
Received: 10 November 2024; Accepted: 13 December 2024; Published: 14 January 2025
CONTACT Torben Brøchner Pedersen torben.b.pedersen@rsyd.dk Department of Urology, Odense University Hospital, J.B. Winsløwsvej 4, 5000 Odense C, Denmark.
Introduction
Accurate differentiation between clinically significant and insignificant prostate cancer (PC) is essential for effective patient management. Clinically significant PC is typically defined as International Society of Urological Pathology (ISUP) grade ≥ 2 [1]. Low-grade PC (ISUP grade 1) grows slowly with minimal risk of progression, and aggressive treatment of such cancers may lead to overtreatment and unnecessary psychological and physical distress [2, 3]. For ISUP grades 2–3, outcomes vary, with some behaving indolently and others progressing more aggressively. Therefore, stratifying risk within this group is critical to identify those who may benefit from curative treatment [4]. Enhanced stratification reduces unnecessary biopsies and overtreatment of low-grade cancers, especially as PC incidence is expected to rise [5].
Current guidelines recommend initial multiparametric Magnetic resonance imaging (mpMRI) for suspected PC prior to biopsy, as mpMRI improves clinically significant cancer detection whilst reducing unnecessary biopsies [6, 7]. Although mpMRI with targeted biopsy is now standard in many countries, its interpretation requires expertise, and access remains limited. Furthermore, mpMRI alone cannot fully exclude PC, underscoring the need for complementary diagnostic tools [8, 9]. Prostate-specific antigen (PSA) testing remains the primary screening method, though its lack of specificity may lead to unnecessary biopsies [10, 11].
Additional blood tests, such as Prostate Health Index (PHI) and 4K score, measure PSA variants to aid in reducing unnecessary biopsies in men with PSA levels between 2 and 10 ng/mL [12, 13]. IsoPSA, based on PSA structure, further distinguishes between high- and low-grade cancers [14]. The Stockholm3 test combines clinical data, biomarkers and genetics to potentially reduce MRI requirements [15], whilst Proclarix estimates cancer risk in ambiguous MRI cases [16]. Urine biomarkers like PCA3 and SelectMDX assess cancer presence and aggressiveness, often alongside MRI, to improve risk stratification [17, 18]. Despite their potential, these biomarkers have not yet achieved widespread clinical use.
Combining urine and plasma biomarkers with clinical data offers another promising diagnostic approach. Albitar et al. showed that a panel of these biomarkers could predict biopsy outcomes with high predictive accuracy, even identifying low-grade cancers (ISUP grade ≥ 2) [19, 20]. This study aims to externally validate these findings in a biopsy-naïve population, assessing the biomarker test’s potential to reduce unnecessary biopsies and improve patient selection for mpMRI and biopsy.
Materials and methods
Study design and patients
Men scheduled for transrectal ultrasound-guided prostate biopsy on suspicion of PC were invited to participate in this prospective study. A written-informed consent was obtained from all participants prior to inclusion. This study was approved by The Regional Committees on Health Research Ethics for Southern Denmark (#S-20170043). Eligibility criteria excluded patients with PSA values above 20 μg/L, a history of previous prostate biopsy, or previous/current therapy for benign prostatic hyperplasia (BPH), including surgery, medical therapy (except alpha-adrenergic antagonists) or catheterisation (intermittent or indwelling). Patients meeting these criteria were considered biopsy-naïve and eligible for inclusion. We used the identical choice of analysis equipment and reagents as in the previous studies [19, 20].
Urine and plasma processing
Approximately 60 ml of first-void urine and 12 mL (two 6 mL blood Ethylenediaminetetraacetic acid (EDTA) vials) of peripheral whole blood were collected from each participant without prior digital rectal examination. Urine collection was conducted in the morning under non-fasting conditions. Urine samples were immediately placed on ice and processed within 48 hours. The samples were centrifuged using Amicon Ultra-15 Centrifugal Filter Units with a 3 kDa molecular weight cut-off membrane (Millipore, Billerica, MA, USA) in a swinging bucket rotor at 3220xg (approximately 4,000 rpm) until 1 mL of concentrated urine remained. All urine processing was performed on ice to preserve RNA integrity, following previously published protocols [21, 22]. Plasma was separated from the peripheral blood samples by centrifugation at 805 g for 10 minutes.
Nucleic acid isolation for RNA and DNA was carried out using the NUCLISENS® easyMAG® Automated DNA/RNA extraction system (bioMérieux, Marcy-l’Étoile, France). Following purification, nucleic acids were either analysed immediately or stored at −80°C for later analysis. RNA quality was ensured by adhering to protocols designed to mitigate degradation, particularly during storage and transport, which were critical for maintaining sample integrity.
Quantitative reverse transcription-polymerase chain reaction
The biomarker test in this study was based on the expression levels of 10 genes in both urine and plasma (NeoLAB Prostate©, Florida, USA). The gene panel included UAP1, PDLIM5, IMPDH2, HSPD1, PCA3, PSA, TMPRSS2, ERG, GAPDH, B2M, AR and PTEN. GAPDH and B2M were used as housekeeping genes for normalisation. Quantitative reverse transcription-polymerase chain reaction (qRT-PCR) was performed as previously described [21, 22], using RNA Ultrasense One-Step Quantitative RT-PCR on a ViiA™ 7 Real-Time PCR system (Applied Biosystems, Foster City, CA, USA). Equal amounts of RNA were extracted from both plasma and urine, dissolved in water and used in each qRT-PCR assay. All assays followed standardised protocols to ensure consistent gene quantification.
Biopsy procedure
A standard 12-core biopsy protocol was followed, targeting the peripheral zone of the prostate. Patients received antibiotic prophylaxis according to local guidelines. Ultrasound guidance for the biopsy was provided by the BK3000 Ultrasound System (BK Medical A/S, Herlev, Denmark) equipped with an E14C4t (9018) Prostate Triplane Endocavity Transducer.
Biomarker test calculation
The biomarker test used to estimate the probability of ISUP grade ≥ 2 PC has been previously described in detail [21, 23]. In addition to biomarker levels, the test incorporates the following clinical parameters as covariates: age, prostate size, previous biopsy history and PSA levels. These covariates are integrated into the test using a logistic regression model, where they serve as independent variables to adjust and refine the probability estimates for ISUP grade ≥ 2 PC. By accounting for these clinical parameters alongside biomarker levels, the logistic regression framework allows the model to provide individualised risk predictions that are more precise and clinically relevant. The biomarker test generates predictions for three sensitivity cut-off points (high, medium and low); for this study, the high sensitivity cut-off was used to predict ISUP grade group ≥ 2 PC.
Statistical analyses
Statistical analyses were performed using R version 4.4.1 (2024-06-14) [24]. The Prostate Biopsy Collaborative Group Risk Calculator (PBCG-RC) was employed to estimate the risk of high-grade PC (Gleason score ≥ 7 (3 + 4)) [25]. Covariates included in the PBCG-RC are age, prostate size, digital rectal examination findings, family history of PC, use of 5-alpha reductase inhibitors, self-identified race, history of prior biopsy and PSA levels. These variables represent key clinical and demographic factors that are known to influence PC risk. The PBCG-RC integrates these covariates into a logistic regression framework to calculate individualised risk probabilities.
For consistency, information on digital rectal examination findings was categorised as missing in the PBCG-RC calculations, as this parameter was not incorporated into the biomarker test being evaluated. Binomial confidence limits were calculated for sensitivity, specificity, positive predictive value (PPV) and negative predictive value (NPV). The area under the curve (AUC) for receiver operating characteristic (ROC) curves was compared using DeLong’s nonparametric approach to assess the discriminatory performance of the biomarker test versus PSA. Decision curve analysis was performed to evaluate the clinical utility of the biomarker test probability compared to PSA for clinically relevant biopsy thresholds. Calibration of the biomarker test was assessed through visual inspection of calibration plots. Statistical significance was set at p < 0.05.
Results
Patient characteristics
A total of 362 men were included between November 2018 and September 2021. Complete biopsy and biomarker data were available for 314 men. Missing data were attributed to patients declining biopsy after inclusion, inadequate urine volume, technical malfunctions of analysis equipment and withdrawal of consent. The characteristics of the study population are summarised in Table 1. The overall prevalence of ISUP grade group ≥ 2 cancer was 29.6% (n = 98).
| Variable | (n = 314) |
| Age (years) | |
| Median (IQR) | 68 (62, 73) |
| Range | 44–82 |
| Serum PSA (μg/L) | |
| Median (IQR) | 6.5 (5.0, 9.2) |
| Range | 0.32–20 |
| TRUS Volumea (cm3) | |
| Median (IQR) | 50 (37, 72) |
| Range | 14–160 |
| PSA Density (μg/L/cm3) | |
| Median (IQR) | 0.12 (0.08, 0.20) |
| Range | 0.0076–0.64 |
| Clinical T-Stage | |
| cTx | 2 (1%) |
| cT1c | 234 (75%) |
| cT2a | 31 (10%) |
| cT2b | 15 (5%) |
| cT2c | 13 (4%) |
| cT3a | 16 (5%) |
| cT3b | 3 (1%) |
| ISUP* grade | |
| Negative biopsy | 145 (46%) |
| 1 | 75 (24%) |
| 2 | 59 (19%) |
| 3 | 17 (5%) |
| 4 | 8 (3%) |
| 5 | 10 (3%) |
| The data were collected between the years 2018 and 2021. IQR: Interquartile range; PSA: prostate-specific antigen. aVolume measured by transrectal ultrasound (TRUS). *International Society of Urological Pathology. | |
Prediction of ISUP grade group ≥ 2
Figure 1 shows the ROC curves for PSA, PBCG-RC and the biomarker test (Figure 1A). The corresponding decision curves are displayed in the right panel (Figure 1B). Overall, the PBCG-RC model demonstrated superior discrimination compared to the biomarker test (AUC: 0.81 (95% CI: 0.76–0.86) vs 0.76 (95% CI: 0.7–0.82), p value = 0.03). Using a 10% risk threshold for biopsy, the biomarker test yielded a lower net benefit than PSA, PBCG-RC and the reference strategy (0.216, 0.222, 0.226 and 0.222). For details on the other sensitivity cut-off points, refer to Table 2.
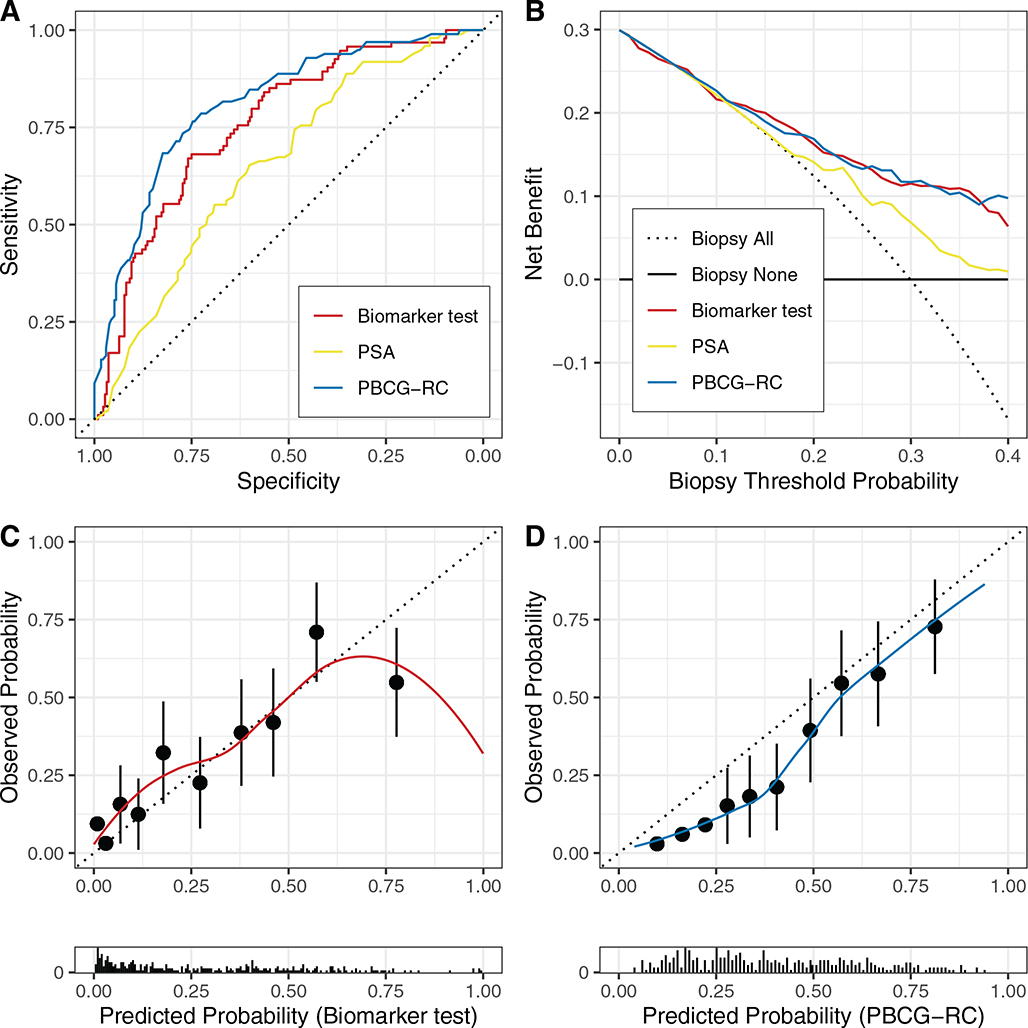
Figure 1. Performance evaluation of the biomarker test, Prostate Biopsy Collaborative Group (PBCG) Risk Calculator (RC) and PSA levels. (A) receiver operating characteristic (ROC) curves for the biomarker test, PBCG-RC and prostate-specific antigen (PSA), showing their respective areas under the curve (AUC): biomarker test: 0.76 (95% CI: 0.7–0.82). PSA: 0.65 (95% CI: 0.59–0.72); PBCG-RC: 0.81 (95% CI: 0.76–0.86). (B) Decision curves illustrating net benefit across various thresholds. The reference strategy assumes biopsying all men. (C) Calibration plot for the biomarker test, with a logistic calibration intercept of −0.301 and slope of 0.47. The dotted line represents perfect calibration, and black dots show observed probabilities with error bars for deciles of predicted probabilities. A distribution plot of predicted probabilities is displayed below. (D) Calibration plot for the PBCG-RC, with similar features as described in panel C.
A visual inspection of the biomarker test’s calibration plot suggests fair calibration at low-risk levels, with an underestimation of probability at low overall risk and an overestimation of risk at less clinically relevant higher risk (Figure 1C). The PBCG model, in contrast, overestimated risk across the full probability range (Figure 1D). At a 10% risk threshold, the PBCG-RC model demonstrated a sensitivity of 99% (95% CI: 94–100%), a specificity of 6% (95% CI: 4–10%) and a NPV of 94% (CI: 70–100%). The corresponding sensitivity and specificity of our test biomarker test were 87% (95% CI: 79–93%) and 42% (95% CI: 36–49%), respectively, with a NPV of 89% (CI: 81–94%).
Discussion
We previously evaluated a biomarker test that integrated a panel of urine and plasma biomarkers with clinical data to predict clinically significant PC in a cohort of 33 patients, yielding promising initial results. However, in this external validation study involving 314 biopsy-naïve men, we were unable to replicate those findings. The biomarker test demonstrated a NPV of 89% (CI: 81–94%), with a sensitivity of 87% and specificity of only 42%. By comparison, the PBCG-RC, which does not incorporate biomarkers, exhibited superior discrimination between significant PC and benign conditions. This suggests that clinical factors – such as prostate volume, age and biopsy history – were more informative than the biomarker panel within our study population.
Various urine- and blood-based biomarkers have been proposed to improve early detection and risk stratification of PC, often guiding the decision to perform a biopsy. Amongst the most established biomarker tests are the Progensa Prostate Cancer Antigen 3 (PCA3) assay and the PHI, both of which are United States Food and Drug Administration approved [26, 27]. The Progensa PCA3 assay, which measures PCA3 RNA and PSA mRNA in urine, is typically used to guide repeat biopsy decisions following an initial negative biopsy. In external validation studies, it has demonstrated an AUC of 0.73–0.75. The PHI test, which combines total PSA, free PSA and proPSA (p2PSA), has consistently outperformed traditional PSA testing, with an AUC of 0.703 in men with PSA levels between 2 and 10 μg/L [27].
Other biomarker-based models, such as the four-kallikrein score (4Kscore) and the Stockholm-3 model (S3M), combine plasma protein biomarkers, genetic polymorphisms and clinical features to predict significant PC. However, their contribution to predictive performance can be limited [28]. For instance, S3M achieved an AUC of 0.74 in patients with PSA levels below 10 μg/L, although clinical factors remained the most critical elements for risk stratification [29]. Similarly, the 4Kscore reported an AUC of 0.84 in a cohort of screen-positive men (PSA ≥ 3.0 μg/L) [30]. These studies underscore that, in many cases, clinical parameters dominate biomarker contributions, a pattern we observed in our study.
In our initial study from 2016, PSA values ranged from 0.5 to 283.2 μg/L, a broader range than those typically used in other validation studies [21]. This wide PSA range likely influenced the biomarker test’s performance. In the earlier external validation attempts we performed, in a cohort of prostatectomised men, the results were inherently biased due to the high prevalence of clinically significant PC in that group, with only 15% of patients having an ISUP grade group < 2 [20]. The shift in cohort characteristics and the change in reference standards (from biopsy to prostatectomy specimens) likely contributed to the biomarker test’s lower specificity in this study. A subsequent validation in a mixed cohort of BPH and PC patients also reported high sensitivity but was limited by a small sample size and cohort heterogeneity [22].
Another critical factor is the reproducibility of the assay across different laboratories. In our study, the calibration plot for the biomarker test indicated an overestimation of cancer risk, particularly at higher probability ranges. This discrepancy may be partly explained by differences in laboratory conditions and technologist expertise, which likely influenced the biomarker test’s sensitivity in the prostatectomy cohort. Furthermore, our cohort consisted entirely of biopsy-naïve men, meaning that clinical data points such as prior biopsy history and key elements in the biomarker test did not contribute to risk stratification.
In summary, this study highlights the challenges associated with external validation of biomarker-based tests. The biomarker test examined in this cohort did not perform as expected, particularly in terms of specificity, when compared to clinical tools like the PBCG-RC. Whilst biomarkers hold potential for improving risk stratification, our findings emphasise the need for robust validation across diverse patient populations before clinical implementation. Additionally, the observed variability in test performance across different study settings underscores the importance of standardising assay protocols and addressing factors that may influence reproducibility, such as sample handling and laboratory conditions.
Conclusions
This prospective cohort study was unable to replicate the previously reported high accuracy of the urine and plasma biomarker test for predicting clinically significant PC in biopsy-naïve men. These results underscore the importance of conducting robust external validation across diverse populations before clinical implementation of any biomarker-based diagnostic tests or algorithms.
Acknowledgements
We extend our thanks to the Open Patient data Explorative Network (OPEN), Odense University Hospital, Region of Southern Denmark, for providing data management assistance. This study was partially funded with support from the Danish Cancer Society.
References
- [1] van Leenders GJLH, van der Kwast TH, Grignon DJ, et al. The 2019 International Society of Urological Pathology (ISUP) consensus conference on grading of prostatic carcinoma. Am J Surg Pathol. 2020;44:e87–e99. https://doi.org/10.1097/PAS.0000000000001497
- [2] Oba A, Nakaya N, Saito-Nakaya K, et al. Psychological distress in men with prostate cancer and their partners before and after cancer diagnosis: a longitudinal study. Japanese J Clin Oncol. 2017;47:735–742. https://doi.org/10.1093/jjco/hyx066
- [3] Watts S, Leydon G, Birch B, et al. Depression and anxiety in prostate cancer: a systematic review and meta-analysis of prevalence rates. BMJ Open. 2014;4:e003901. https://doi.org/10.1136/bmjopen-2013-003901
- [4] Preisser F, Cooperberg MR, Crook J, et al. Intermediate-risk prostate cancer: stratification and management. Eur Urol Oncol. 2020;3:270–280. https://doi.org/10.1016/j.euo.2020.03.002
- [5] James ND, Tannock I, N’Dow J, et al. The Lancet Commission on prostate cancer: planning for the surge in cases. Lancet (London, England). 2024;403:1683–1722. https://doi.org/10.1016/S0140-6736(24)00651-2
- [6] Cornford P, van den Bergh RCN, Briers E, et al. EAU-EANM-ESTRO-ESUR-ISUP-SIOG guidelines on prostate cancer – 2024 update. Part I: screening, diagnosis, and local treatment with curative intent. Eur Urol. 2024;86:148–163. https://doi.org/10.1016/j.eururo.2024.03.027
- [7] Drost F-JH, Osses DF, Nieboer D, et al. Prostate MRI, with or without MRI-targeted biopsy, and systematic biopsy for detecting prostate cancer. Cochrane Database of Syst Rev. 2019;4:CD012663. https://doi.org/10.1002/14651858.CD012663.pub2
- [8] Launer BM, Ellis TA, Scarpato KR. A contemporary review: mpMRI in prostate cancer screening and diagnosis. Urol Oncol. 2025;43:15–22. https://doi.org/10.1016/j.urolonc.2024.05.012
- [9] Moldovan PC, Van den Broeck T, Sylvester R, et al. What is the negative predictive value of multiparametric magnetic resonance imaging in excluding prostate cancer at biopsy? A systematic review and meta-analysis from the European Association of Urology Prostate Cancer Guidelines Panel. Eur Urol. 2017;72:250–266. https://doi.org/10.1016/j.eururo.2017.02.026
- [10] Jain MA, Leslie SW, Sapra A. Prostate cancer screening. StatPearls. Treasure Island, FL: StatPearls Publishing; 2024.
- [11] Ilic D, Neuberger MM, Djulbegovic M, et al. Screening for prostate cancer. Cochrane Database Syst Rev. 2013;2013:CD004720. https://doi.org/10.1002/14651858.CD004720.pub3
- [12] Wagaskar VG, Sobotka S, Ratnani P, et al. A 4K score/MRI-based nomogram for predicting prostate cancer, clinically significant prostate cancer, and unfavorable prostate cancer. Cancer Reports (Hoboken, NJ). 2021;4:e1357. https://doi.org/10.1002/cnr2.1357
- [13] Nordström T, Vickers A, Assel M, et al. Comparison between the four-kallikrein panel and prostate health index for predicting prostate cancer. Eur Urol. 2015;68:139–146. https://doi.org/10.1016/j.eururo.2014.08.010
- [14] Klein EA, Partin A, Lotan Y, et al. Clinical validation of IsoPSA, a single parameter, structure-focused assay for improved detection of prostate cancer: a prospective, multicenter study. Urol Oncol. 2022;40:408.e9–408.e18. https://doi.org/10.1016/j.urolonc.2022.06.002
- [15] Nordström T, Discacciati A, Bergman M, et al. Prostate cancer screening using a combination of risk-prediction, MRI, and targeted prostate biopsies (STHLM3-MRI): a prospective, population-based, randomised, open-label, non-inferiority trial. Lancet Oncol. 2021;22:1240–1249. https://doi.org/10.1016/S1470-2045(21)00348-X
- [16] Campistol M, Morote J, Regis L, et al. Proclarix, a new biomarker for the diagnosis of clinically significant prostate cancer: a systematic review. Mol Diagn Ther. 2022;26:273–281. https://doi.org/10.1007/s40291-022-00584-4
- [17] Ploussard G, de la Taille A. The role of prostate cancer antigen 3 (PCA3) in prostate cancer detection. Exp Rev Anticancer Ther. 2018;18:1013–1020. https://doi.org/10.1080/14737140.2018.1502086
- [18] Hendriks RJ, van der Leest MMG, Israël B, et al. Clinical use of the SelectMDx urinary-biomarker test with or without mpMRI in prostate cancer diagnosis: a prospective, multicenter study in biopsy-naïve men. Prostate Cancer Prostatic Dis. 2021;24:1110–1119. https://doi.org/10.1038/s41391-021-00367-8
- [19] Albitar M, Ma W, Lund L, et al. A multi-center prospective study to validate an algorithm using urine and plasma biomarkers for predicting Gleason ≥ 3 + 4 prostate cancer on biopsy. J Cancer. 2017;8:2554–2560. https://doi.org/10.7150/jca.20031
- [20] Albitar M, Ma W, Lund L, et al. Prostatectomy-based validation of combined urine and plasma test for predicting high grade prostate cancer. Prostate. 2018;78:294–299. https://doi.org/10.1002/pros.23473
- [21] Albitar M, Ma W, Lund L, et al. Predicting prostate biopsy results using a panel of plasma and urine biomarkers combined in a scoring system. J Cancer. 2016;7:297–303. https://doi.org/10.7150/jca.12771
- [22] Poulsen MH, Feddersen S, Albitar M, et al. A prospective study of a urine and plasma biomarker test for the prediction of gleason ≥ 3 + 4 prostate cancer in a mixed cohort. Scand J Urol. 2020;54:323–327. https://doi.org/10.1080/21681805.2020.1782979
- [23] Ma W, Diep K, Fritsche HA, et al. Diagnostic and prognostic scoring system for prostate cancer using urine and plasma biomarkers. Genet Test Mol Biomarkers. 2014;18:156–163. https://doi.org/10.1089/gtmb.2013.0424
- [24] R Core Team. R: a language and environment for statistical computing. Vienna: R Foundation for Statistical Computing; 2024.
- [25] Ankerst DP, Straubinger J, Selig K, et al. A contemporary prostate biopsy risk calculator based on multiple heterogeneous cohorts. Eur Urol. 2018;74:197–203. https://doi.org/10.1016/j.eururo.2018.05.003
- [26] Auprich M, Haese A, Walz J, et al. External validation of urinary PCA3-based nomograms to individually predict prostate biopsy outcome. Eur Urol. 2010;58:727–732. https://doi.org/10.1016/j.eururo.2010.06.038
- [27] Lepor A, Catalona WJ, Loeb S. The prostate health index: its utility in prostate cancer detection. Urol Clin North Am. 2016;43:1–6. https://doi.org/10.1016/j.ucl.2015.08.001
- [28] Ström P, Nordström T, Aly M, et al. The Stockholm-3 model for prostate cancer detection: algorithm update, biomarker contribution, and reflex test potential. Eur Urol. 2018;74:204–210. https://doi.org/10.1016/j.eururo.2017.12.028
- [29] Grönberg H, Adolfsson J, Aly M, et al. Prostate cancer screening in men aged 50-69 years (STHLM3): a prospective population-based diagnostic study. Lancet Oncol. 2015;16:1667–1676. https://doi.org/10.1016/S1470-2045(15)00361-7
- [30] Vickers AJ, Cronin AM, Aus G, et al. A panel of kallikrein markers can reduce unnecessary biopsy for prostate cancer: data from the European randomized study of prostate cancer screening in Göteborg, Sweden. BMC Med. 2008;6:19. https://doi.org/10.1186/1741-7015-6-19