RESEARCH LETTER
A comparison of comorbidity indices and estimates of life expectancy for men with prostate cancer
Eugenio Ventimiglia, MD, PhDa, Rolf Gedeborg, MD, PhDa, Andri Wilberg Orrason, MD, PhDa, Paolo Zaurito, MDa,b, Hans Garmo, MDa, Pär Stattin, MD, PhDa, and Marcus Westerberg, PhDa
aDepartment of Surgical Sciences, Uppsala University, Uppsala, Sweden; bDepartment of Urology, San Raffaele Hospital, Milan, Italy
KEYWORDS: CCI; Comorbidities; Life expectancy; MDCI; Prostate cancer
Citation: Scandinavian Journal of Urology 2025, VOL. 60, 105–107. https://doi.org/10.2340/sju.v60.43810.
Copyright: © 2025 The Author(s). Published by Medical Journals Sweden on behalf of Acta Chirurgica Scandinavica. This is an Open Access article distributed under the terms of the Creative Commons Attribution 4.0 International License (http://creativecommons.org/licenses/by/4.0/), allowing third parties to copy and redistribute the material in any medium or format and to remix, transform, and build upon the material, with the condition of proper attribution to the original work.
Received: 11 March 2025; Accepted: 05 May 2025; Published: 3 June 2025
CONTACT: Eugenio Ventimiglia, MD, PhD eugenio.ventimiglia@uu.se Department of Surgical Sciences, Uppsala University, SE-751 05 Uppsala, Sweden
Supplemental data for this article can be accessed online at https://doi.org/10.2340/sju.v60.43810
Competing interests and funding: The authors report no conflicts of interest.
This project was supported by The Swedish Research Council (2022-00544), The Swedish Cancer Society [22 2051], and Region Uppsala. The funding organizations had no influence on planning, execution or completion of the study.
Introduction
Life expectancy is a key component in clinical decision-making for management of men with prostate cancer (Pca). Accurate assessment of life expectancy is therefore crucial in observational studies of adherence to guidelines and pattern of care [1]. Life expectancy is determined by age and comorbidities and there are several indices in use for quantifying comorbidities. The commonly used Charlson comorbidity index (CCI) [2] relies on the presence (Yes/No) of International Classification of Diseases (ICD) codes for a predefined set of diagnoses. One limitation of the CCI is that a large proportion of men with localized Pca have CCI = 0. The Prostate Cancer Comorbidity Index (PCCI) is a development of the CCI intended to improve the performance of CCI in men with Pca, and it has recently been combined with age to estimate life expectancy [3].
We have previously developed two comorbidity indices that both outperform CCI in men with Pca and we have used them to estimate life expectancy [4–6].
The aim of this study was to compare the discriminatory ability of these comorbidity indices and estimates of life expectancy based on register data and to assess their performance in a population-based cohort of men with Pca.
Methods
We conducted a population-based cohort study of men with Pca registered in the National Prostate Cancer Register (NPCR) of Sweden, which captures 98% of all incident Pca cases compared to the Cancer Register to which reporting is mandated by law [7]. The aim of NPCR is to ensure optimal care for men with Pca and to this end NPCR registers and reports data on cancer characteristics, diagnostic work-up, primary treatment, and adherence to national guidelines [8]. In Prostate Cancer data Base Sweden (PCBase), NPCR has been linked to other national healthcare registers and demographic databases. We extracted data from PCBase 5 on men with Pca diagnosed at age 50–90 years between 2012 and 2020 [6]. Follow-up started at date of Pca diagnosis.
Comorbidity was measured using CCI, PCCI, our new multidimensional diagnosis-based comorbidity index (MDCI), and our new drug comorbidity index (DCI). The CCI, PCCI, and MDCI were computed based on ICD-10 codes registered for the individual in The National Patient Register during a 10-year lookback period preceding the date of diagnosis [5, 9]. We adapted the PCCI to ICD-10 codes (Supplementary methods). The MDCI captures occurrence, recency, and frequency of included ICD-10 codes, as well as total duration of hospital stays with each code. The DCI is calculated based on Anatomical Therapeutic Chemical (ATC) codes (five digits) for fillings in the Prescribed Drug Register during the 365-day period preceding the index date [4].
We computed an age-adjusted PCCI (AAPCCI) where an additional point was given for each 6-year increase in age at diagnosis above 60 years [3], and used it to estimate life expectancy similarly as in Daskivich TJ, Luu M, Heard J, et al [10] (AAPCCI 0–4: above 10 years; 5–9: 5–10 years; ≥10: below 5 years). We also estimated life expectancy using the previously described PCBase method for estimate of life expectancy (PCBase method) based on MDCI, DCI and age [6].
Date and cause of death were extracted from The Cause of Death Register. Follow-up ended on December 31st, 2023, or at date of death or migration, whichever event came first.
We estimated the discrimination of risk of death from any cause and from causes other than Pca using the concordance index (C index) after 1, 5, and 10 years of follow-up, overall and according to age (50–59, 60–69, 70–79, and 80–90 years). We described the distribution of life expectancy by use of the PCBase method, the AAPCCI, and by use of the life expectancy categories based on AAPCCI. The Swedish Research Ethics Authority approved the study.
Results
The study included 90,319 men with Pca. CCI = 0 was found in 57,030 (63%) men. Almost 50% (n = 44,593) had PCCI = 0. Within all age groups discrimination of death from any cause at 1 year was highest using the MDCI and life expectancy based on the PCBase method and PCCI, AAPCCI, DCI, and CCI all had lower discrimination (Figure 1). For example, in men aged 60–69 the C index was 0.79 (95% CI: 0.77–0.81) for MDCI, 0.79 (95% CI: 0.77–0.82) for life expectancy based on the PCBase method, 0.68 (95% CI: 0.66–0.71) for PCCI, 0.70 (95% CI: 0.67–0.72) for AAPCCI, and 0.65 (95% CI: 0.62–0.67) for CCI. The pattern was similar for death from other causes than Pca and when using longer follow-up (data not shown). The overlap of men with similar life expectancy based on the PCBase method and AAPCCI was overall 72%. The AAPCCI failed to identify 37% of 3,856 men with life expectancy <5 years according to the PCBase method, 49% of 14,857 men with life expectancy between 5 and 10 years, and 13% of 71,606 men with life expectancy >10 years (Table 1).
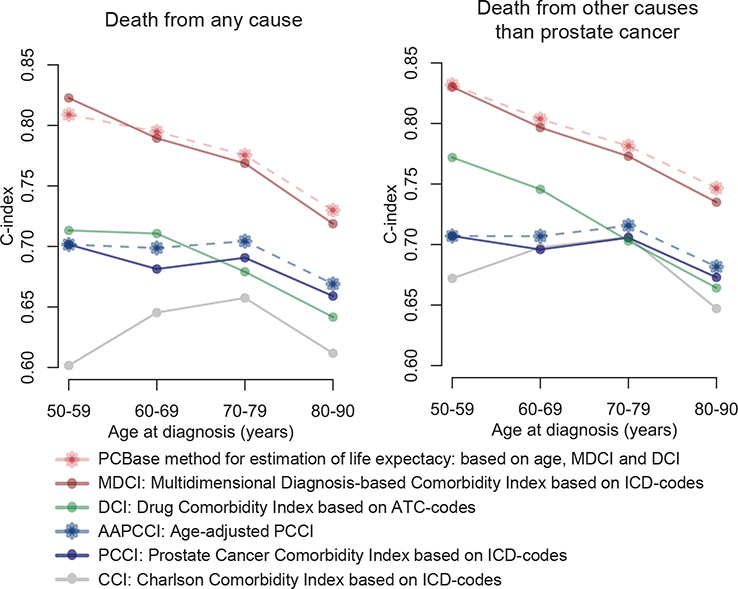
Figure 1. Discrimination (C index) using 1 year of follow-up for death. Stars indicate that the index also included age. In analysis of death from other causes men who died of prostate cancer were censored at that date.
Discussion
The PCBase method based on age, MDCI, and DCI provided better discrimination of death from any cause in men with Pca than the age-adjusted version of PCCI (AAPCCI), which is a modification of the CCI and predicted death better than CCI.
Across all age groups, the C index for death from any cause and other causes than Pca was consistently higher for MDCI and the PCBase method compared to AAPCCI, PCCI, and CCI. In addition, the PCBase method produced a wide range of survival estimates within each AAPCCI category, reflecting substantial remaining heterogeneity within the AAPCCI categories. While there was overall 72% agreement between AAPCCI-based and PCBase method categories, substantial discordance was observed.
Strengths and limitations
The strengths of our study include the large number of men in a population-based cohort, comprehensive data on codes in high-quality national healthcare registers used to create the comorbidity indices. A limitation of the comparison is that the PCCI was specifically developed on men with Pca, while the MDCI was developed on a broader population of Pca-free control men [7]. Of note, there is a potential influence of Pca on the risk of death when an index is created based on men with Pca. Differences in comorbidity and performance of healthcare systems in the United States and Sweden may influence these indices. For example, in a previous comparison of CCI and PCCI using U.S. Veteran Affairs data [9] these indices demonstrated high and virtually similar C-index (0.802 vs. 0.816) in predicting death from causes other than Pca, i.e. substantially higher than in our comparison. Of note, the methods in this study are intended to be used in register-based non-interventional studies and not in clinical practice.
Interpretation
Men with a limited life expectancy below 10 years have little benefit from radical Pca treatment as stated in guidelines, so life expectancy should inform decision-making in men with Pca [7]. In order to assess adherence to guideline recommendations, accurate assessment of life expectancy is therefore needed in observational studies. Recently, we reported overuse of radical treatment in men with short life expectancy, and this was more pronounced in the VA system in the US than in Sweden [1].
MDCI had a better discrimination of death when compared with the other comorbidity indices, including PCCI, across all age groups. Within specific categories of life expectancy based on the PCBase method – selected to align with key clinical decision points in Pca management – life expectancy based on AAPCCI assign 13%–49% of men to the same category as the PCBase method.
Conclusion
The PCBase method to estimate of life expectancy in men with Pca showed superior discrimination compared to other comorbidity indices. Reliable methods for assessing comorbidity and life expectancy are crucial for reducing bias and enhancing the interpretation of observational studies.
Disclaimer
Rolf Gedeborg is also employed by the Medical Products Agency (MPA) in Sweden. The MPA is a Swedish Government Agency. The views expressed in this article may not represent the views of the MPA.
References
- [1] Ventimiglia E, Gedeborg R, Styrke J, et al. Radical treatment for prostate cancer in men with limited life expectancy in Sweden. JAMA Netw Open. 2025;8(5):e258572. https://doi.org/10.1001/jamanetworkopen.2025.8572
- [2] Charlson ME, Pompei P, Ales KL, et al. A new method of classifying prognostic comorbidity in longitudinal studies: development and validation. J Chronic Dis. 1987;40(5):373–383. https://doi.org/10.1016/0021-9681(87)90171-8
- [3] Daskivich TJ, Kwan L, Dash A, et al. An age adjusted comorbidity index to predict long-term, other cause mortality in men with prostate cancer. J Urol. 2015;194(1):73–78. https://doi.org/10.1016/j.juro.2015.01.081
- [4] Gedeborg R, Sund M, Lambe M, et al. An aggregated comorbidity measure based on history of filled drug prescriptions: development and evaluation in two separate cohorts. Epidemiology. 2021;32(4):607–615. https://doi.org/10.1097/EDE.0000000000001358
- [5] Westerberg M, Irenaeus S, Garmo H, et al. Development and validation of a multi-dimensional diagnosis-based comorbidity index that improves prediction of death in men with prostate cancer: nationwide, population-based register study. PLoS One. 2024;19(1):e0296804. https://doi.org/10.1371/journal.pone.0296804
- [6] Westerberg M, Ahlberg M, Orrason AW, et al. Assessment of variability in life expectancy in older men by use of new comorbidity indices. A nationwide population-based study. Scand J Urol. 2024;59:207–209. https://doi.org/10.2340/sju.v59.42504
- [7] Stranne J. 2023/2024 update of the national prostate cancer guidelines in Sweden. Scand J Urol. 2024;59:210–211. https://doi.org/10.2340/sju.v59.42656
- [8] Stattin P. How to improve cancer care by use of guidelines and quality registers. Scand J Urol. 2024;59:190–192. https://doi.org/10.2340/sju.v59.42272
- [9] Daskivich TJ, Chamie K, Kwan L, et al. Improved prediction of long-term, other cause mortality in men with prostate cancer. J Urol. 2011;186(5):1868–1873. https://doi.org/10.1016/j.juro.2011.07.033
- [10] Daskivich TJ, Luu M, Heard J, et al. Overtreatment of prostate cancer among men with limited longevity in the active surveillance era. JAMA Intern Med. 2025;185(1):28–36. https://doi.org/10.1001/jamainternmed.2024.5994