ORIGINAL RESEARCH ARTICLE
Nationwide population-based longitudinal data on magnetic resonance imaging of the prostate and subsequent prostate biopsy results
Eugenio Ventimigliaa, Rolf Gedeborga, Marcus Westerberga, Paolo Zauritoa,b, Fredrik Jäderlingc,d, Pär Stattina and Hans Garmoa
aDepartment of Surgical Sciences, Uppsala University, Uppsala, Sweden; bDivision of Experimental Oncology/Unit of Urology, Urological Research Institute, IRCCS Ospedale San Raffaele, Milan, Italy; cDepartment of Radiology, Capio St. Görans Hospital, Stockholm, Sweden; dDepartment of Molecular Medicine and Surgery, Karolinska Institutet, Stockholm, Sweden
ABSTRACT
Background and aim: Magnetic resonance imaging (MRI) is crucial for prostate cancer (Pca) diagnosis, risk stratification, and treatment planning. However, large-scale observational studies require structured MRI data, which are often only obtainable from free-text reports. We aimed to extract information from narrative prostate MRI reports and to describe subsequent biopsy outcomes in a nationwide population-based cohort.
Methods: We identified 108,361 prostate MRI examinations in Prostate Cancer database Sweden with extended treatments and endpoints data (PCBase Xtend) performed in 2015–2023. A rule-based text recognition algorithm was created and used to extract Prostate Imaging Reporting and Data System (PI-RADS) score and prostate volume from free-text MRI reports. Extracted data were validated against manually extracted information in the National Prostate Cancer Register (NPCR). We examined biopsy rates and Gleason score according to PI-RADS, Prostate Specific Antigen (PSA) density, and calendar year.
Results: The proportion of reports with identifiable PI-RADS scores increased from 38% in 2015–2016 to 83% in 2022–2023, with excellent agreement with NPCR data (correlation coefficient r = 0.94). Extracted prostate volumes correlated well with those in NPCR (r = 0.88). Biopsy rates decreased for PI-RADS 3 lesions over time, particularly in men with PSA density < 0.15 ng/ml/ml, while the proportion of men with PI-RADS 5 lesions who underwent biopsy increased. Almost all prostate cancers in men with PI-RADS 3 lesions were Gleason 6 or 7 (3+4). Gleason 9–10 was almost exclusively found in PI-RADS 5 lesions.
Conclusions: Automated extraction of information from unstructured MRI reports is feasible and accurate. The observed temporal trends reflecting increasing quality and standardization of prostate MRI support its use in large-scale epidemiological research.
KEYWORDS: prostate cancer, prostate MRI, PIRADS, prostate biopsy, PSA density
Citation: Scandinavian Journal of Urology 2026, VOL. 61, 64–71. https://doi.org/10.2340/sju.v61.45540.
Copyright: © 2026 The Author(s). Published by MJS Publishing on behalf of Acta Chirurgica Scandinavica. This is an Open Access article distributed under the terms of the Creative Commons Attribution 4.0 International License (http://creativecommons.org/licenses/by/4.0/), allowing third parties to copy and redistribute the material in any medium or format and to remix, transform, and build upon the material, with the condition of proper attribution to the original work.
Received: 21 November 2025; Accepted: 16 January 2026; Published: 25 March 2026
CONTACT: Eugenio Ventimiglia eugenio.ventimiglia@uu.se Department of Surgical Sciences, Uppsala University, SE-752 37, Uppsala, Sweden
Supplemental data for this article can be accessed online at https://doi.org/10.2340/sju.v61.45540
Competing interests and funding: The authors report no conflicts of interest.
Introduction
Magnetic resonance imaging (MRI) of the prostate has rapidly become crucial for detection, localization, and risk stratification of men with prostate cancer (Pca) [1–3]. Early clinical applications of prostate MRI were primarily anatomical, with the aim to improve tumor localization and staging, and limited by low resolution and consequently poor accuracy. As technology advanced, characterization of tumor aggressiveness and local extent improved and usefulness of MRI increased [4]. The emergence of multiparametric MRI provided a comprehensive assessment tool that is useful for biopsy targeting, risk stratification, and treatment planning. Standardization by use of Prostate Imaging Reporting and Data System version 2.1 (PI-RADS 2.1) further enhanced reproducibility [5–9].
With the increased importance of MRI in the diagnostic work-up and risk classification of Pca follows a need to be able to incorporate this information in large-scale epidemiological research. This requires automated extraction of this information from narrative radiology reports in electronic patient records or radiology information systems. Such data would make it feasible to investigate the use of prostate MRI in large population-based studies.
We aimed to identify key diagnostic information in narrative prostate MRI reports extracted from routine clinical information in radiology information systems, by use of a rule-based text recognition algorithm in order to assess outcome after MRI according to PI-RADS, PSA density and calendar time in terms of prostate biopsies performed, and Pca diagnosis and Gleason score.
Methods
PCBase Xtend
The Prostate Cancer database Sweden (PCBase) is a linkage of the National Prostate Cancer Register (NPCR) to multiple national health care registers [10, 11]. NPCR aims to provide data for optimal and equal cancer care to all men diagnosed with Pca [12–15]. NPCR records 98% of all men with newly diagnosed Pca in Sweden as compared to The Cancer Register, to which reporting is legally mandated. Several other registers, such as the Patient Register, the Cause of Death Register, and the Prescribed Drug Register are included in PCBase [16]. In 2025, we enriched PCBase with data from regional healthcare IT systems in Sweden and created PCBase with extended treatments and endpoints data (PCBase Xtend) [10]. We retrieved longitudinal information on available PSA values, prostate biopsies, and prostate MRI for all men in Sweden, with data both before and after a Pca diagnosis, and also for men without a diagnosed Pca. Between 2016 and 2020, the coverage was complete (100%) for PSA and MRI data, and 97% for biopsy data (Figure 1). Future updates will continue to improve coverage of more recent years.
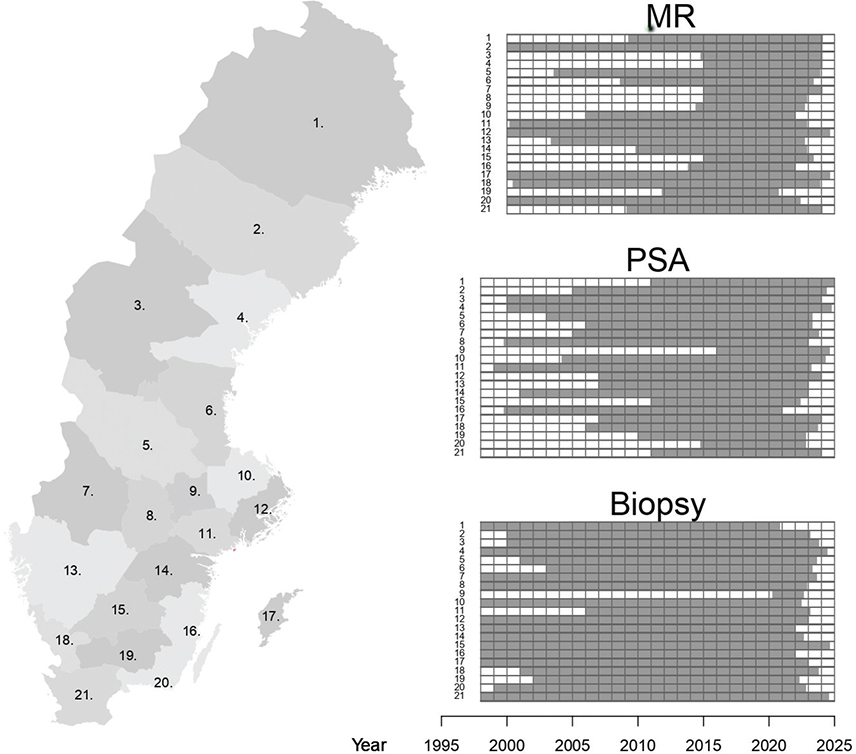
Figure 1. Data availability during the study period
Study population
We identified prostate MRIs performed from 1 January 2015 to 31 December 2023 in men free of Pca (Supplementary Figure 1) and we identified prostate biopsies performed up to 180 days after MRI. To calculate PSA density, we used prostate volume from the MRI and the latest PSA value within the 90-day period prior to the MRI.
PI-RADS versions
The study spans over two versions of the PI-RADS protocol, that is, v2 [17] introduced in 2014 and v2.1 [9], with updates and refinements of the scoring system, introduced in 2019.
MRI data in PCBase Xtend
All prostate MRI reports were recorded as free-text entries. To extract structured information, we developed and applied separate algorithms in order to identify PI-RADS scores and prostate volume. MRI reports with fewer than 29 characters were excluded.
The PI-RADS extraction algorithm began by identifying all instances of the term ‘PI-RADS’, including potential misspellings (Figure 2). The first digit following ‘PI-RADS’ was then evaluated. If the digit was ‘2’ and referred to the protocol version (e.g. PI-RADS 2.0 or 2.1), it was excluded. In cases where no digit was found nearby, the algorithm searched for text indicating a non-conclusive examination, which was also excluded. Mentions of ‘PI-RADS’ as part of the referring physician’s question were ignored. Valid PI-RADS scores were defined as single digits (1–5) or intervals (e.g. 1–2, 2–3, 3–4, 4–5), except for ‘3–5’, which was interpreted as ‘1–2’ if preceded by a negating statement. Otherwise, ‘3–5’ was disregarded, anticipating a more specific score later in the report. The highest valid PI-RADS score identified was selected.
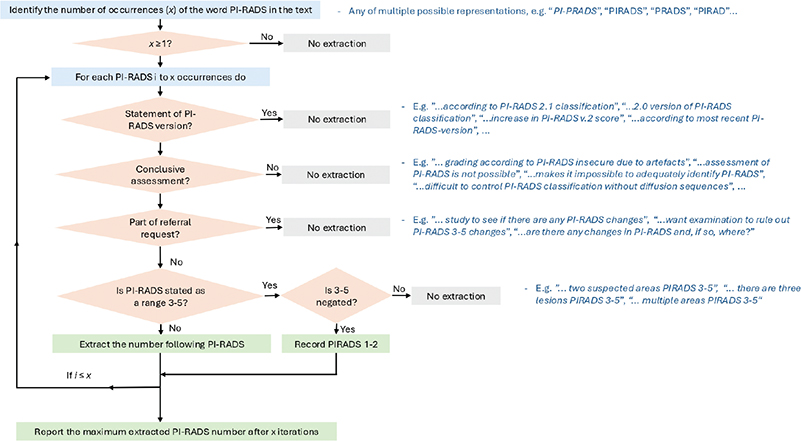
Figure 2. Flowchart of the algorithm for PI-RADS score extraction from free-text MRI reports
For extraction of prostate volume, the algorithm searched for volume units such as ‘cm³’, ‘ml’, ‘cc’, or their full-text equivalents (e.g. ‘cubic centimetre’, ‘millilitre’) (Supplementary Figure 2). Directly stated prostate volumes were extracted, excluding unrelated volumetric data (e.g. bladder or tumor volume, or values mentioned in the patient history). Volumes mentioned in the text from referring physician’s or those deemed implausible were excluded. When only prostate diameters were provided, volume was estimated using the ellipsoid formula.
Biopsy data in PCBase Xtend
Biopsy results were available in PCBase Xtend [10]. A prostate biopsy was considered negative if no Pca diagnosis was recorded in NPCR.
Statistical analysis
We compared the extracted PI-RADS and prostate volume with the corresponding data recorded in the NPCR for men diagnosed with Pca, and calculated Spearman’s correlation coefficient. We also assessed the time trend for the relation between PI-RADS and biopsy results. PI-RADS scores were categorized as 1–2, 3, 4, and 5. For each PI-RADS category, we estimated the proportion of men with prostate biopsy preformed within 180 days of the MRI by applying kernel smoothing based on calendar time. For positive prostate biopsies, the distribution of Gleason score was assessed. The analyses were stratified by PSA density, using a cutoff of 0.15 ng/ml/ml.
Results
Study population characteristics
According to our selection criteria, we identified 95,988 men without Pca and 108,361 MRI reports performed as a part of a diagnostic workup for suspected Pca 2015 – 2023. A total of 95% (102,713) of the MRIs were performed after 2016 (Table 1). Median age at MRI was 66 years with little change over time. The median PSA at the time of the MRI was 6.0 ng/mL, with a slight decrease over time, from 7.6 ng/ml in 2015–2016 to 5.8 ng/ml in 2022–2023.
| Year of MRI | All MRIs 2015–2023 (n = 108,361) | |||||||||
| 2015–2016 (n = 5,648) | 2017–2019 (n = 27,296) | 2020–2021 (n = 38,798) | 2022–2023 (n = 36,619) | |||||||
| Age (years) | ||||||||||
| Median (Q1–Q3) | 65.5 | (59.6–70.3) | 65.6 | (59.8–70.8) | 66.4 | (60.6–72.3) | 66.7 | (60.4–73.1) | 66.2 | (60.3–72.0) |
| Age groups, n (%) | ||||||||||
| ≤ 50 years | 219 | (3.9) | 886 | (3.2) | 1,107 | (2.9) | 946 | (2.6) | 3,158 | (2.9) |
| 50 – ≤ 60 years | 1,283 | (22.7) | 6,157 | (22.6) | 7,751 | (20.0) | 7,647 | (20.9) | 22,838 | (21.1) |
| 60 – ≤ 65 years | 1,198 | (21.2) | 5,895 | (21.6) | 7,961 | (20.5) | 6,989 | (19.1) | 22,043 | (20.3) |
| 65 – ≤ 70 years | 1,459 | (25.8) | 6,548 | (24.0) | 9,041 | (23.3) | 8,226 | (22.5) | 25,274 | (23.3) |
| 70 – ≤ 80 years | 1,387 | (24.6) | 7,285 | (26.7) | 11,542 | (29.7) | 11,101 | (30.3) | 31,315 | (28.9) |
| 80+ years | 102 | (1.8) | 525 | (1.9) | 1,396 | (3.6) | 1,710 | (4.7) | 3,733 | (3.4) |
| Extracted PI-RADS, n (%) | ||||||||||
| PI-RADS 1–2 | 578 | (10.2) | 5,419 | (19.9) | 10,533 | (27.1) | 12,372 | (33.8) | 28,902 | (26.7) |
| PI-RADS 3 | 593 | (10.5) | 5,805 | (21.3) | 9,513 | (24.5) | 8,023 | (21.9) | 23,934 | (22.1) |
| PI-RADS 4 | 580 | (10.3) | 4,664 | (17.1) | 6,235 | (16.1) | 5,520 | (15.1) | 16,999 | (15.7) |
| PI-RADS 5 | 423 | (7.5) | 2,663 | (9.8) | 4,658 | (12.0) | 4,542 | (12.4) | 12,286 | (11.3) |
| Missing | 3,474 | (61.5) | 8,745 | (32.0) | 7,859 | (20.3) | 6,162 | (16.8) | 26,240 | (24.2) |
| Prostate volume (ml) | ||||||||||
| Median (Q1-Q3) | 52.0 | (39.0–73.0) | 49.0 | (36.0–68.7) | 49.0 | (36.0–68.0) | 47.0 | (35.0–65.0) | 48.0 | (35.0–67.0) |
| Missing | 2,252 | (39.9) | 4,030 | (14.8) | 2,016 | (5.2) | 1,721 | (4.7) | 10,019 | (9.2) |
| Prostate volume n (%) | ||||||||||
| ≤ 30 ml | 462 | (13.6) | 3,421 | (14.7) | 5,542 | (15.1) | 5,877 | (16.8) | 15,302 | (15.6) |
| 30 – ≤ 50 ml | 1,182 | (34.8) | 8,963 | (38.5) | 14,127 | (38.4) | 13,947 | (40.0) | 38,219 | (38.9) |
| 50 – ≤ 80 ml | 1,117 | (32.9) | 7,170 | (30.8) | 11,493 | (31.2) | 10,271 | (29.4) | 30,051 | (30.6) |
| 80 – ≤ 100 ml | 304 | (9.0) | 1,902 | (8.2) | 2,875 | (7.8) | 2,466 | (7.1) | 7,547 | (7.7) |
| 100+ ml | 331 | (9.7) | 1,810 | (7.8) | 2,745 | (7.5) | 2,337 | (6.7) | 7,223 | (7.3) |
| Biopsy capture, n (%) * | ||||||||||
| Yes | 5,459 | (96.7) | 26,249 | (96.2) | 34,812 | (89.7) | 13,851 | (37.8) | 80,371 | (74.2) |
| No | 189 | (3.3) | 1,047 | (3.8) | 3,986 | (10.3) | 22,768 | (62.2) | 27,990 | (25.8) |
| Biopsy finding, n (%) | ||||||||||
| Pca | 1,001 | (17.7) | 5,561 | (20.4) | 10,373 | (26.7) | 10,961 | (29.9) | 27,896 | (25.7) |
| Negative biopsy | 1,438 | (25.5) | 5,593 | (20.5) | 5,497 | (14.2) | 1,674 | (4.6) | 14,202 | (13.1) |
| No biopsy | 3,052 | (54.0) | 15,285 | (56.0) | 19,998 | (51.5) | 7,989 | (21.8) | 46,324 | (42.7) |
| No biopsy data Available | 157 | (2.8) | 857 | (3.1) | 2,930 | (7.6) | 15,995 | (43.7) | 19,939 | (18.4) |
| PSA capture, n (%) * | ||||||||||
| Yes | 5,473 | (96.9) | 27,128 | (99.4) | 37,873 | (97.6) | 33,580 | (91.7) | 104,054 | (96.0) |
| No | 175 | (3.1) | 168 | (0.6) | 925 | (2.4) | 3,039 | (8.3) | 4,307 | (4.0) |
| PSA (ng/ml) | ||||||||||
| Median (Q1-Q3) | 7.6 | (5.0–12.0) | 6.1 | (4.1–9.2) | 5.8 | (4.0–8.8) | 5.8 | (4.0–8.8) | 6.0 | (4.0–9.1) |
| Missing data | 630 | (11.5) | 2,912 | (10.7) | 3,643 | (9.6) | 3,597 | (10.7) | 10,782 | (10.4) |
| PSA, n (%) | ||||||||||
| ≤ 3 (ng/ml) | 403 | (8.3) | 2,788 | (11.5) | 3,486 | (10.2) | 3,021 | (10.1) | 9,698 | (10.4) |
| 3 – ≤ 5 (ng/ml) | 829 | (17.1) | 6,303 | (26.0) | 10,039 | (29.3) | 9,027 | (30.1) | 26,198 | (28.1) |
| 5 – ≤ 7 (ng/ml) | 946 | (19.5) | 5,388 | (22.2) | 7,787 | (22.7) | 6,759 | (22.5) | 20,880 | (22.4) |
| 7 – 10 (ng/ml) | 1,088 | (22.5) | 4,782 | (19.7) | 6,495 | (19.0) | 5,498 | (18.3) | 17,863 | (19.2) |
| 10+ (ng/ml) | 1,577 | (32.6) | 4,955 | (20.5) | 6,423 | (18.8) | 5,678 | (18.9) | 18,633 | (20.0) |
| PSA density (ng/ml2) | ||||||||||
| Median (Q1-Q3) | 0.14 | (0.09–0.21) | 0.12 | (0.08–0.18) | 0.12 | (0.08–0.18) | 0.12 | (0.08–0.18) | 0.12 | (0.08–0.18) |
| Missing data | 2,669 | (47.3) | 6,213 | (22.8) | 5,712 | (14.7) | 8,071 | (22.0) | 22,665 | (20.9) |
| PSA density, n (%) | ||||||||||
| < 0.1 ng/ml2 | 893 | (30.0) | 7,957 | (37.7) | 12,865 | (38.9) | 10,595 | (37.1) | 32,310 | (37.7) |
| 0.1 – < 0.15 ng/ml2 | 765 | (25.7) | 5,862 | (27.8) | 9,022 | (27.3) | 7,903 | (27.7) | 23,552 | (27.5) |
| 0.15 – < 0.2 ng/ml2 | 492 | (16.5) | 3,245 | (15.4) | 4,812 | (14.5) | 4,215 | (14.8) | 12,764 | (14.9) |
| 0.2 – < 0.5 ng/ml2 | 676 | (22.7) | 3,471 | (16.5) | 5,291 | (16.0) | 4,695 | (16.4) | 14,133 | (16.5) |
| 0.5+ ng/ml2 | 153 | (5.1) | 548 | (2.6) | 1,096 | (3.3) | 1,140 | (4.0) | 2,937 | (3.4) |
| PSA: prostate specific antigen ; MRI: magnetic resonance imaging. *Availability of biopsy and PSA data. |
||||||||||
PI-RADS
The proportion in which a PI-RADS score could be identified in the narrative report increased over time, from 38% in 2015–2016 to 83% in 2022–2023 (Table 1). In men diagnosed with Pca there was a strong agreement between PI-RADS extracted from MRI reports and PI-RADS recorded in NPCR (correlation coefficient 0.94) (Figure 3).
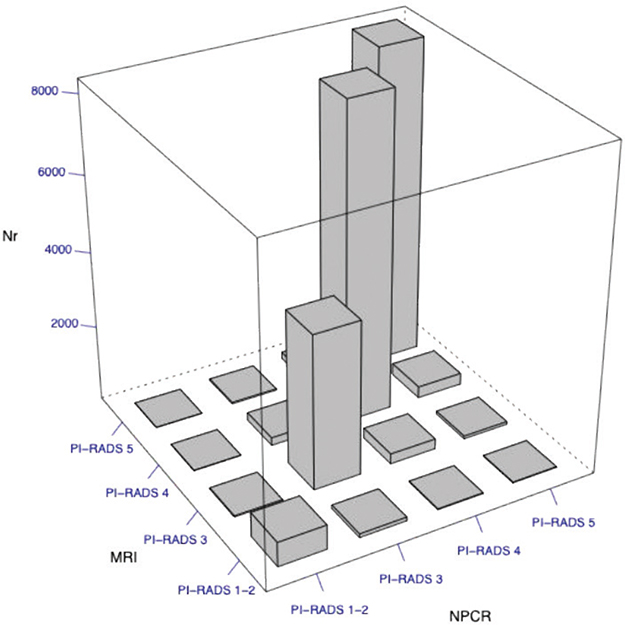
Figure 3. Correlation of PI-RADS score extracted from free-text MRI reports with those in the National Prostate Cancer Register of Sweden (NPCR)
Prostate volume
The proportion of MRI reports in which a prostate volume could be identified increased from 60 to 95% during the study period (Table 1). The median prostate volume was 48 mL, with a slight decrease over time, from 52 ml in 2015–2016 to 47 ml in 2022–2023 (Table 1). There was a high correlation with the volume recorded in NPCR (correlation coefficient 0.88) (Supplementary Figure 3).
PI-RADS in relation to biopsy, Gleason score, and PSA density
Approximately one third of the 21,312 MRI examinations eligible for comparison to biopsy results (Supplementary Figure 1) were followed by a prostate biopsy and with no apparent trend over time (Figure 4). Gleason score varied according to PI-RADS, PSA density, and calendar period (Figure 4). In men with a PI-RADS 3 lesion, the proportion who underwent prostate biopsy decreased over time, whereas in men with PI-RADS 5 the proportion who underwent prostate biopsy increased.
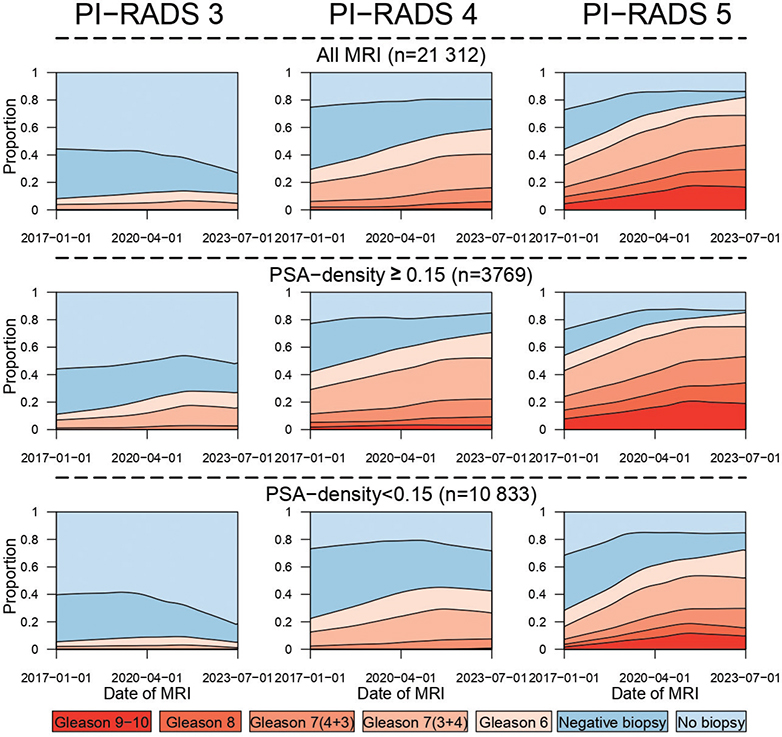
Figure 4. Prostate biopsy findings according to MRI PIRADS score, stratified by PSA density.
In parallel with decreasing trend for biopsies of PI-RADS 3 lesions, the proportion of men diagnosed with Pca increased in all PI-RADS strata. A two-fold increase was observed in PI-RADS 5 lesions, whereas it increased only marginally in PIRADS-3, especially in those with PSA density ≥ 0.15 ng/ml2. Almost all Pcas in men with PI-RADS 3 lesions were Gleason 6 or 7 (3+4). Gleason 9–10 was almost exclusively found in PI-RADS 5 lesions (Figure 4).
PSA values for calculation of PSA density were available for approximately 96% of MRI reports (Table 1). Among those, 65% had a PSA density < 0.15 ng/ml/ml and 35% a higher PSA density. For men with PSA density < 0.15 ng/ml/ml, there was a stronger decrease in the proportion of biopsied PI-RADS 3 lesions than in men with higher density. PSA density < 0.15 ng/ml was associated with higher proportion diagnosed with cancer within PI-RADS 4 and 5 lesions, with a two-fold increase in PI-RADS 5 with low PSA density versus 30% increase in PI-RADS 5 with low PSA density. In men with low PSA density diagnosed with Pca almost all PI-RADS 3 lesions were Gleason 6 cancers (Figure 4).
In men with PI-RADS 4 and 5 lesions, PSA density ≥ 0.15 ng/ml was associated with higher Gleason scores, compared to lower PSA density. The proportion with negative biopsies decreased consistently over time across all PI-RADS score strata, irrespective of PSA density.
Discussion
A summary of main results and evolving use of MRI in Sweden
In this population-based study in PCBase Xtend with data on MRI, PSA and prostate biopsy from all men in Sweden we were able to extract structured, clinically relevant data from 108,361 free-text prostate MRI reports by use of a rule-based language processing algorithm. Extracted PI-RADS scores and prostate volumes were very similar to those manually registered in NPCR. We observed an increased use of MRI during the study period and in parallel an increase in the proportion of men with PI-RADS 5 who underwent biopsy and a decrease in the proportion of men with PI-RADS 3 who underwent biopsy. These changes were particularly strong in men with low PSA density, which correlates to the recommendations in the Swedish National Pca guidelines [15].
Previous studies and interpretation of findings
In a recent study, similar feasibility was demonstrated with large-scale processing of heterogeneous clinical free text in 155,000 prostate MRI and biopsy reports from U.S. Veterans Affairs [18]. The validation indicated that a rule-based text mining algorithm was able to extract relevant data.
Several studies have previously supported the clinical utility of PI-RADS and MRI overall in predicting clinically relevant Pca at biopsy, monitoring men on active surveillance, and identifying adverse pathological features prior to radical prostatectomy [3, 10–14]. However, these studies were small (< 1,000 men) compared to our study. With our large population-based longitudinal sample we were able to observe time trends.
There were large changes in the distribution of PI-RADS and biopsy rates during the study period. We hypothesize that the increase in radiologists’ expertise in reading and reporting MRI, improved technical quality of MRI imaging, as well as an increasing familiarity of urologists with MRI were the main factors driving the decrease in the number of biopsies performed for PI-RADS 3 lesions and the increase in the proportion of positive biopsies for PI-RADS 5 [4]. The latter biopsies were positive for clinically significant cancer in around 70% of cases in 2023, in line with the literature [19].
Our results also show the incremental use of PSA density as a risk stratification tool for PI-RADS 3 lesions [20–22]. The increase from 2020 coincides with the introduction of such recommendations in both the Swedish and European guidelines. The number of biopsied PI-RADS 3 lesions in our study population dropped markedly from 2020 onwards in cases with PSA density ≤ 0.15, whereas there was an increase of the proportion with positive biopsy in men with PSA density > 0.15.
A recent multi-institutional study reported substantial variability in the assignment of PI-RADS scores (particularly PI-RADS 4–5) between centers, which influenced Pca detection rates, as well as how radiologists’ experience influences PI-RADS assignment [6, 7, 23–25]. In one study the specificity of PI-RADS for clinically significant Pca was merely 64% when assessment was made by radiologists with little experience but 84% for experienced radiologists [24]. The time trends in our study are likely partly explained by an overall increased experience in the reporting and interpretation of MRI results.
Strengths and limitations
This study has several strengths. It is based on a nationwide and population-based collection of data from healthcare IT systems, including nearly all prostate MRIs performed in Sweden during the studied time frame. Our study allows for assessment of the change in use of MRI, capturing the evolution of clinical practice, with an increasing uptake and improved performance and interpretation of MRI reports. The integration of imaging data with PSA, prostate biopsies, and other data provides a resource for understanding the impact of MRI in Pca diagnosis.
Some limitations should be acknowledged. The lower concordance between prostate volume derived from MRI reports and that recorded in the NPCR, compared with PI-RADS scores, is likely due to the fact that prostate volume in the NPCR is estimated using transrectal ultrasound. The MRI reports were not standardized and reflect substantial variability in reporting style, terminology, and level of detail across institutions and over time. Although we developed and applied a rigorous extraction algorithm, the assessment of PI-RADS scores and prostate volumes was based on reports, not on a direct image review. Additionally, there were differences in MRI hardware, scanning protocols, radiology information system, and radiologist expertise. This large variability in performance is inherent in routine clinical data from many health care providers. The structured reporting templates for MRI, biopsies and pathology, with direct transfer of data into NPCR, created by the diagnostic working group within NPCR, will hopefully facilitate quality assessments and research [26].
Conclusions
Clinically relevant data can be extracted from unstructured free-text MRI reports by use of a systematic algorithm approach. We found an increased use of MRI during the study period, along with changes indicating an increased quality in the MRI reports. This approach to free text reports can be used to incorporate data on MRI prostate, an increasingly important investigation, in large epidemiological studies.
Disclaimer
Rolf Gedeborg is employed by the Medical Products Agency (MPA) in Sweden. The MPA is a Swedish Government Agency. The views expressed in this article may not represent the views of the MPA.
References
- [1] Stabile A, Mazzone E, Cirulli GO, et al: Association Between Multiparametric Magnetic Resonance Imaging of the Prostate and Oncological Outcomes after Primary Treatment for Prostate Cancer: A Systematic Review and Meta-analysis. Eur. Urol. Oncol. 2021; 4: 519–528. https://doi.org/10.1016/j.euo.2020.11.008
- [2] Ahmed HU, El-Shater Bosaily A, Brown LC, et al: Diagnostic accuracy of multi-parametric MRI and TRUS biopsy in prostate cancer (PROMIS): a paired validating confirmatory study. Lancet 2017; 389: 815–822. https://doi.org/10.1016/S0140-6736(16)32401-1
- [3] Kasivisvanathan V, Rannikko AS, Borghi M, et al: MRI-Targeted or Standard Biopsy for Prostate-Cancer Diagnosis. N. Engl. J. Med. 2018; 378: 1767–1777. https://doi.org/10.1056/NEJMoa1801993
- [4] Giganti F, Rosenkrantz AB, Villeirs G, et al: The Evolution of MRI of the Prostate: The Past, the Present, and the Future. AJR Am. J. Roentgenol. 2019; 213: 384–396. https://doi.org/10.2214/AJR.18.20796
- [5] Stabile A, Giganti F, Kasivisvanathan V, et al: Factors Influencing Variability in the Performance of Multiparametric Magnetic Resonance Imaging in Detecting Clinically Significant Prostate Cancer: A Systematic Literature Review. Eur. Urol. Oncol. 2020; 3: 145–167. https://doi.org/10.1016/j.euo.2020.02.005
- [6] Nalavenkata SB, Vertosick E, Briganti A, et al: Variation in Prostate Magnetic Resonance Imaging Performance: Data from the Prostate Biopsy Collaborative Group. Eur. Urol. Oncol. 2026; 9(1):156-163. https://doi.org/10.1016/j.euo.2025.02.007
- [7] Pickersgill NA, Vetter JM, Andriole GL, et al: Accuracy and Variability of Prostate Multiparametric Magnetic Resonance Imaging Interpretation Using the Prostate Imaging Reporting and Data System: A Blinded Comparison of Radiologists. Eur. Urol. Focus 2020; 6: 267–272. https://doi.org/10.1016/j.euf.2018.10.008
- [8] Barentsz JO, Weinreb JC, Verma S, et al: Synopsis of the PI-RADS v2 Guidelines for Multiparametric Prostate Magnetic Resonance Imaging and Recommendations for Use. Eur. Urol. 2016; 69: 41–49. https://doi.org/10.1016/j.eururo.2015.08.038
- [9] Turkbey B, Rosenkrantz AB, Haider MA, et al: Prostate Imaging Reporting and Data System Version 2.1: 2019 Update of Prostate Imaging Reporting and Data System Version 2. Eur. Urol. 2019; 76: 340–351. https://doi.org/10.1016/j.eururo.2019.02.033
- [10] Westerberg M, Holm L, Garmo H, et al: Cohort Profile Update: The National Prostate Cancer Register of Sweden and PCBase. Int. J. Epidemiol. 2025; 54. https://doi.org/10.1093/ije/dyaf172
- [11] Ventimiglia E, Gedeborg R, Orrason AW, et al: A comparison of comorbidity indices and estimates of life expectancy for men with prostate cancer. Scand. J. Urol. 2025; 60: 105–107. https://doi.org/10.2340/sju.v60.43810
- [12] Orrason AW, Scilipoti P, Garmo H, et al: Improved adherence to prostate cancer guidelines concomitant with public reporting. Nationwide population-based study. Scand. J. Urol. 2025; 60: 50–58. https://doi.org/10.2340/sju.v60.43107
- [13] Thomsen FF, Garmo H, Egevad L, et al: Temporal trend in risk of prostate cancer death in men with favourable-risk prostate cancer. Scand. J. Urol. 2024; 59: 76–83. https://doi.org/10.2340/sju.v59.34015
- [14] Maljkovic J, Bill-Axelson A, Hållberg H, et al: Time trends for the use of active surveillance and deferred treatment for localised prostate cancer in Sweden: a nationwide study. Scand. J. Urol. 2024; 59: 200–206. https://doi.org/10.2340/sju.v59.40123
- [15] Stranne J: 2023/2024 update of the national prostate cancer guidelines in Sweden. Scand. J. Urol. 2024; 59: 210–211. https://doi.org/10.2340/sju.v59.42656
- [16] Cazzaniga W, Ventimiglia E, Alfano M, et al: Mini Review on the Use of Clinical Cancer Registers for Prostate Cancer: The National Prostate Cancer Register (NPCR) of Sweden. Front. Med. (Lausanne). 2019; 6: 51. https://doi.org/10.3389/fmed.2019.00051
- [17] Weinreb JC, Barentsz JO, Choyke PL, et al: PI-RADS Prostate Imaging - Reporting and Data System: 2015, Version 2. Eur. Urol. 2016; 69: 16–40. https://doi.org/10.1016/j.eururo.2015.08.052
- [18] Culnan JM, Goryachev SD, Bihn JR, et al: Automated Extraction of Imaging and Pathology Data From Diverse Prostate Cancer Electronic Records. JCO Clin. Cancer Inform. 2025; 9: e2500085. https://doi.org/10.1200/CCI-25-00085
- [19] Mazzone E, Stabile A, Pellegrino F, et al: Positive Predictive Value of Prostate Imaging Reporting and Data System Version 2 for the Detection of Clinically Significant Prostate Cancer: A Systematic Review and Meta-analysis. Eur. Urol. Oncol. 2021; 4: 697–713. https://doi.org/10.1016/j.euo.2020.12.004
- [20] Mottet N, van den Bergh RCN, Briers E, et al: EAU-EANM-ESTRO-ESUR-SIOG Guidelines on Prostate Cancer-2020 Update. Part 1: Screening, Diagnosis, and Local Treatment with Curative Intent. Eur. Urol. 2021; 79: 243–262. https://doi.org/10.1016/j.eururo.2020.09.042
- [21] Björnebo L, Discacciati A, Abbadi A, et al: Prostate-specific Antigen Density as a Selection Tool Before Magnetic Resonance Imaging in Prostate Cancer Screening: An Analysis from the STHLM3MRI Randomized Clinical Trial. Eur. Urol. Focus 2025. https://doi.org/10.1016/j.euf.2025.06.008
- [22] Pellegrino F, Stabile A, Sorce G, et al: Added Value of Prostate-specific Antigen Density in Selecting Prostate Biopsy Candidates Among Men with Elevated Prostate-specific Antigen and PI-RADS ≥3 Lesions on Multiparametric Magnetic Resonance Imaging of the Prostate: A Systematic Assessment by PI-RADS Score. Eur. Urol. Focus 2024; 10: 634–640. https://doi.org/10.1016/j.euf.2023.10.006
- [23] Rosenkrantz AB, Ayoola A, Hoffman D, et al: The Learning Curve in Prostate MRI Interpretation: Self-Directed Learning Versus Continual Reader Feedback. AJR Am. J. Roentgenol. 2017; 208: W92–W100. https://doi.org/10.2214/AJR.16.16876
- [24] Greer MD, Shih JH, Lay N, et al: Interreader Variability of Prostate Imaging Reporting and Data System Version 2 in Detecting and Assessing Prostate Cancer Lesions at Prostate MRI. AJR Am. J. Roentgenol. 2019; 212: 1197–1205. https://doi.org/10.2214/AJR.18.20536
- [25] Hansen NL, Koo BC, Gallagher FA, et al: Comparison of initial and tertiary centre second opinion reads of multiparametric magnetic resonance imaging of the prostate prior to repeat biopsy. Eur. Radiol. 2017; 27: 2259–2266. https://doi.org/10.1007/s00330-016-4635-5
- [26] Thimansson E, Axén E, Jäderling F, et al: A novel approach to integrated prostate cancer diagnostics: insights from MRI, prostate biopsy, and pathology reports in a pilot study. BJU Int. 2025; 135: 245–248. https://doi.org/10.1111/bju.16582