ORIGINAL RESEARCH ARTICLE
Long-term effects of testosterone therapy on prostate volume and LUTS in hypogonadal men: a retrospective study
Peter Ströberga,b  , Ramin Ghaffarpourc , Börje Ljungbergc and Johan Svenssond
aUrohälsan i Skövde, Skövde, Sweden; bDepartment of Urology Region Jönköpings län, Jönkoping, Sweden; cDepartment of Diagnostics and Intervention, Urology and Andrology, Umeå University, Umeå, Sweden; dDepartment of Statistics, Umeå School of Business, Economics and Statistics, Umeå University, Umeå, Sweden
ABSTRACT
Introduction: Up to 20% of aging men have low serum testosterone (late-onset hypogonadism [LOH]), and approximately 80% develop benign prostatic enlargement (BPE) with increasing age. Both age and prostate size are linked to lower urinary tract symptoms (LUTS). This study aimed to evaluate the effect of testosterone replacement therapy (TRT) on prostate volume and LUTS in men with LOH.
Materials and methods: From 2004 to 2017, 511 men underwent annual checkups including physical examination, transrectal ultrasound, bladder scanning, serum Prostate-Specific Antigen (s-PSA), and serum testosterone and questionnaires on LUTS and LOH symptoms. None had prior treatments affecting prostate size or LUTS at baseline. During the annual follow-ups, 167 men (33%) were diagnosed with symptomatic LOH and received TRT. A longitudinal statistical model was used to compare periods with and without treatment regarding prostate growth, post-void residual urine, IPSS (International Prostate Symptom Score), quality of life (QoL), and s-PSA.
Results: Participants contributed 3745 visits (median 7 per man), including 904 (24%) after testosterone initiation. TRT was associated with a mean increase in prostate growth rate of 0.22 mL/year compared with untreated periods (p = 0.023). No significant differences were observed in LUTS, QoL, or s-PSA between treated and untreated periods
Conclusion: In ageing males with late-onset hypogonadism, testosterone replacement therapy was linked to a small but statistically significant increase in prostate growth rate without measurable effects on urinary symptoms.
KEYWORDS: testosterone treatment; late onset hypogonadism; prostate volume; lower urinary tract symptoms
Citation: Scandinavian Journal of Urology 2026, VOL. 61, 86–91. https://doi.org/10.2340/sju.v61.45576.
Copyright: © 2026 The Author(s). Published by MJS Publishing on behalf of Acta Chirurgica Scandinavica. This is an Open Access article distributed under the terms of the Creative Commons Attribution 4.0 International License (http://creativecommons.org/licenses/by/4.0/), allowing third parties to copy and redistribute the material in any medium or format and to remix, transform, and build upon the material, with the condition of proper attribution to the original work.
Received: 15 May 2025; Accepted: 03 February 2026; Published: 27 March 2026
CONTACT: Börje Ljungberg borje.ljungberg@umu.se Department of Diagnostics and Intervention, Urology and Andrology, Umeå University, Umeå, Sweden
Competing interests and funding: All authors declare no competing interests.
Introduction
Symptomatic low testosterone levels occur in up to 20% of men over the age of 60 years. This condition is often referred to as late-onset hypogonadism (LOH) [1]. Symptomatic low testosterone is less common in aging men than lower urinary tract symptoms (LUTS) and benign prostatic enlargement (BPE) [2–5]. Although LUTS and BPE are common in elderly men, they usually cause only mild to moderate problems, and prostate size correlates strongly with LUTS [5, 6]. However, not all men with BPE experience LUTS. The prevalence of BPE without LUTS in the general population is poorly defined because these men typically do not seek medical care [7].
Serum testosterone (s‑testosterone) has a marked effect on prostate size: castrated patients experience substantial reductions in prostate volume over time, a phenomenon described as early as 1893 by Professor Ramm in Sweden and later reported in JAMA as a treatment for severe BPE [8, 9]. Longitudinal, population-based studies show that prostate volume increases with time across all ethnic categories [3]. Differences in growth rates and absolute volumes between ethnical categories suggest a genetic component to BPE development, which may explain why some men never develop prostate enlargement while others develop markedly large glands. Most aging men fall between these extremes, implying that multiple factors contribute to prostate growth with age [7]. The relationships among s‑testosterone levels, BPE, and LUTS during normal aging remain diversely, as do links between other aging-related conditions in men [10–12]. Studies of men receiving testosterone replacement therapy (TRT) report contradictory findings regarding its effects on prostate size and LUTS over time [13–21].
The aim of this longitudinal study was to evaluate the effects of TRT over time by comparing clinical parameters such as prostate volume growth rate, LUTS and s-Prostate-Specific Antigen (s-PSA) during periods with and without TRT.
Materials and methods
From 2004, all men attending a single outpatient urology clinic in Sweden (Urohälsan, Skövde, Skaraborg County) were offered an annual male health check. Each visit recorded: date of visit, age, reason for visit, LUTS using International Prostate Symptom Score (IPSS) and Quality of Life questionnaires (QoL), erectile function without medication using IIEF-5 and EHS (International Index of Erectile Function‑5 short version and Erectile Hardness Score), screening for LOH using the Androgen Deficiency in Ageing Males (ADAM) questionnaire [22, 23], urine assessment with a urine dipstick (Multi‑Stix5™, assessing blood, leukocytes, glucose, protein, and nitrite), known and prior urological conditions, previous and concurrent medical conditions including ongoing LUTS-related treatments, digital rectal examination (DRE), post‑void residual urine volume in mL (PVRU) measured with BladderScan™, prostate volume (mL) measured by transrectal ultrasound (TRUS) (2004–2006 with BK‑Merlin™ biplane device; after 2006 with BK‑Falcon™ biplane device). Furthermore, s‑PSA, PSA density, s‑testosterone, erectile dysfunction treatments if any, testosterone supplementation (if any, with specifics), assessment of diagnosis at the visit, actions taken, and new medical conditions since the previous visits were collected at each annual visit. All visits and examinations during the observation period were performed at a single center by one urologist. Other data such as erectile dysfunction factors were not analyzed in the present study.
A total of 805 patients had a male check-up at the clinic between 2004 and 2017. Of these, 123 patients (15%), already had treatments or procedures likely to affect prostate size or s‑PSA when they attended the clinic (finasteride, dutasteride, or prostate interventions) and were not included in the study. The data from the remaining 682 patients were analyzed. During follow up, subjects were removed from further registration if they started treatments likely to affect prostate size or symptoms (finasteride, dutasteride, alpha‑receptor blockers, medical treatment for overactive bladder, or prostate interventions) or if they were diagnosed with prostate cancer. Additional patients with fewer than three annual visits were excluded. The final dataset comprises 511 patients (Figure 1).
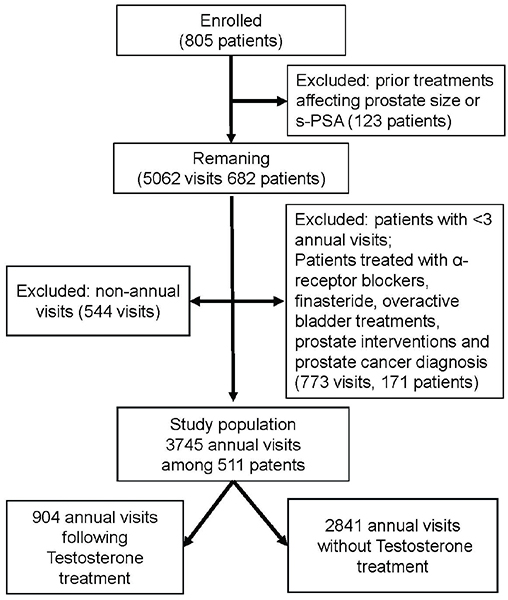
Figure 1. Flowchart illustrating the inclusion and exclusion of study participants.
The presence of a possible testosterone deficiency was defined, following EAU sexual and reproductive health guidelines [24], as serum testosterone < 12 nmol/L combined with a positive ADAM questionnaire at any annual visit. To confirm or to rule out a symptomatic testosterone deficiency, additional two fasting morning s‑testosterone measurements (between 08:00 and 10:00) were done. If s‑testosterone was < 8 nmol/L on these tests, additional measurements of serum LH, serum FSH, and serum prolactin were performed. If these were within the normal range, LOH was considered present. Abnormal results prompted referral to the Department of Endocrinology at Skaraborg County Hospital for further evaluation. Patients with s‑testosterone between 8 and 12 nmol/L on the two tests were classified as in the grey zone. All patients with two follow‑up s‑testosterone measurements < 12 nmol/L were counseled and initiated on testosterone gel therapy. At all follow-up and annual visits, the Aging Males’ Symptoms Scale (AMS) [25] was used as an outcome measure for androgen deficiency treatment. All treated patients started Tostrex® transdermal gel 60 mg daily. After 4 weeks, s‑testosterone was measured 2 hours after application and the dose adjusted as needed. The treatment target was 18–25 nmol/L. A first follow‑up occurred at 3 months to assess s‑testosterone, s‑PSA, hemoglobin, hematocrit, AMS, adverse effects, and need for further dose adjustment.
Patients in the grey zone who achieved adequate s‑testosterone levels but showed no AMS improvement were considered not to have symptomatic testosterone deficiency, and their treatment was discontinued. Remaining patients were followed every 4 months during the first year with the same assessments and then annually if stable. Subjects were switched to intramuscular injections (Nebido® 1000 mg/4 mL every 8–14 weeks) only if they experienced intolerable gel side effects (mainly skin reactions) or had poor compliance with gel therapy. All patients, both treated (after dose titration) and untreated, were thereafter followed at annual visits as described.
The study population does not represent two fixed groups (treated vs untreated). Apart from patients who never received treatment or who received continuous treatment throughout the study, individual patients could change status (nontreated to treated and vice versa) and thereby serve as their own controls. Thus, the registered data primarily reflect changes between annual visits rather than per‑subject fixed group assignment. Reasons for discontinuing TRT during follow‑up included intolerable side effects, poor compliance or misuse, patient request, normalization of s-testosterone levels after substantial weight loss (i.e. successful bariatric surgery) or resolution of hypoxia after sleep apnea treatment.
Patients with s‑PSA elevation above age‑related normal levels were referred to the Department of Urology, Skaraborg County Hospital for further evaluation according to contemporaneous national recommendations (for example, age‑related pathological s‑PSA levels or a palpable prostate mass). All data were collected retrospectively from medical records into an anonymized database.
Ethics
The study was approved by the Regional Ethical Review Board in Umeå (Dnr 2018/293‑31).
Statistics
A generalized estimating equation (GEE) model with a compound symmetry correlation structure was used to account for repeated annual measurements within individuals. All model responses were treated as interval variables with an identity link. Outcomes included yearly increases in prostate volume (mL) measured by TRUS and changes in PVRU, IPSS, s‑PSA, and QoL scores. Yearly changes in prostate volume and PVRU were defined as the difference between consecutive measurements divided by the time interval between visits; these differences exist from the second visit onward. Delayed annual visits produced longer intervals between measurements for some patients.
The main explanatory variable, testosterone treatment, was defined for a visit as ‘on treatment’ if treatment had started before that annual visit and ‘not on treatment’ if no treatment had been given since the previous annual visit. Results were adjusted for age and baseline prostate volume. Residual analysis indicated nonlinearity between most responses and the covariates; therefore, age and prostate volume were categorized as shown in Table 1. Missing values were few (Table 1) and were excluded from inferential analyses using case-wise deletion. No imputation methods were applied. As a primary sensitivity analysis, differences between gel-based and injection- based testosterone treatments were assessed by modeling testosterone treatment as a three-level categorical variable (no treatment, gel treatment, injection treatment).
| Variables | First visit, among 511 patients | Annual visits without testosterone treatment (n = 2841) | Annual visits following prior testosterone treatment (n = 904) | Number of missing observations of the total visits (n = 3745) |
| Responses | Median (Q1–Q3) | Median (Q1–Q3) | Median (Q1–Q3) | n (%) |
| IPSS (score) | 4 (2 to 9) | 5 (2 to 9) | 5 (2 to 9) | 158 (4.2) |
| PSA (µg/L) | 1.0 (0.5 to 1.8) | 1.1 (0.6 to 2.1) | 1.1 (0.6 to 2.2) | 5 (0.1) |
| QoL (Score) | 1 (0 to 2) | 1 (0 to 2) | 1 (0 to 2) | 167 (4.5) |
| PVRU (mL) | 0 (0 to 21) | 0 (0 to 20) | 0 (0 to 22) | 259 (6.9) |
| PVRU yearly change (mL) | N/A* | 0.0 (-2.6 to 5.9) | 0.0 (0.0 to 8.4) | 260 (8.0)** |
| Prostate volume yearly increase (mL) | N/A* | 0.5(-0.9 to 2.2) | 0.9(-0.9 to 3.3) | 86 (2.7)** |
| Adjusting variables | n (%) | n (%) | n (%) | n (%) |
| Age (years) | 0 (0.0) | |||
| 30–45 | 33 (6.5) | 75 (2.6) | 25 (2.8) | |
| 45–60 | 265 (51.9) | 987 (34.7) | 318 (35.2) | |
| 60–75 | 203 (39.7) | 1595 (56.1) | 527 (58.3) | |
| 75+ | 10 (2.0) | 184 (6.5) | 34 (3.8) | |
| Prostate volume (mL) | 85 (2.3) | |||
| 0–30 | 241 (47.9) | 1090 (39.1) | 295 (33.8) | |
| 30–45 | 202 (40.2) | 1161 (41.7) | 331 (37.9) | |
| 45–60 | 45 (8.9) | 400 (14.4) | 163 (18.6) | |
| 60–80 | 14 (2.8) | 111 (4.0) | 73 (8.4) | |
| 80+ | 1 (0.2) | 24 (0.9) | 12 (1.4) | |
| Prostate volume assessed by Trans Rectal Ultrasound of prostate. IPSS: International Prostate Symptom Score; PSA: Prostatic Specific Antigen; QoL: Quality of Life score; PVRU: post-void residual urine volume in mL. *As the variable is based on two consecutive measurements, it is undefined at the initial visit. **Baseline visits are excluded from the assessment of missingness. |
||||
In a secondary sensitivity analysis, untreated patients with high testosterone levels at their first visit were excluded to better reflect a population consisting only of individuals eligible for testosterone treatment. All parameter estimates from the GEE model are presented with 95% two‑sided confidence intervals, and a 5% significance level was used. Analyses were performed using IBM SPSS Statistics for Windows, Version 30.0 (IBM Corp., Armonk, NY).
Results
After exclusions, 511 patients remained, contributing 3745 annual visits as shown in Figure 1. Visits per patient ranged from 3 to 14 (median 7; interquartile range 5–10). Mean baseline serum testosterone was 16.2 nmol/L (SD 6.1) for untreated subjects and 8.0 nmol/L (SD 3.1) for patients at the visit just before the TRT was started. Further baseline characteristics are detailed in Table 1. Of the 511 patients, 167 (33%) received TRT during the observation period, including 25 (5%) who were treated at baseline. All patients who initiated TRT after baseline began with transdermal gel (Tostrex®). In total, there were 904 (24%) visits following TRT and 2841 (76%) visits without prior testosterone treatment. Of the 904 treated visits, 695 (77%) involved gel-based testosterone and 209 (23%) involved injections.
The cohort’s mean annual prostate volume increase was 1.05 mL (95% CI 0.95–1.15). Visits without prior TRT were associated with an annual prostate growth rate of 0.94 mL (95% CI: 0.82–1.06). Visits following TRT were associated with a higher annual growth rate of 1.34 mL (95% CI: 1.12–1.57). The unadjusted difference between these was 0.40 mL (95% CI: 0.15–0.66; p = 0.002), and after adjustment for age and prostate volume, the difference was 0.22 mL (95% CI: 0.03–0.41; p = 0.023) Results for IPSS, s‑PSA, QoL, and prostate volume growth rate are presented in Table 2. Age group and prostate volume were significantly associated with all outcomes except yearly change in PVRU.
| Response | Unadjusted analysis | Adjusted analysis* | ||
| Coef (95% CI) | P-value | Coef (95% CI) | P-value | |
| Prostate volume yearly increase (mL) | 0.40 (0.15 to 0.66) | 0.002 | 0.22 (0.03 to 0.41) | 0.023 |
| IPSS (score) | 0.24 (–0.23 to 0.70) | 0.290 | –0.24 (–0.65 to 0.18) | 0.259 |
| PSA (µg/L) | 0.17 (–0.10 to 0.43) | 0.217 | –0.10 (–0.36 to 0.15) | 0.430 |
| QoL (score) | 0.02 (–0.09 to 0.14) | 0.693 | –0.05 (–0.17 to 0.06) | 0.371 |
| PVRU (mL) | 1.80 (–1.26 to 4.86) | 0.250 | 0.77 (–2.27 to 3.80) | 0.620 |
| PVRU yearly change (mL) | 0.13 (–1.71 to 1.96) | 0.892 | 0.17 (–1.67 to 2.00) | 0.858 |
| The coefficients estimate the mean population-level difference in response between periods following testosterone treatment and periods without treatment. Coef: regression coefficients; Prostate volume assed by Trans Rectal Ultrasound; IPSS: International Prostate Symptom Score; PSA: Prostatic Specific Antigen; QoL: Quality of Life score; PVRU: Post-Void Residual Urine volume. Significant p-values are given in bold. *The analyses were adjusted for age groups and prostate volume groups as categorical variables, defined in Table 1. |
||||
During visits with TRT, the mean s‑testosterone was 18.6 nmol/L (SD 9.2), compared with 15.0 nmol/L (SD 6.7) at nontreatment visits. Among treated patients, the mean individual increase in s‑testosterone was 8.5 nmol/L. No differences were found between gel and injection routes for the analyzed outcomes. A sensitivity analysis excluding untreated patients with baseline s‑testosterone > 12 nmol/L produced similar results (Table 3). Even though we did not analyze factors related to erectile dysfunction, we noted that a large proportion of the individuals (335, 66%) used erectile dysfunction medication at least once during the study period.
| Response | Unadjusted analysis | Adjusted analysis* | ||
| Coef (95% CI) | P-value | Coef (95% CI) | P-value | |
| Prostate volume yearly increase (mL) | 0.51 (0.22 to 0.81) | <0.001 | 0.27 (0.04 to 0.50) | 0.021 |
| IPSS (score) | 0.25 (–0.22 to 0.71) | 0.298 | –0.36 (–0.78 to 0.07) | 0.104 |
| PSA (µg/L) | 0.28 (0.02 to 0.54) | 0.034 | –0.03 (–0.30 to 0.24) | 0.840 |
| QoL (score) | 0.03 (–0.09 to 0.15) | 0.648 | –0.05 (–0.17 to 0.07) | 0.417 |
| PVRU (mL) | 2.03 (–1.34 to 5.40) | 0.239 | 1.07 (–2.30 to 4.44) | 0.535 |
| PVRU yearly change (mL) | –0.24 (–3.86 to 3.38) | 0.897 | –0.26 (–3.56 to 3.05) | 0.879 |
| In this sensitivity analysis, 248 patients with a serum testosterone level above 12 nmol/L at their first visit and who did not receive TRT were excluded. The coefficients estimate the mean population-level difference in response between periods following TRT and periods without TRT. Coef: regression coefficients; Prostate volume assed by Trans Rectal Ultrasound; IPSS: International Prostate Symptom Score; PSA: Prostate-Specific Antigen; QoL: Quality of Life score; PVRU: Post-Void Residual Urine volume. *The analyses were adjusted for age groups and prostate volume groups as categorical variables, defined in Table 1. Significant p-values are given in bold. |
||||
Forty-nine patients were referred for further evaluation due to an increase in s-PSA into an age-related pathological range. Of these, 15 were diagnosed with prostate cancer. Among the 167 patients who had received TRT, six (4%) cases of prostate cancer were identified, compared to nine (3%) among the 344 patients who had not received TRT.
Discussion
In our retrospective observational study, visits following TRT were associated with a statistically significant increase in prostate growth rate compared to visits without prior TRT.
Despite this increase, there was no corresponding rise in LUTS or PVRU. One plausible explanation is that the observed increase in prostate growth rate, although statistically significant, may be too modest to exert a meaningful clinical impact on LUTS.
The prostate volume increase of approximately 10 mL per decade in our cohort is notably higher than that reported in the Olmsted County study (5 mL) [5]. This discrepancy may be attributed to differences in population characteristics, methodology, or ethnical composition. Our findings align with some previous studies [18, 19] suggesting that TRT may stimulate increase of prostate volume. A possible explanation could be the observation put forward by Banjeree et al. [26] that some epithelial prostate cells are androgen deprived and might increase in size on TRT, while other cells are not and will remain unaffected. However, literature on this topic remains inconsistent. Some studies report increased prostate volume and s-PSA levels without improvements in voiding symptoms or QoL, while others show improvements in IPSS, reduced PVRU, and QoL [13–19]. Notably, randomized clinical trials have not demonstrated significant differences in these parameters between treated and untreated groups [20, 21].
Emerging evidence also suggests that TRT may influence bladder wall physiology. For example, Yassin et al. [19, 27] observed improvements in bladder wall thickness, PVRU, AMS, IIEF-EF, IPSS, and obesity parameters in elderly hypogonadal men undergoing TRT. These benefits reversed upon cessation of therapy, except for unchanged s-PSA and prostate volume. Importantly, none of the referenced studies, including ours, have analyzed the individual domains of the IPSS. This leaves open the possibility that TRT may improve irritative symptoms (e.g. urgency, frequency) while worsening obstructive symptoms (e.g. weak stream, incomplete emptying), resulting in a net neutral effect on the total IPSS. The incidence of patients (33%) with symptomatic low s-testosterone in our study was higher than that reported by Harman et al. (20%) [5], likely due to differences in study populations, for example, a substantial proportion of our patients presented with concomitant erectile dysfunction, which may have influenced the prevalence.
Prostate cancer incidence was low in both treated and untreated groups, but the limited sample size and follow-up duration preclude definitive conclusions. Larger randomized trials have shown no significant differences in prostate cancer risk or related events between TRT and placebo groups although s-PSA levels tended to rise more in treated men [21]. These findings support the notion that, with appropriate screening and monitoring, TRT poses a low risk of adverse prostate outcomes [28]. Current prostate cancer guidelines do not contraindicate testosterone substitution in hypogonadal men [29], further supporting its safety when clinically indicated.
The study is limited by its retrospective design and further limited by the fact that we did not account for possible long‑term residual effects of TRT, which could have affected the assessed responses, beyond 1 year after the final treatment. The strength of the study lies in the consistency of data collection: all visits and examinations were conducted by the same urologist at a single center using standardized equipment. Additionally, the longitudinal data structure, where the same patients are followed over several years and contribute both treated and untreated visits, allows individuals to partially serve as their own controls, thereby strengthening the robustness of the analysis. This enhances the reliability of our longitudinal observations.
Conclusion
In ageing males with late-onset hypogonadism, testosterone replacement therapy was linked to a small but statistically significant increase in prostate growth rate without measurable effects on urinary symptoms.
Acknowledgements
None.
References
[1] Harman SM, Metter EJ, Tobin JD, et al. Longitudinal effects of aging on serum total and free testosterone levels in healthy men. Baltimore Longitudinal Study of Aging. J Clin Endocrinol Metab. 2001;86(2):724–731. https://doi.org/10.1210/jcem.86.2.7219
[2] Fitzpatrick JM. The natural history of benign prostatic hyperplasia. BJU Int. 2006;97(Suppl 2):3–6; discussion 21–22. https://doi.org/10.1111/j.1464-410X.2006.06097.x
[3] Lieber MM, Rhodes T, Jacobson DJ, et al. Natural history of benign prostatic enlargement: long-term longitudinal population-based study of prostate volume doubling times. BJU Int. 2010;105(2): 214–219. https://doi.org/10.1111/j.1464-410X.2009.08719.x
[4] Jacobsen SJ, Girman CJ, Lieber MM. Natural history of benign prostatic hyperplasia. Urology. 2001;58(6 Suppl. 1):5–16; discussion 16. https://doi.org/10.1016/s0090-4295(01)01298-5
[5] Sarma AV, Jacobson DJ, McGree ME, et al. A population-based study of incidence and treatment of benign prostatic hyperplasia among residents of Olmsted County, Minnesota: 1987 to 1997. J Urol. 2005;173(6):2048–2053. https://doi.org/10.1097/01.ju.0000158443.13918.d6
[6] Jacobsen SJ, Jacobson DJ, Girman CJ, et al. Treatment for benign prostatic hyperplasia among community dwelling men: the Olmsted County study of urinary symptoms and health status. J Urol. 1999;162(4):1301–1306. https://doi.org/10.1016/S0022-5347(05)68271-7
[7] Egan KB. The epidemiology of benign prostatic hyperplasia associated with lower urinary tract symptoms: prevalence and incident rates. Urol Clin North Am. 2016;43(3):289–297. https://doi.org/10.1016/j.ucl.2016.04.001
[8] Castration as a remedy for enlarged prostate. JAMA. 1894;XXIII(20):766767. https://doi.org/10.1001/jama.1894.02421250028006
[9] Axcrona K, Aaltomaa S, da Silva CM, et al. Androgen deprivation therapy for volume reduction, lower urinary tract symptom relief and quality of life improvement in patients with prostate cancer: degarelix vs goserelin plus bicalutamide. BJU Int. 2012;110(11):1721–1728. https://doi.org/10.1111/j.1464-410X.2012.11107.x
[10] Lee JH, Kim Y, Park YW, et al. Relationship between benign prostatic hyperplasia/lower urinary tract symptoms and total serum testosterone level in healthy middle-aged eugonadal men. J Sex Med. 2014;11(5):1309–1315. https://doi.org/10.1111/jsm.12489
[11] Roberts RO, Jacobson DJ, Rhodes T, et al. Serum sex hormones and measures of benign prostatic hyperplasia. Prostate. 2004;61(2):124–131. https://doi.org/10.1002/pros.20080
[12] Park YW, Kim SB, Kwon H, et al. The relationship between lower urinary tract symptoms/benign prostatic hyperplasia and the number of components of metabolic syndrome. Urology. 2013;82(3):674–679. https://doi.org/10.1016/j.urology.2013.03.047
[13] Kathrins M, Doersch K, Nimeh T, et al. The relationship between testosterone-replacement therapy and lower urinary tract symptoms: a systematic review. Urology. 2016;88:22–32. https://doi.org/10.1016/j.urology.2015.11.006
[14] Fendereski K, Horns JJ, Dehghanbanadaki H, et al. The impact of testosterone therapy on benign prostatic hyperplasia in hypogonadal males. Urology. 2025;196:325–332. https://doi.org/10.1016/j.urology.2024.11.006
[15] Pearl JA, Berhanu D, François N, et al. Testosterone supplementation does not worsen lower urinary tract symptoms. J Urol. 2013;190(5):1828–1833. https://doi.org/10.1016/j.juro.2013.05.111
[16] Debruyne FM, Behre HM, Roehrborn CG, et al. RHYME Investigators. Testosterone treatment is not associated with increased risk of prostate cancer or worsening of lower urinary tract symptoms: prostate health outcomes in the Registry of Hypogonadism in Men. BJU Int. 2017;119(2):216–224. https://doi.org/10.1111/bju.13578
[17] Kohn TP, Mata DA, Ramasamy R, et al. Effects of testosterone replacement therapy on lower urinary tract symptoms: a systematic review and meta-analysis. Eur Urol. 2016;69(6):1083–1090. https://doi.org/10.1016/j.eururo.2016.01.043
[18] Holmäng S, Mårin P, Lindstedt G, et al. Effect of long-term oral testosterone undecanoate treatment on prostate volume and serum prostate-specific antigen concentration in eugonadal middle-aged men. Prostate. 1993;23(2):99–106. https://doi.org/10.1002/pros.2990230203
[19] Yassin A, Alwani M, Al-Zoubi RM, et al. Voiding function improves under long-term testosterone treatment (TTh) in hypogonadal men, independent of prostate size. Int Urol Nephrol. 2023;55(7):1649–1658. https://doi.org/10.1007/s11255-023-03602-4
[20] Idan A, Griffiths KA, Harwood DT, et al. Long-term effects of dihydrotestosterone treatment on prostate growth in healthy, middle-aged men without prostate disease: a randomized, placebo-controlled trial. Ann Intern Med. 2010;153(10):621–632. https://doi.org/10.7326/0003-4819-153-10-201011160-00004
[21] Bhasin S, Travison TG, Pencina KM, et al. Prostate safety events during testosterone replacement therapy in men with hypogonadism: a randomized clinical trial. JAMA Netw Open. 2023;6(12):e2348692. https://doi.org/10.1001/jamanetworkopen.2023.48692
[22] Mohamed O, Freundlich RE, Dakik HK, et al. The quantitative ADAM questionnaire: a new tool in quantifying the severity of hypogonadism. Int J Impot Res. 2010;22(1):20–24. https://doi.org/10.1038/ijir.2009.35
[23] Morley JE, Charlton E, Patrick P, et al. Validation of a screening questionnaire for androgen deficiency in aging males. Metabolism. 2000;49(9):1239–1242. https://doi.org/10.1053/meta.2000.8625
[24] Salonia A, Capogrosso P, Boeri L, et al. European Association of Urology guidelines on male sexual and reproductive health: 2025 update on male hypogonadism, erectile dysfunction, premature ejaculation, and Peyronie’s disease. Eur Urol. 2025;88(1):76–102. https://doi.org/10.1016/j.eururo.2025.04.010
[25] Moore C, Huebler D, Zimmermann T, et al. The Aging Males’ Symptoms scale (AMS) as outcome measure for treatment of androgen deficiency. Eur Urol. 2004;46(1):80–87. https://doi.org/10.1016/j.eururo.2004.01.009
[26] Banerjee PP, Banerjee S, Brown T, et al. Androgen action in prostate function and disease. Am J Clin Exp Urol. 2018;6(2):62–77.
[27] Tek M, Balli E, Cimen B, et al. The effect of testosterone replacement therapy on bladder functions and histology in orchiectomized mature male rats. Urology. 2010;75(4):886–890. https://doi.org/10.1016/j.urology.2009.08.016
[28] Bhasin S, Thompson IM. Prostate risk and monitoring during testosterone replacement therapy. J Clin Endocrinol Metab. 2024;109(8):1975–1983. https://doi.org/10.1210/clinem/dgae334
[29] Stranne J. 2023/2024 update of the national prostate cancer guidelines in Sweden. Scand J Urol. 2024;59:210–211. https://doi.org/10.2340/sju.v59.42656