REVIEW ARTICLE
Molecular Organization of the Skin Barrier
Departments of 1Medicine, 2Cell and Molecular Biology, and 3Dermatology Clinic, Karolinska University Hospital, Stockholm, Sweden
Cryo-electron microscopy of vitreous sections allows for investigation directly in situ of the molecular architecture of skin. Recently, this technique has contributed to the elucidation of the molecular organization of the skin’s permeability barrier and its stepwise formation process. The aim of this review is to provide an overview of the procedure for cryo-electron microscopy of vitreous sections, its analysis using atomic detail molecular dynamics modelling and electron microscopy simulation, and its application in the investigation of the barrier structure and formation process of the skin.
Key words: cryo-electron microscopy; molecular organization; permeability barrier.
SIGNIFICANCE
This review presents the structure, function and formation of the human skin barrier based on high-resolution cryo-electron microscopy. This knowledge can be used to control the barrier function of the skin at the atomic level via computer simulation, enabling drug-transport to and through skin to be calculated and optimized, and barrier deficiency in skin disease to be predicted and investigated on the molecular level.
Citation: Acta Derm Venereol 2023; 103: adv13356. DOI https://doi.org/10.2340/actadv.v103.13356.
Copyright: © Published by Medical Journals Sweden, on behalf of the Society for Publication of Acta Dermato-Venereologica. This is an Open Access article distributed under the terms of the Creative Commons Attribution-NonCommercial 4.0 International License (https://creativecommons.org/licenses/by-nc/4.0/)
Accepted: Oct 19, 2023; Published: Nov 21, 2023
Corr: Lars Norlén, Department of Cellular and Molecular Biology (CMB), Karolinska Institutet, Biomedicum, SE-171 77 Stockholm, Sweden. E-mail: lars.norlen@ki.se
Competing interests and funding: The author has no conflict of interest to declare.
INTRODUCTION
This invited review presents an update on the molecular organization of the skin’s barrier structure as evidenced by high-resolution cryo-electron microscopy (cryo-EM). Study of the skin’s permeability barrier dates back to the mid-19th century. Interested readers are referred to a number of ground-breaking papers (1–14) and reviews (15–23). Cryo-EM of vitreous sections (CEMOVIS) allows for investigation with molecular resolution of skin tissue in near-native conditions (24–28). If combined with molecular model building subject to molecular dynamics (MD) simulation and electron microscopy (EM) simulation (29–32), CEMOVIS can be used for determination directly in situ of the skin’s barrier structure (29).
CRYO-ELECTRON MICROSCOPY OF VITREOUS SECTIONS AND ITS ANALYSIS USING ATOMIC DETAIL MOLECULAR DYNAMICS MODELLING AND ELECTRON MICROSCOPY SIMULATION
In CEMOVIS, the native tissue is preserved down to the molecular level, and the micrograph pixel intensity is directly related to the local electron density of the specimen (33–36). Biomolecules generally possess small intermolecular and intramolecular differences in electron density, as they are essentially composed of atoms with similar atomic weight (carbon, nitrogen, and oxygen). However, for orderly arranged molecular assemblies, such as lipid tails and headgroups in membranes, even small differences in shape and atomic composition may be amplified because of interference effects that appear in the image phase contrast. During cryo-EM image acquisition, phase contrast is made visible using defocus (cf. 37).
The CEMOVIS procedure comprises the following steps: skin tissue samples, approximately 1×1 mm2 and approximately 100–150 µm thick, are collected directly from living donors using a scalpel (Fig. 1a). The samples are vitrified using a high-pressure freezer (Fig. 1b), then cryosectioned at –140°C with a diamond blade (Fig. 1c), transferred to a pre-cooled cryo-EM copper grid (Fig. 1d) and mounted in a cryo-sample holder (Fig. 1e) inserted into a cryo-electron microscope (Fig. 1f). Now, a series of high resolution cryo-electron micrographs may be collected at different microscope defocus levels (Fig. 2).
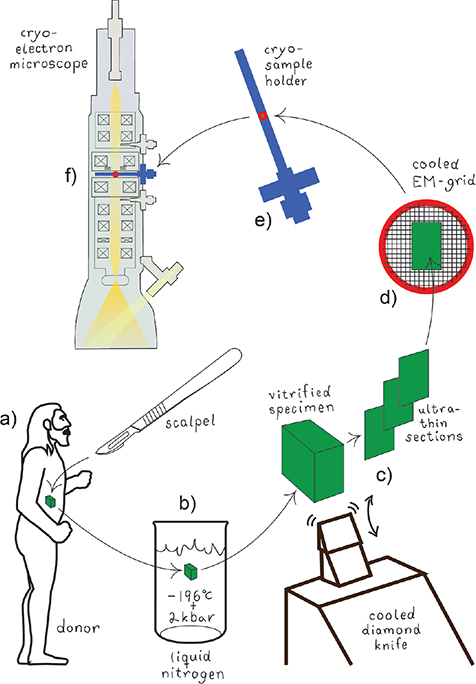
Fig. 1. Specimen collection, vitrification, sectioning, and mounting for cryo-electron microscopy of vitreous sections (CEMOVIS). (a) A biological specimen is collected in vivo by surgical excision. (b) The specimen is vitrified by fast immersion in liquid nitrogen under pressure (2 kbar). (c) The vitrified specimen is cut with a diamond knife at cryo-conditions (–140°C) into ultrathin (30-nm) sections. (d) The cryo-sections are transferred to a cryo-EM grid, which is mounted in (e) a cryo-EM sample holder that in turn is inserted into (f) the cryo-electron microscope.
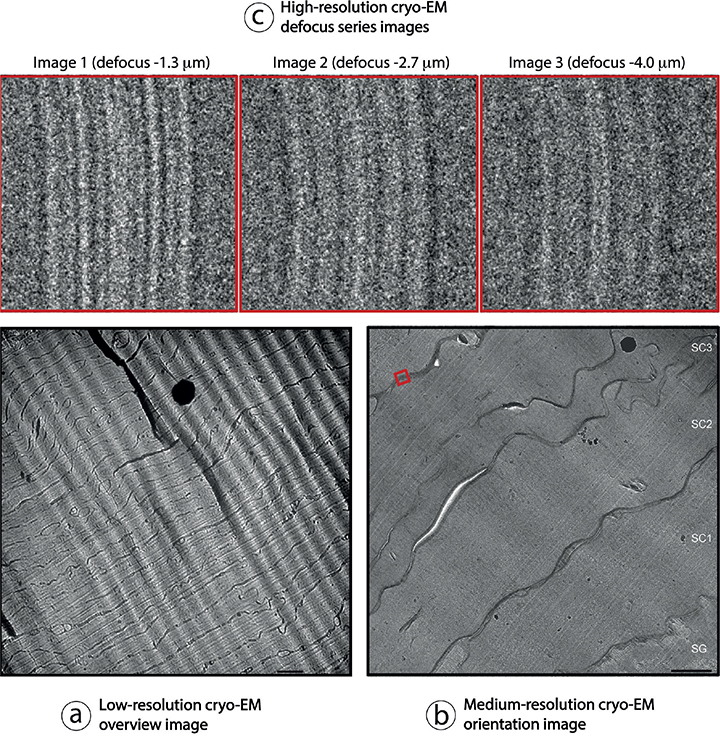
Fig. 2. Collection of a cryo-electron microscopy of vitreous sections (CEMOVIS) defocus image series. (a) Initially, a low-resolution overview image is collected at approximately 1000–5000 times magnification, followed by (b) a medium-resolution orientation image collected at approximately 5000–30,000 times magnification, to select the specimen location (for example red square in (b)) where (c) a high-resolution defocus image series can be collected at approximately 80,000–115,000 times magnification. Electron-dense (black) spots in (a) and (b) correspond to surface ice contamination. Wave-like diagonal patterns in (a) and (b) are due to section compression during cutting. Scale bars in (a) 1.0 μm and in (b) 500 nm. Pixel-size in (c) is 0.188 nm. SG and SC1-3 in (b): stratum granulosum and stratum corneum layer 1–3, respectively. Adapted from Norlén and Al-Amoudi 2004 (25) (a, b) and Iwai et al., 2012 (27) (c), with permission.
In the analysis of cellular high-resolution cryo-EM images, atomic-detail molecular models subject to MD simulation are employed, followed by EM simulation. The image analysis procedure comprised the following 3 steps: (i) construction of candidate molecular models (Fig. 3), (ii) generation of simulated electron micrographs based on these models (Fig. 4), and, finally, (iii) comparison of the observed cryo-electron micrographs with the simulated ones (Fig. 5) (27, 29–30, 32). MD simulations may be run in GROMACS (38–39) and EM simulations may be run in TEM simulator (40) (freely available at: http://tem-simulator.sourceforge.net).
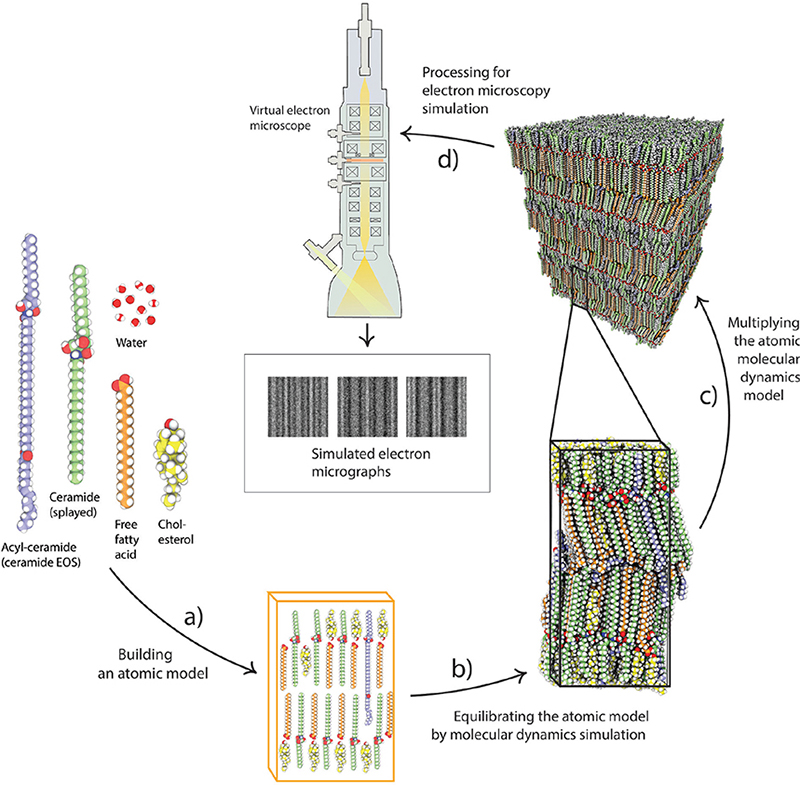
Fig. 3. Molecular model building subject to molecular dynamics (MD) simulation. (a) Building an atomic model based on a known molecular composition. (b) The atomic model is equilibrated by MD simulation, and then (c) multiplied in 3 dimensions, before processing for (d) electron microscopy (EM) simulation.
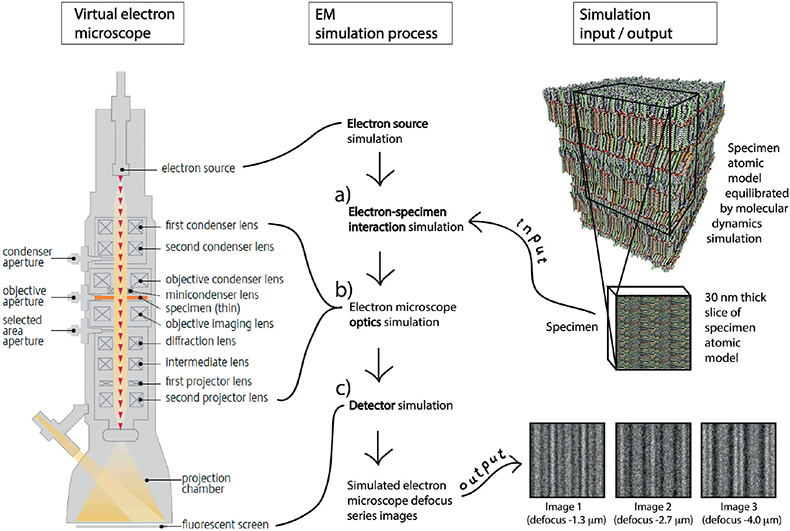
Fig. 4. Electron microscopy (EM) simulation. Simulated cryo-electron microscopy of vitreous sections (CEMOVIS) defocus series images for candidate atomic models are created with a computer program simulating (a) the interaction between the candidate atomic model’s electron scattering potential map and the microscope’s electron beam, (b) the optical transformation effect of the microscope’s lens system, and (c) the image formation on the microscope’s detector.
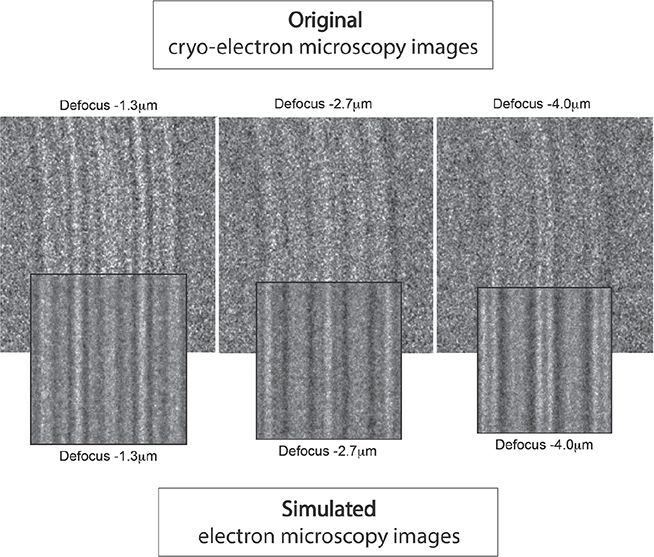
Fig. 5. Comparison between simulated and original electron micrographs. The simulated electron micrographs are compared with the original cryo-electron micrographs at different microscope defocus levels. If differences are identified, the atomic model is updated, and the simulation renewed. This process is repeated until optimal correspondence is attained between simulated and original electron micrographs.
The main difference between cryo-EM micrographs and conventional EM micrographs is that in cryo-EM the image contrast is essentially represented by phase contrast derived directly from the skin’s bio atoms, while in conventional EM image contrast is essentially represented by amplitude contrast derived not from the skin’s bio atoms but from heavy metal stain deposited on dehydrated and plastic-embedded skin sections.
The main limitations of CEMOVIS are that it requires tissue vitrification through ultrafast freezing, which is only possible in samples with a maximum thickness of approximately 200 μm, and that CEMOVIS, compared with conventional EM, is very costly and time consuming and requires very high cryo-sectioning- and cryo-EM image acquisition skills. The main advantage of CEMOVIS is that it is the only method that allows for acquisition of structural data with molecular resolution directly in a near-native biological tissue.
CRYO-ELECTRON MICROSCOPY PATTERNS OF THE SKIN’S BARRIER STRUCTURE AND ITS FORMATION PROCESS
Human skin represents a barrier between the body and the environment. It upholds homeostasis by preventing water loss from the body, and protects the body by preventing permeation of exogenous substances. The skin’s major physical barrier consists of a lipid structure positioned extracellularly in the stratum corneum, the topmost cornified layer of epidermis (Figs 6 and 7).
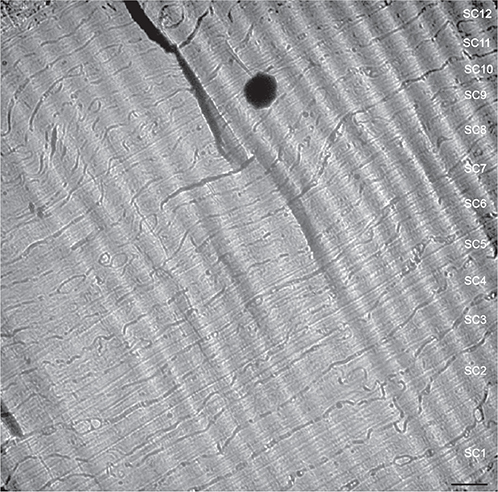
Fig. 6. Cryo-electron micrograph overview of human stratum corneum. Note the approximately homogeneous corneocyte density, size, and form throughout the stratum corneum, except for the lowermost corneocytes that are generally thicker (lower right corner). Electron-dense spot (black) corresponds to surface ice contamination. Wave-like diagonal pattern in the upper right corner is due to section compression during cutting. SC1-12: stratum corneum cell 1–12. Scale bar: 1.0 μm. Adapted from Norlén and Al-Amoudi 2004 (25), with permission.
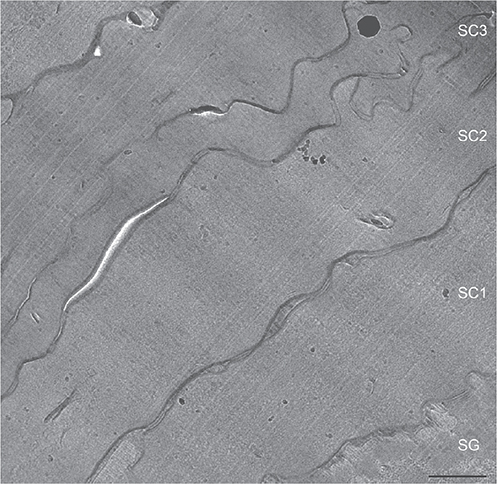
Fig. 7. Cryo-electron micrographs of lowermost stratum corneum. SG: stratum granulosum cell. SC1-3: stratum corneum cell 1–3. Scale bar 500 nm. Adapted from Norlén and Al-Amoudi 2004 (25), with permission.
The formation of the skin’s barrier takes place during the final stage of the epidermal differentiation process. Barrier formation is initiated in the viable upper epidermal cell layer, the stratum granulosum (Fig. 8). The barrier lipids are synthesized in the endoplasmic reticulum and the Golgi apparatus. They are subsequently secreted into the tubuloreticular (lamellar body) membrane system of the stratum granulosum cells (Fig. 9, white stars) (41, 28, 48). Finally, the lipids are discharged into the intercellular space separating the stratum granulosum and the stratum corneum (Fig. 9, white dotted line). In cryo-electron micrographs, the barrier lipids appear as a partly granular (green stars) and partly lamellar (blue stars) material inside the tubuloreticular (lamellar body) membrane system (Fig. 10). The secreted lipids then transform, in several steps, into stacked sheets in the intercellular space between the lowermost stratum corneum cells (brown, pink and yellow stars in Figs 11 and 12). This process is completed at the 3rd to 5th cornified cell layer, and the stacked sheets are then observed in their mature form throughout the stratum corneum (Fig. 12, yellow stars).
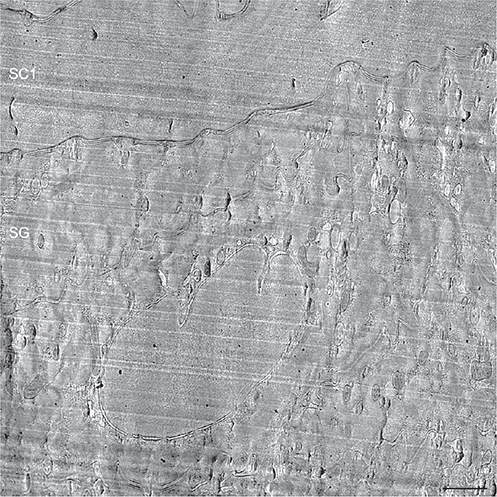
Fig. 8. Cryo-electron micrograph overview of the interface between viable and cornified cell layers. SG: stratum granulosum cell. SC1: first stratum corneum cell. Scale bar: 500 nm. Adapted from Al-Amoudi et al., 2005 (35), with permission.
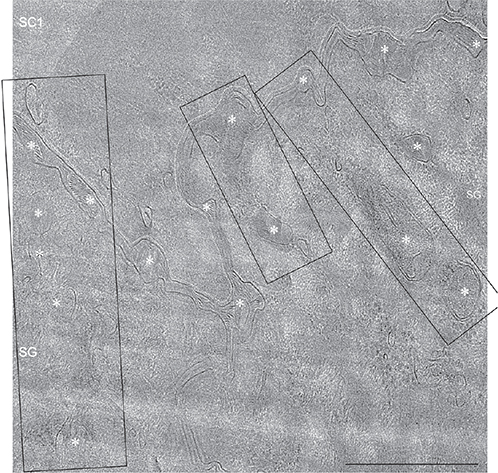
Fig. 9. Cryo-electron micrograph of the tubuloreticular (lamellar body) system at the interface between viable and cornified epidermis. Multiple apparent active sites of skin barrier formation (black boxes) corresponding to the tubuloreticular system (lamellar bodies) (white asterisk), can be seen. White dotted line marks the interface between viable and cornified epidermis. SC: stratum corneum; SG: stratum granulosum. Scale bar: 500 nm. Adapted from den Hollander et al., 2016 (28), with permission.
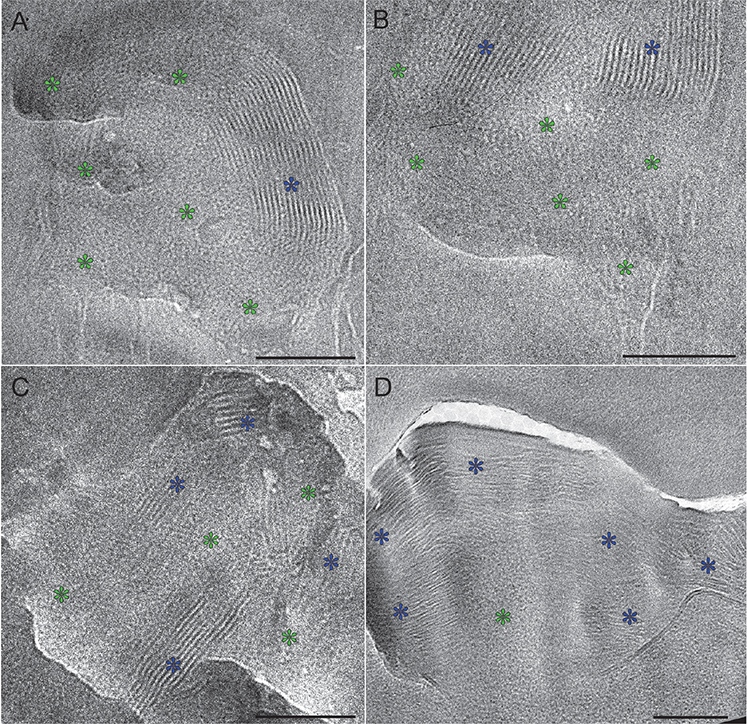
Fig. 10. Cryo-electron micrographs of lamellar bodies located at the interface between stratum granulosum and stratum corneum. Note that the locally ordered granular regions (green stars) are closely associated with the broad-lamellar regions (blue stars), seemingly integrating without a clear interface. A–B represents lamellar bodies located within the cytoplasm of the topmost stratum granulosum cell and C–D represent lamellar bodies located intercellularly between the topmost stratum granulosum cell and the lowermost stratum corneum cell. Green stars: locally ordered granular pattern. Blue stars: symmetrical broad-lamellar pattern with 50–55 Å periodicity. Scale bars: 100 nm. Adapted from Narangifard et al., 2018 (30), with permission.
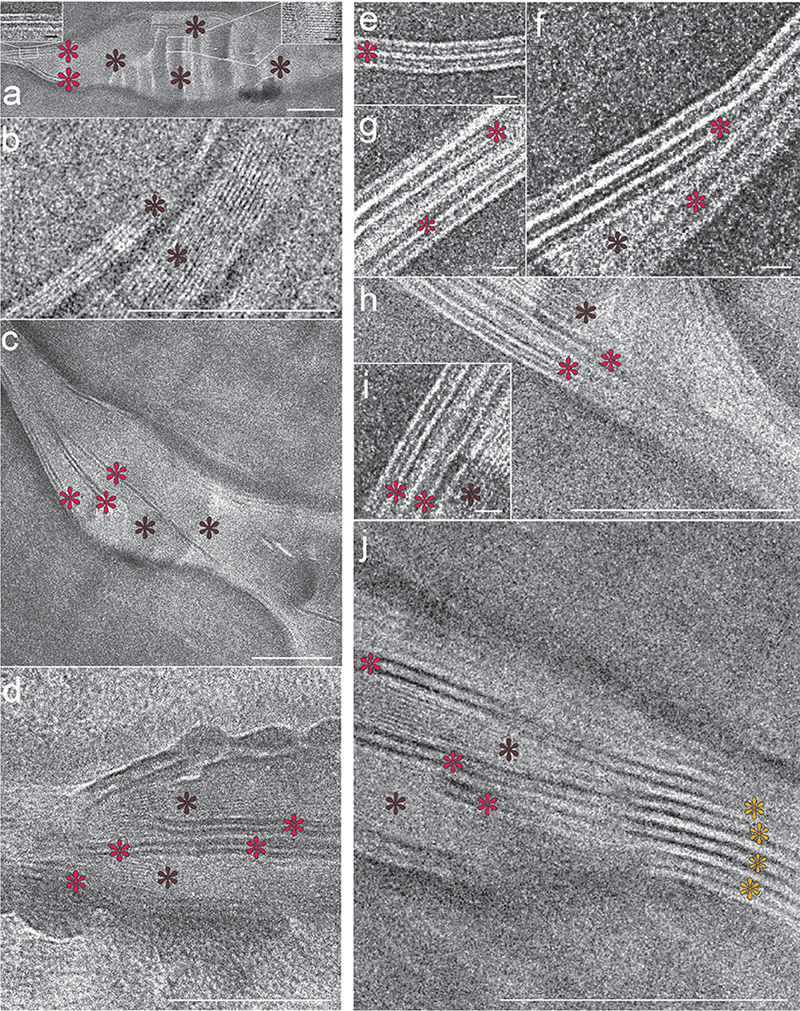
Fig. 11. Cryo-electron micrographs of the intercellular space of the lowermost (1st–4th cell layers) stratum corneum. Note that the single-band pattern with 2.0–2.5 nm periodicity (dark-brown stars) occupies the intercellular space completely, seemingly embedding the 2-band pattern with 5.5–6.0 nm periodicity (red stars) that starts to appear pairwise peripherally and centrally (a–h). Occasionally, stacks of the 2-band pattern with 11.0–12.0 nm periodicity (yellow stars in (j)) could also be detected in association with the single-band pattern with 2.0–2.5 nm periodicity (dark-brown stars in (j)) and the 2-band pattern with 5.5–6.0 nm periodicity (red stars in (j)). Right inset in (a): Enlargement of the single-band pattern with 2.0–2.5 nm periodicity; Left inset in (a): Enlargement of the 2-band pattern with 5.5–6.0 nm periodicity. Scale bars (a–d, h, j): 100 nm; Scale bars (left and right insets in (a, e–g, i): 10 nm. Adapted from Narangifard et al., 2021 (32), with permission.

Fig. 12. Cryo-electron micrographs of the 2-band pattern with 11.0–12.0 nm periodicity representing the mature skin barrier lipid structure. (a–f) Cryo-electron micrographs of the intercellular space of the midpart (above the 5th cell layer) stratum corneum. Yellow stars: 2-band pattern with 11.0–12.0 nm periodicity. Section thicknesses (a–f): 30–50 nm; Scale bars (a–b) 50 nm, (c–f) 25 nm. Adapted from Narangifard et al., 2021 (32), with permission.
BARRIER FORMATION
A schematic view of skin and the interface between the stratum granulosum and stratum corneum, where barrier formation takes place, is shown in Fig. 13.
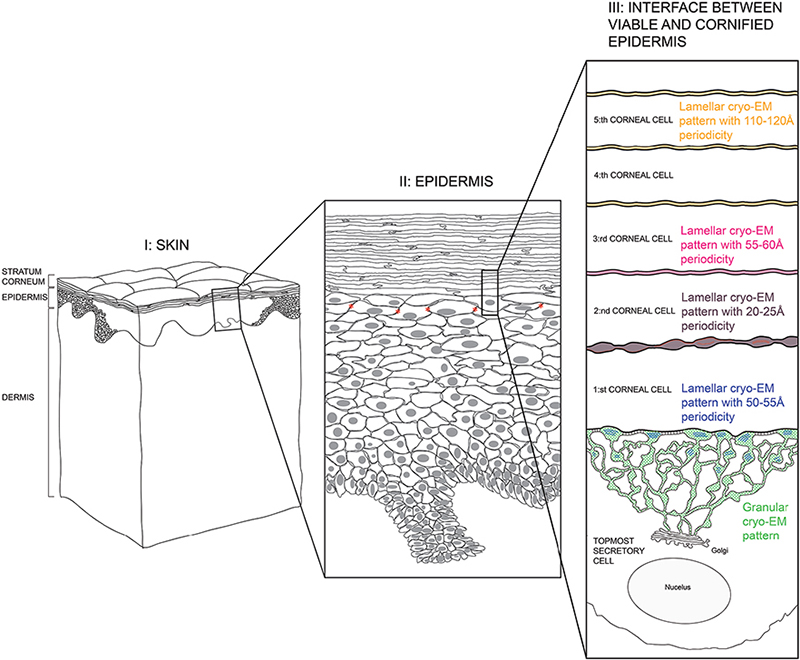
Fig. 13. Schematic view of skin. Left column (I): full-thickness skin; Mid column (II): epidermis; Right column (III): interface between viable and cornified epidermis. Green and blue areas: tubolureticular (lamellar body) network of a secretory (stratum granulosum) cell; Dark-brown area: intercellular space between first and second corneal (stratum corneum) cells; Pink area: intercellular space between second and third corneal cells; Yellow area: intercellular spaces above the third corneal cell. Desmosomes connecting the secretory cell to the first corneal cell are indicated by transverse striations (section III, black). Tight junctions in the stratum granulosum cell periphery are indicated by stars (section II, red). Adapted from Norlén et al., 2022 (42), with permission.
High-resolution cryo-electron microscopy patterns of the barrier formation process
During its formation, the skin’s barrier structure undergoes 5 apparent maturation stages represented by 5 different cryo-EM patterns (Fig. 14): a granular pattern (Fig. 14a: inside the tuboloreticular (lamellar body) system of topmost stratum granulosum cell) (30); a lamellar pattern with 50–55 Å periodicity (Fig. 14b: between topmost stratum granulosum cell and first stratum corneum cell) (30); a lamellar pattern with 20–25 Å periodicity (Fig. 14c: between first and second stratum corneum cells) (32); a lamellar pattern with 55–60 Å periodicity (Fig. 14d: between second and third stratum corneum cells) (32); and a lamellar pattern with 110–120 Å periodicity (Fig. 14e: between third and higher stratum corneum cells) (27, 29, 32, 42).
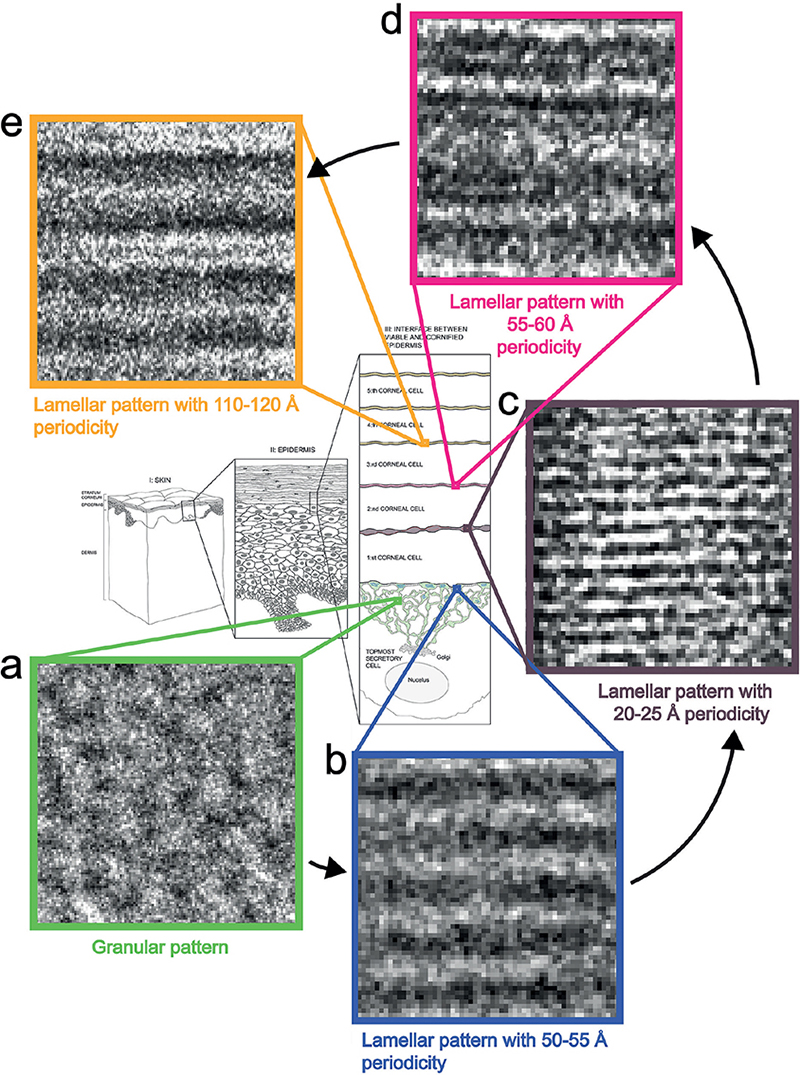
Fig. 14. Cryo-electron microscopy (cryo-EM) patterns of the barrier formation process. (a) Granular cryo-EM pattern of the tubolureticular (lamellar body) network of secretory (stratum granulosum) cell (green); (b) lamellar cryo-EM pattern with 50–55 Å periodicity of the tubolureticular network of secretory cell (blue); (c) lamellar cryo-EM pattern with 20–25 Å periodicity of the intercellular space between first and second corneal (stratum corneum) cells (dark-brown); (d) lamellar cryo-EM pattern with 55–60 Å periodicity of the intercellular space between second and third corneal cells (pink); (e) lamellar cryo-EM pattern with 110–120 Å periodicity of the intercellular spaces above the third corneal cell (yellow). Adapted from Norlén et al., 2022 (42), with permission.
The 5 stages identified in the barrier formation process
MD modelling and EM simulation-based analysis of the 5 cryo-EM patterns (Fig. 15) suggests that the granular pattern represents a highly folded and highly hydrated conventional skin lipid bilayer (Fig. 15a; green) (30), that the lamellar pattern with 50–55 Å periodicity represents a stacked skin lipid monolayer with mixed hairpin and splayed ceramides (Fig. 15b: blue) (30), that the lamellar pattern with 20–25 Å periodicity represents a stacked skin lipid monolayer with splayed ceramides and chain interdigitation (Fig. 15c: brown) (32), that the lamellar pattern with 55–60 Å periodicity represents a stacked skin lipid bilayer with splayed ceramides and chain interdigitation (Fig. 15d: pink) (32), and that the lamellar pattern with 110–120 Å periodicity represents a stacked skin lipid bilayer with splayed ceramides without chain interdigitation (Fig. 15e: yellow) (27, 29, 32, 42).

Fig. 15. The 5 stages identified in the barrier formation process. (a) highly folded and highly hydrated glucosyl-ceramide based conventional lipid bilayer (green rectangle); (b) stacked monolayer with mixed hairpin- and splayed ceramides (blue rectangle); (c) stacked monolayer with splayed ceramides and chain interdigitation (dark-brown rectangle); (d) stacked bilayer with splayed ceramides and chain interdigitation (pink rectangle); (e) stacked bilayer with splayed ceramides without chain interdigitation (yellow rectangle). Molecular colour codes: glucosyl-ceramide and ceramide molecules (green carbon atoms), cholesterol molecules (yellow carbon atoms), free fatty acid molecules (orange carbon atoms). Oxygen (red atoms), hydrogen (white atoms), and nitrogen (dark-blue atoms) are coloured the same in all lipid molecules and water. Adapted from Norlén et al., 2022 (42), with permission.
Reorganization steps of the barrier formation process
MD-based analysis of the skin’s barrier formation process suggests that the formation of the skin’s barrier structure starts with the secretion into the stratum corneum intercellular space of a highly folded and highly hydrated lipid bilayer (Fig. 16a) (30). Subsequent cleavage of the sugar groups of glucosyl-ceramides of the lipid bilayer (Fig. 16a–b), followed by dehydration (Fig. 16b–c), promotes a straightening of the folded lipid bilayer, turning it into stacks of tightly packed lipid bilayers (Fig. 16c) (31).
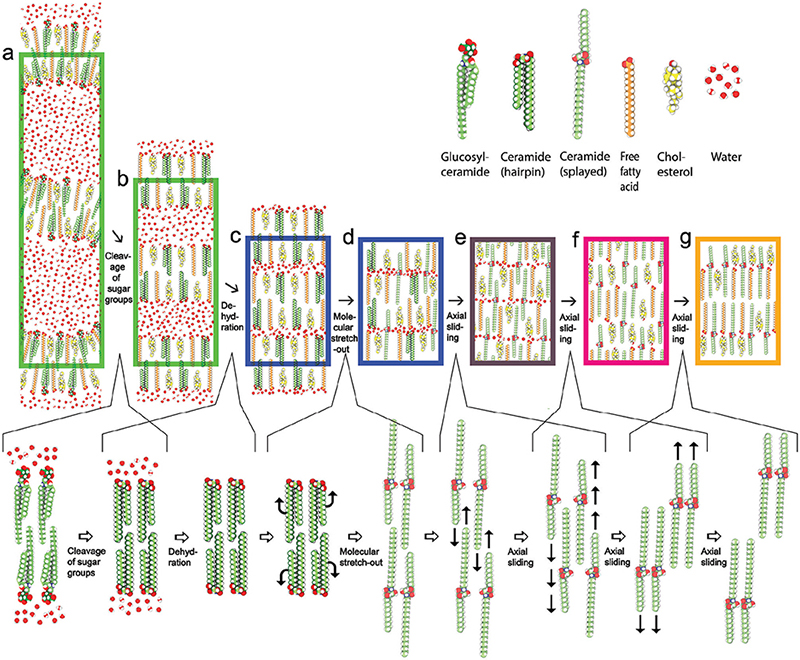
Fig. 16. Reorganization steps of the barrier formation process. Lower row: cleavage of the sugar groups of glucosyl-ceramides (a–b), followed by dehydration (b, c), resulting in a collapse into stacks of tightly packed flat lipid bilayers. (c, d) Ceramide chain flipping resulting in a reorganization of the ceramides from a hairpin (folded) into a splayed (extended) conformation. Sliding along the molecular length axes resulting in (i) interdigitation of the lipid chains (d–e) followed by (ii) separation of the ceramides’ fatty acid- and sphingoid chains, as well as of the cholesterols and the free fatty acids, into different bands of the lamellar structure (e, f), and finally (iii) un-interdigitation of the lipid chains (f, g), yielding the mature skin barrier lipid structure (g). (a) Highly folded and highly hydrated glucosyl-ceramide based conventional lipid bilayer (left green rectangle); (b) flattened and highly hydrated stacked ceramide-based conventional lipid bilayer (right green rectangle); (c) stacked lowly hydrated bilayer with hairpin ceramides (left blue rectangle); (d) stacked monolayer with mixed hairpin- and splayed ceramides (right blue rectangle); e) stacked monolayer with splayed ceramides and chain interdigitation (dark-brown rectangle); (f) stacked bilayer with splayed ceramides and chain interdigitation (pink rectangle); (g) stacked bilayer with splayed ceramides without chain interdigitation (yellow rectangle). Molecular colour codes: glucosyl-ceramide and ceramide molecules (green carbon atoms), cholesterol molecules (yellow carbon atoms), free fatty acid molecules (orange carbon atoms). Oxygen (red atoms), hydrogen (white atoms), and nitrogen (dark-blue atoms) are coloured the same in all lipid molecules and water. Adapted from Norlén et al., 2022 (42), with permission.
Once shielded from water, the lipid bilayers’ ceramide molecules are allowed to stretch-out into their preferred splayed conformation with their 2 hydrocarbon tails pointing in opposite directions (Fig. 16d). When all ceramides have become stretched-out (Fig. 16e) the system can further relax itself and become more tightly packed by letting the ceramide molecules’ short and long hydrocarbon tails, as well as the cholesterol and free fatty acid molecules, separate into different bands within the layered structure. This internal molecular rearrangement is proposed, based on MD model system data (29, 32), to take place via axial sliding of the ceramide molecules together with associated cholesterol and free fatty acid molecules. The axial sliding process initially causes a lipid chain interdigitation (Fig. 16e). Continued axial sliding results in the separation of the ceramides’ short and long hydrocarbon tails, as well as of the cholesterol and free fatty acid molecules, into different bands within the layered structure (Fig. 16 f). The axial sliding process ends with an uninterdigitation of the lipid chains (Fig. 16g), yielding the mature skin barrier structure (Fig. 17) (29–32, 42).
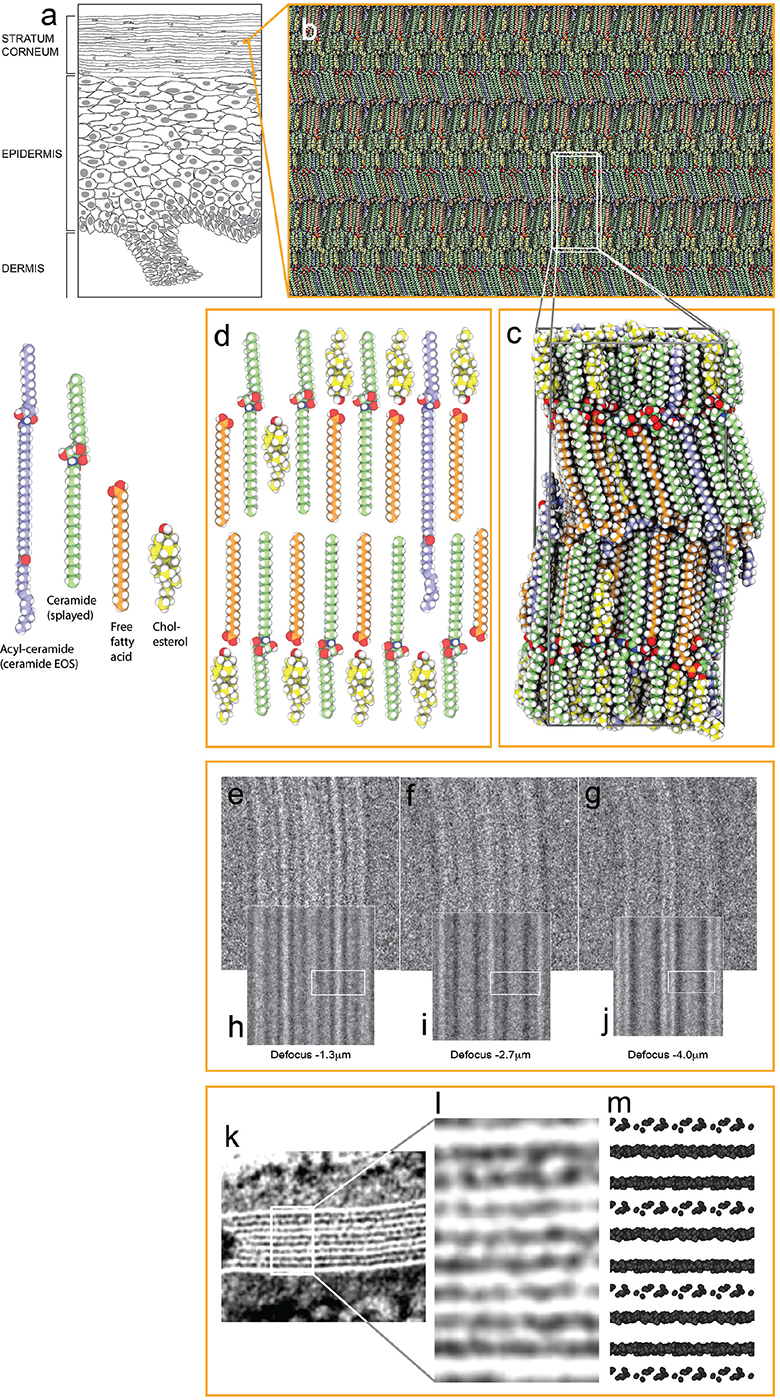
Fig. 17. Architecture of the mature barrier structure. (a) Drawing of epidermis. (b) Atomistic molecular dynamics (MD) model of the mature skin barrier structure. (c) MD simulation box of the model in (b). (d) Schematic drawing of the basic molecular arrangement in (c): a lipid bilayer of fully stretched (splayed) ceramides with cholesterol (yellow molecules) largely associated with the ceramides’ shorter sphingoid side and with free fatty acids (orange molecules) associated with the ceramides’ longer fatty acid side. Acyl-ceramides (ceramide EOS) (light-blue molecules) protrude their ester-bound lignoceric acid ends into the interface between opposing ceramide fatty acid tail ends. (e–g) Cryo-EM defocus series of the skin’s barrier structure. (h–j) Simulated EM defocus series of the model system in B) ((e, h) defocus –1.3 mm; (f, i) –2.7 mm; (g, j) –4.0 mm). White boxes in (h–j) represent the position of the simulation box visualized in (c). (k) Electron density pattern of the stratum corneum intercellular space in plastic embedded skin stained with ruthenium tetroxide (RuO4), graciously obtained from Dr Philip Wertz and adapted from Madison et al. 1987 (43). (l) Enlarged view of the area marked by a white box in (k). (m) Van der Waals representation of oxygens and nitrogens (the most electronegative atoms in the system) of the model system in (b). (m) Rough estimate of what the electron density pattern of the model system in (b) would look like after RuO4 staining. (e–m) Adapted from Lundborg et al., 2018a (29). Molecular colour codes: ceramide molecules (green (ceramide), and light-blue (acyl-ceramide), carbon atoms), cholesterol molecules (yellow carbon atoms), free fatty acid molecules (orange carbon atoms). Oxygen (red atoms), hydrogen (white atoms), and nitrogen (dark-blue atoms) are coloured the same in all lipid molecules and water. Adapted from Norlén et al., 2022 (42), with permission.
BARRIER ARCHITECTURE
MD- and EM-simulation-based analysis of the skin’s mature barrier structure (6) suggests that it is organized as stacked lipid bilayers of fully stretched (splayed) ceramides with cholesterol largely associated with the ceramides’ shorter sphingoid tail and with free fatty acids associated with the ceramides’ longer fatty acid tail (Fig. 17c–d). The ester-bound lignoceric acid ends of the acyl-ceramides (ceramide EOS) (light blue) protrude into the interface between free fatty acid and ceramide fatty acid tail ends. The lignoceric acid ends are mobile and can fold back into the interface between the layers or extend into the opposing layer. The interface between the ceramides’ fatty acid tail ends is therefore more polar than the interface between the ceramides’ sphingoid tail ends, because of the presence of the acyl-ceramides’ ester groups (Fig. 17c–d). This arrangement offers a robust and tight barrier structure and is compatible both with cryo-EM (Fig. 17e–j) and with the broad:narrow:broad electron lucent ruthenium tetroxide (RuO4) staining band pattern observed using conventional EM (Fig. 17k–m) (42–44).
FUTURE PERSPECTIVE
The new knowledge on the structure of the skin’s permeability barrier in healthy skin may now make it possible to explore differences in lipid structure that could be at the basis of barrier malfunction in skin diseases such as psoriasis, ichythosis and atopic dermatitis.
Also, it may facilitate physics-based skin permeability calculations using MD simulation (45–47). This may aid the development of new transdermal- and topical drug delivery systems, as well as be used for skin toxicity assessment.
The use of CEMOVIS in combination with MD modelling and EM simulation in order to obtain in situ a near-native structural reference of a biomolecular complex, may be followed by more detailed investigation in vitro and/or in silico with high-resolution techniques such as X-ray crystallography, single particle cryo-EM, nuclear magnetic resonance spectroscopy and MD simulation. It may thus prove useful for exploring, within the constraints of a near-native reference, the molecular-level function of biostructures inside any cell or tissue.
ACKNOWLEDGEMENTS
The current work was made possible by generous support from the Swedish Medical Society, Oriflame, Shiseido Japan, LEO Pharma, Wenner-Gren foundation, the Swedish eScience Research Center, the Welander foundation and ERCO Pharma. The service of the Core facility for Electron Tomography at Karolinska Institutet and the resources provided by the Swedish National Infrastructure for Computing (SNIC) at PDC Centre for High Performance Computing (PDCHPC), are acknowledged.
REFERENCES
- Duriau F. Recherches expérimentales sur l’absorption et l’exhalation par le té́gument externe. Arch Gen Med T 1856; 7: 161–173.
- Homolle A. Expériences physiologiques sur l’absorption par la tégument externe chez l’homme dans le bain. Union Med 1853; 7: 462.
- Winsor TB, Burch GE. Differential roles of layers of human epigastric skin on diffusion rate of water. Arch Intern Med 1944; 74: 428–436.
- Berenson GS, Burch GE. Studies of diffusion of water through dead human skin; the effect of different environmental states and of chemical alterations of the epidermis. Am J Trop Med Hyg 1951; 31: 842–853.
- Blank IH. Factors which influence the water content of the stratum corneum. J Invest Dermatol 1952; 18: 433–440.
- Onken HD, Moyer CA. The water barrier in human epidermis. Physical and chemical nature. Arch Dermatol 1963; 87: 584–590.
- Brody I. Intercellular space in normal human stratum corneum. Nature 1966; 209: 472–476.
- Scheuplein RJ, Blank IH. Permeability of the skin. Physiol Rev 1971; 51: 702–747.
- Elias PM, Friend DS. The permeability barrier in mammalian epidermis. J Cell Biol 1975; 65: 180–191.
- Elias PM. Epidermal lipids, barrier function, and desquamation. J Invest Dermatol 1983; 80: 44s–49s.
- Wertz PW, Downing DT. Ceramides of pig epidermis: structure determination. J Lipid Res 1983; 24: 759–765.
- Bouwstra JA, Gooris GS, van der Spek JA, Bras W. Structural investigations of human stratum corneum by small-angle X-ray scattering. J Invest Dermatol 1991; 97: 1005–1012.
- Potts RO, Guy RH. Predicting skin permeability. Pharm Res 1992; 9: 663–669.
- Forslind B. A domain mosaic model of the skin barrier. Acta Derm Venereol 1994; 74: 1–6.
- Schaefer H, Redelmeier TE. Skin barrier: principles of percutaneous absorption. Basel, Switzerland: Karger Publishers; 1996.
- Feingold KR, Elias PM. Role of lipids in the formation and maintenance of the cutaneous permeability barrier. Biochim Biophys Acta 2014; 1841: 280–294.
- Rabionet M, Gorgas K, Sandhoff R. Ceramide synthesis in the epidermis. Biochim Biophys Acta 2014; 1841: 422–434.
- Schmitt T, Neubert RHH. State of the art in stratum corneum research: the biophysical properties of ceramides. Chem Phys Lipids 2018; 216: 91–103.
- Wertz P. Epidermal lamellar granules. Skin Pharmacol Physiol 2018; 31: 262–268.
- Ishida-Yamamoto A, Igawa S, Kishibe M. Molecular basis of the skin barrier structures revealed by electron microscopy. Exp Dermatol 2018; 27: 841–846.
- Shamaprasad P, Frame CO, Moore TC, Yang A, Iacovella CR, Bouwstra JA, et al. Using molecular simulation to understand the skin barrier. Prog Lipid Res 2022; 88: 101184.
- Ishida-Yamamoto A, Yamanishi H, Igawa S, Kishibe M, Kusumi S, Watanabe T, Koga D. Secretion bias of lamellar granules revealed by three-dimensional electron microscopy. J Invest Dermatol 2023; 143: 1310–1312.
- Bouwstra JA, Nădăban A, Bras W, McCabe C, Bunge A, Gooris GS. The skin barrier: an extraordinary interface with an exceptional lipid organization. Prog Lipid Res 2023; 92: 101252.
- Norlén L, Al-Amoudi A, Dubochet, J. A cryo-transmission electron microscopy study of skin barrier formation. J Invest Dermatol 2003; 120: 555–560.
- Norlén L, Al-Amoudi A. Stratum corneum keratin structure, function, and formation: the cubic rod-packing and membrane templating model. J Invest Dermatol 2004; 123: 715–732.
- Al-Amoudi A, Dubochet J, Norlén L. Nanostructure of the epidermal extracellular space as observed by cryo-electron microscopy of vitreous sections of human skin. J Invest Dermatol 2005; 124: 764–777.
- Iwai I, Han H, den Hollander L, Svensson S, Öfverstedt L-G, Anwar J, et al. The human skin barrier is organized as stacked bilayers of fully-extended ceramides with cholesterol molecules associated with the ceramide sphingoid moiety. J Invest Dermatol 2012; 132: 2215–2225.
- den Hollander L, Han H-M, de Winter M, Svensson L, Masich S, Daneholt B, Norlén L. Skin lamellar bodies are not discrete vesicles but part of a tubuloreticular network. Acta Derm Venereol 2016; 96: 303–308.
- Lundborg M, Narangifard A, Wennberg C, Lindahl E, Norlén L. Human skin barrier molecular structure and function analyzed by cryo-electron microscopy and molecular dynamics simulation. J Struct Biol 2018a; 203: 149–161.
- Narangifard A, den Hollander L, Iwai I, Han H, Wennberg CL, Lundborg M, et al. Human skin barrier formation takes place via a cubic to lamellar lipid phase transition. Exp Cell Res 2018; 366: 139–151.
- Wennberg C, Narangifard A, Lundborg M, Lindahl E, Norlén L. Structural transitions in ceramide cubic phases during formation of the human skin barrier. Biophys J 2018; 114: 1116–1127.
- Narangifard A, Wennberg CL, den Hollander L, Iwai I, Han H, Lundborg M, et al. Molecular reorganization during formation of the human skin barrier studied in situ. J. Invest. Dermatol 2021; 141: 1243–1253.e6.
- Dubochet J, Adrian M, Chang J-J, Homo J-C, Lepault J, McDowall AW, et al. Cryo electron microscopy of vitrified specimens. Q Rev Biophys 1988; 21: 129–228.
- Al-Amoudi A, Chang J-J, Leforestier A, McDowall A, Michel Salamin L, Norlén L, et al. Cryo-electron microscopy of vitreous sections. EMBO J 2004; 23: 3583–3588.
- Al-Amoudi A, Dubochet J, Norlén L. Nanostructure of the epidermal extracellular space as observed by cryo-electron microscopy of vitreous sections of human skin. J Invest Dermatol 2005; 124: 764–777.
- Norlén L, Al-Amoudi A, Dubochet, J. A cryo-transmission electron microscopy study of skin barrier formation. J Invest Dermatol 2003; 120: 555–560.
- Fanelli D, Öktem O. Electron tomography: a short review with an emphasis on the absorption potential model for the forward problem. Inverse Probl 2008; 24: 013001 (51pp).
- Pronk SS, Páll R, Schulz P, Larsson P, Bjelkmar R, Apostolov et al. GROMACS 4.5: a high-throughput and highly parallel open source molecular simulation toolkit, Bioinformatics 2013; 29: 845–854.
- Abraham MJ, Murtola T, Schulz R, Páll S, Smith JC, Hess B, et al. GROMACS: High performance molecular simulations through multi-level parallelism from laptops to supercomputers. SoftwareX 2015; 1–2: 19–25.
- Rullgård H, Öfverstedt L-G, Masich S, Daneholt B, Öktem O. Simulation of transmission electron microscope images of biological specimens. J. Microscopy 2011; 243: 234–256.
- Elias PM, Cullander C, Mauro T, Rassner U, Kömuves, Brown BE, et al. The secretory granular cell: the outermost granular cell as a specialized secretory cell. J Invest Dermatol Symp Proc 1998; 3: 87–100.
- Norlén L, Lundborg M, Wennberg C, Narangifard A, Daneholt B. The skin’s barrier: a cryo-EM based overview of its architecture and stepwise formation. J Invest Dermatol 2022; 142: 285–292.
- Madison KC, Swartzendruber DC, Wertz PW, Downing DT. Presence of intact intercellular lamellae in the upper layers of the stratum corneum. J Invest. Dermatol 1987; 88: 714–718.
- Hou SYE, Mitra AK, White SH et al. Membrane structures in normal and essential fatty acid-deficient stratum corneum: characterization by ruthenium tetroxide staining and X-ray diffraction. J Invest Dermatol 1991; 96: 215–223.
- Lundborg M, Wennberg C, Narangifard A, Lindahl E, Norlén L. Predicting drug permeability through skin using molecular dynamics simulation. J Controlled Release 2018b; 283: 269–227.
- Lundborg M, Wennberg C, Lidmar J, Hess B, Lindahl E, Norlen L. Skin permeability prediction with MD simulation sampling spatial and alchemical reaction coordinates, Biophysical J 2022; 121: 3837–3849.
- Wennberg C, Lundborg M, Lindahl E, Norlen L. Understanding drug skin permeation enhancers using molecular dynamics simulations. J Chem Inf Model 2023; 63: 4900–4911.
- Yamanishi H, Soma T, Kishimoto J, Hibino T and Ishida-Yamamoto A. marked changes in lamellar granule and trans-golgi network structure occur during epidermal keratinocyte differentiation. J Invest Derm 2019; 139: 352–359.
