ORIGINAL REPORT
Trends in Invasive Melanoma Thickness in Norway, 1983–2019
Raju RIMAL1, Trude E. ROBSAHM2, Adele C. GREEN3,4, Reza GHIASVAND2,5, Corina S. RUEEGG5, Assia BASSAROVA6, Petter GJERSVIK7, Elisabete WEIDERPASS8, Odd O. AALEN1, Bjørn MØLLER9, Flavie PERRIER1 and Marit B. VEIERØD1
1Oslo Centre for Biostatistics and Epidemiology, Department of Biostatistics, Institute of Basic Medical Sciences, University of Oslo, Oslo, Norway, 2Department of Research, Cancer Registry of Norway, Norwegian Institute of Public Health, Oslo, Norway, 3Department of Population Health, QIMR Berghofer Medical Research Institute, Brisbane, Australia, 4Cancer Research UK Manchester Institute, University of Manchester, Manchester, UK, 5Oslo Centre for Biostatistics and Epidemiology, Oslo University Hospital, Oslo, Norway, 6Department of Pathology, Oslo University Hospital – Ullevål, Oslo, Norway, 7Department of Dermatology, Institute of Clinical Medicine, University of Oslo, Oslo, Norway, 8International Agency for Research on Cancer, Lyon, France, and 9Department of Registration, Cancer Registry of Norway, Oslo, Norway
Monitoring melanoma incidence time trends by tumour thickness is essential to understanding the evolution of melanoma occurrence and guiding prevention strategies. To assess long-term incidence trends, tumour thickness was extracted from pathology reports in the Cancer Registry of Norway (1983–2007) and the Norwegian Melanoma Registry (2008–2019), n = 45,635 patients. Across all anatomic sites, T1 (≤ 1 mm) incidence increased most (men annual percentage change [AAPC] = 4.6, 95% confidence interval [95% CI] 4.2–5.0; women AAPC = 3.2, 95% CI 2.8–3.6); the increase was steep until 1989/90, followed by a plateau, and a further steep increase from 2004/05. Increased incidence was also observed for T2 (>1.0–2.0) melanoma (men AAPC = 2.8, 95% CI 2.4–3.2; women AAPC = 1.5, 95% CI 1.1–1.9), and T3 (>2.0–4.0) in men (AAPC = 1.4, 95% CI 0.9–1.9). T4 (>4.0) melanoma followed a similar overall pattern (men AAPC = 1.3, 95% CI 0.9–1.7, head/neck, upper limbs, and trunk; women AAPC = 0.9, 95% CI 0.4–1.4, upper limbs and trunk). Men had the highest T3 and T4 incidence and the sex difference increased with age. Regarding birth cohorts, age-specific incidence increased in all T categories in the oldest age groups, while stabilizing in younger patients born after 1950. Overall, the steep increase in T1 melanoma was not accompanied by a decrease in thick melanoma.
SIGNIFICANCE
Long-term thickness trends in incident melanomas in Norway are unknown. During 1983–2019, 45,635 patients were registered. T1 (≤1 mm) melanoma incidence increased substantially in 1983–1989/90, followed by a plateau, and a new steep increase from 2004/05. Significant steady increases were also found for T2 (>1.0–2.0) and T4 (>4.0) melanoma in both sexes, and T3 (>2.0–4.0) melanoma in men. Age-specific incidence stabilized in younger age groups but increased by birth year in all T categories in the oldest. The increase in thick melanoma indicates a need for increased melanoma awareness in older people, particularly men.
Key words: incidence study; melanoma; tumour thickness; trends; demographic factors.
Citation: Acta Derm Venereol 2024; 104: adv26110. DOI https://doi.org/10.2340/actadv.v104.26110.
Copyright: © 2024 The Author(s). Published by MJS Publishing, on behalf of the Society for Publication of Acta Dermato-Venereologica. This is an Open Access article distributed under the terms of the Creative Commons Attribution-NonCommercial 4.0 International License (https://creativecommons.org/licenses/by-nc/4.0/).
Submitted: Nov 20, 2024; Accepted after revision: Nov 29, 2024; Published: Sep 2, 2024
Corr: Marit B. Veierød, Professor, Oslo Centre for Biostatistics and Epidemiology, Department of Biostatistics, Institute of Basic Medical Sciences, University of Oslo, PO Box 1122 Blindern, NO-0317 Oslo, Norway. E-mail: m.b.veierod@medisin.uio.no
Competing interests and funding: The authors have no conflicts of interest to declare.
This work was supported by the Research Council of Norway (Raju Rimal and Flavie Perrier; project 302048), Unifor (Unifor frimed 2019) and the Norwegian Cancer Society (Flavie Perrier; project 197975). The funding sources had no role in the study design, data collection, data analysis, manuscript preparation, and publication.
INTRODUCTION
Despite various prevention measures, melanoma incidence has continued increasing in most fair-skinned populations during recent decades (1). A large proportion of the rise is assumed to result from increased ultraviolet radiation (UVR) exposure since the early 20th century (2). However, rises in in situ and thin (≤ 1.0 mm) melanoma may also result from increased awareness of suspicious pigmented lesions among healthcare workers and the general population. Potential changes in pathological practice may also play a role, as thin lesions are most sensitive to diagnostic drift and overdiagnosis (3).
Studies from several countries have found the rise in incidence of invasive melanoma to be mainly driven by an increase in thin melanoma, though modest increases were also found in tumours > 1.0 mm (4–7). Also, differences in incidence by tumour thickness at diagnosis between sexes and age groups (8–13) have been found.
Describing time trends in melanoma tumour thickness, the most important prognostic factor, is important for understanding the evolution of melanoma occurrence and guiding prevention strategies. Norway has among the highest melanoma incidence rates in the world, but long-term trends in incidence by tumour thickness are not available. Thickness data obtained from the Cancer Registry of Norway (CRN) for all invasive melanoma cases diagnosed in 1983–2019 provide a unique opportunity to describe population-based trends in melanoma incidence and tumour thickness over a long period as well as by sex, age, calendar period, residential region, and anatomic site. In addition, we describe trends in histopathological subtype within tumour thickness categories, with a focus on nodular melanomas (NM) because they are often thick when diagnosed due to rapid growth and late detection.
MATERIALS AND METHODS
The CRN has recorded all cancer diagnoses in Norway since 1953. In 2008, the Norwegian Melanoma Registry (NMR) was established under the CRN, adding clinical and pathological variables, including tumour thickness and ulceration, to each melanoma case. The CRN/NMR provided information according to the International Classification of Diseases 7th (ICD7) Edition and ICD of Oncology, 3rd Edition for all first cases of primary cutaneous melanoma diagnosed 1983–2019.
Measurement of melanoma thickness was implemented by Norwegian pathological laboratories in the early 1980s. All pathological reports have routinely been reported to the CRN, but melanoma thickness was not included in the digital registration before the establishment of the NMR in 2008. Information on thickness and ulceration for the years prior to 2008 was manually extracted for this study from pathology reports archived in the CRN. Reporting of thickness was sparse before 1983 and ulceration was available from 2000. Thickness (mm) was categorized in T categories, i.e., T1: ≤ 1.0; T2: > 1.0–2.0; T3: > 2.0–4.0; T4: > 4.0 (14). Subclassification of T1–T4 categories (a and b) was used from 2008 (14).
The CRN provided information on sex, age at diagnosis, residential region (according to health regions: south-eastern, western, central, northern Norway), vital status (alive, emigrated, dead), and date of emigration and death by December 31, 2019. Diagnosis year was categorized based on data availability and the establishment of the NMR (1983–1999, 2000–2007, 2008–2019).
The CRN provided ICD7 data on: tumour anatomic site (head/neck [190.0], trunk [190.1, 190.79], upper limbs [190.2], lower limbs [190.3, 190.4], other [190.5, 190.6, 190.8], and skin unspecified [190.9]); histopathological subtype (superficial spreading melanoma [SSM; 87433], NM [87213], lentigo maligna melanoma [LMM; 87423], other [87223, 87233, 87303, 87403, 87443, 87453, 87613, 87703, 87713, 87723, 87803], and unspecified [80003, 87203]); and clinical stage (localized, regional [regional lymph nodes, satellites and in-transit metastasis], or distant disease [non-regional lymph node and organ metastasis], and unspecified) (15).
Use and reporting of de-identified data from the CRN/NMR was covered by the CRN’s regulations of collection and treatment of health information.
Statistical analysis
Continuous tumour thickness was log-transformed and missing information imputed using multiple imputation by chained equations with age at diagnosis, sex, vital status, survival time (≤ 1, 1–5, 5–10, and > 10 years from melanoma diagnosis to death, emigration, or 31 December 2019), residential region, anatomic site, clinical stage, subtype, and cumulative hazard rate of death using the Nelson–Aalen estimator (16). Thickness was then back-transformed and categorised into T categories. Missing data on anatomic site and histopathological subtype were imputed using the same predictors and log-transformed tumour thickness. Due to a decreasing pattern of missing data over time, imputation was performed separately for 1983–1999, 2000–2007, and 2008–2019 with 30 imputed datasets and 20 iterations each.
Using the annual midyear population size obtained from the CRN, annual incidence rates for each T category were calculated per 100,000 person-years, 1983–2019, and age-standardized using the European standard population as in NORDCAN (17). Age-standardized incidence rates were computed using the 30 imputed datasets combined with Rubin’s rule (18). We estimated annual percentage change (APC) with 95% confidence interval (CI) using segmented regression (19–21) with ≤ 3 joinpoints, and average annual percentage change (AAPC) with 95% CI. APCs and AAPCs are presented from multiple imputation analyses, while some of the figures for incidence trends over time include complete case and multiple imputation results, to illustrate the importance of imputation. Age-specific incidence rates by period and birth year were also computed and averaged over the imputed datasets.
All statistical analyses were performed with R version 4.2 (R Foundation for Statistical Computing, Vienna, Austria).
RESULTS
During 1983–2019, 45,635 patients with a first primary invasive melanoma were registered in Norway. We excluded cases not histologically verified (n = 20), cases that emigrated before melanoma diagnosis (n = 29), and cases registered in the CRN based on only death certificate (n = 36) or autopsy (n = 26), resulting in 45,524 cases for analysis.
Median age at diagnosis increased from 56 (1983–1999) to 63 years (2008–2019) in women and from 59 to 67 years in men (Table SI). Proportions of cases by residential region were quite stable over time. In women, the proportion of trunk melanoma increased, and lower limb melanoma decreased over time. Information on ulceration (available from 2000) was underreported before the NMR establishment in 2008 (Table SI, Fig. S1). In 2008–2019, ulceration was present in 14% of women and 19% of men.
From 1983–1999 to 2008–2019, median tumour thickness declined from 1.0 to 0.9 mm in women and from 1.3 to 1.0 in men (Table SI). The proportion of T1 melanoma was highest in women and increased in both sexes. In men and women, the proportions of T2 and T4 melanoma were similar and relatively stable over time, while T3 proportions decreased.
The proportion with unspecified thickness decreased after 2000 (2008–2019: women 7%, men 9%) (Fig. S1); median ages at diagnosis in cases with and without thickness information were similar (Table SII). The proportion of T1 was lower and the proportion of T4 melanoma was higher in the imputed than the complete case datasets (Table SIII, models B and D). Age-standardized incidence rates increased after imputation for all T categories, particularly before 2008 for T1 melanoma (Fig. 1). The proportion of SSM was lower and the proportion of NM higher in the imputed than the complete case datasets (Table SIV, models B and D). Results from multiple imputation are described below.
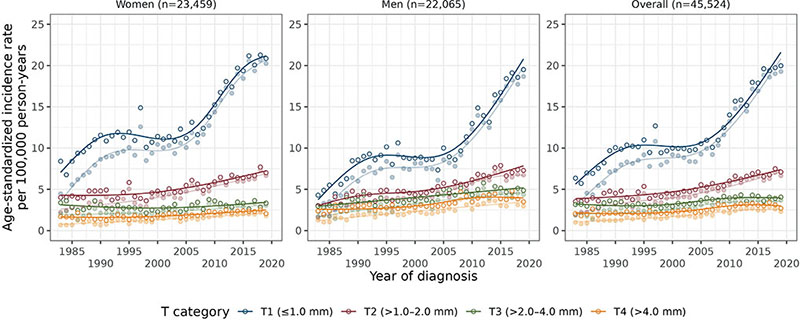
Fig. 1. Age-standardized (European standard population) incidence rates of melanoma per year of diagnosis (1983–2019) for each T category, by sex and overall. Darker colours represent the results from multiple imputation and lighter colours the complete case results; n is the number of cases averaged over the 30 imputed datasets. Annual percentage change for each line (from multiple imputation analysis) is presented in Table I.
| Sex and T category | Period 1a | Period 2a | Period 3a | 1983–2019 | |||
| APC (95% CI) | Years | APC (95% CI) | Years | APC (95% CI) | Years | AAPC (95% CI) | |
| Women (n = 23,459)b | |||||||
| T1 (≤ 1.0 mm) | 6.5 (3.2, 10.0) | 1983–1989 | –0.1 (–1.1, 1.0) | 1990–2004 | 5.0 (4.0, 6.1) | 2005–2019 | 3.2 (2.8, 3.6) |
| T2 (> 1.0–2.0 mm) | 0.2 (–0.9, 1.3) | 1983–1997 | 2.5 (1.7, 3.2) | 1998–2019 | – | – | 1.5 (1.1, 1.9) |
| T3 (> 2.0–4.0 mm) | –1.4 (–2.8, 0.0) | 1983–1997 | 1.3 (0.4, 2.3) | 1998–2019 | – | – | 0.2 (–0.2, 0.6) |
| T4 (> 4.0 mm) | –2.7 (–6.4, 1.1) | 1983–1989 | 1.9 (1.3, 2.4) | 1990–2019 | – | – | 0.9 (0.4, 1.4) |
| Men (n = 22,065)b | |||||||
| T1 (≤ 1.0 mm) | 10.3 (7.6, 13.1) | 1983–1991 | –1.0 (–2.5, 0.4) | 1992–2003 | 6.4 (5.1, 7.6) | 2004–2019 | 4.6 (4.2, 5.0) |
| T2 (> 1.0–2.0 mm) | 7.1 (3.2, 11.1) | 1983–1988 | 0.3 (–1.9, 2.4) | 1989–1999 | 3.0 (2.2, 3.8) | 2000–2019 | 2.8 (2.4, 3.2) |
| T3 (> 2.0–4.0 mm) | 1.8 (1.3, 2.3) | 1983–2011 | –0.1 (–4.3, 4.3) | 2012–2019 | – | – | 1.4 (0.9, 1.9) |
| T4 (> 4.0 mm) | 1.0 (0.3, 1.7) | 1983–2004 | 11.6 (–4.3, 30.2) | 2005–2007 | –0.5 (–2.5, 1.6) | 2008–2019 | 1.3 (0.9, 1.7) |
| aPeriod refers to the segments separated by the joinpoints. The empty cells are due to the fewer joinpoints. bAverage number of cases over 30 imputations. | |||||||
Overall
The age-standardized incidence rate of invasive melanoma increased from 19.3 in 1983–1999 to 30.0 in 2008–2019 in women, and from 18.0 to 31.5 in men (per 100,000 person-years). In women, the incidence of T1 melanoma increased until 1989 (APC = 6.5, 95% CI 3.2–10.0), followed by a plateau (APC = –0.1; 95% CI –1.1–1.0) and a steep increase in 2005−2019 (APC = 5.0; 95% CI 4.0–6.1) (Table I, Fig. 1). A similar trend was found in men. No plateau was seen for the other T categories. The largest incidence increase was for T1 melanoma (AAPC [95% CI]: 3.2 [2.8–3.6] in women and 4.6 [4.2–5.0] in men), followed by T2 (1.5 [1.1–1.9] and 2.8 [2.4–3.2], respectively) and T4 melanoma (0.9 [0.4–1.4] and 1.3 [0.9–1.7], respectively). T3 incidence was quite stable over time in women (AAPC = 0.2; 95% CI –0.2–0.6) and slightly increased in men (AAPC = 1.4; 95% CI 0.9–1.9). It is mainly melanomas < 0.8 mm without ulceration (T1a) that account for the T1 increase since 2008 (Fig. S2). Similarly, non-ulcerated lesions (T2a) mainly account for the recent T2 increase.
By region
Similar trends in T1–T4 incidence were observed within each residential region with consistently higher AAPCs in men (Table SV, Fig. S3).
By anatomic site
For most anatomic sites, T1 melanoma had the highest incidence and steepest increase, and the plateau was most evident for trunk and lower limbs in women and head/neck and trunk in men (Fig. 2, Table SVI). Site-specific AAPCs of T1 melanoma ranged from 0.9 (head/neck) to 3.9 (trunk) in women and from 4.2 (lower limbs) to 5.6 (upper limbs) in men (CI lower bounds > 0). Incidence of T2 melanoma also increased for all sites in both sexes except head/neck in women (1.1 ≤ AAPC≤4.1), and T3 melanoma in men (1.0 ≤ AAPC ≤ 2.2) (CI lower bounds > 0). In women, incidence of T3 melanoma increased in the second period for head/neck, while T3 melanoma on the lower limbs decreased over the whole period. T4 melanoma incidence slightly increased for upper limbs and trunk in women, and head/neck, upper limbs, and trunk in men.
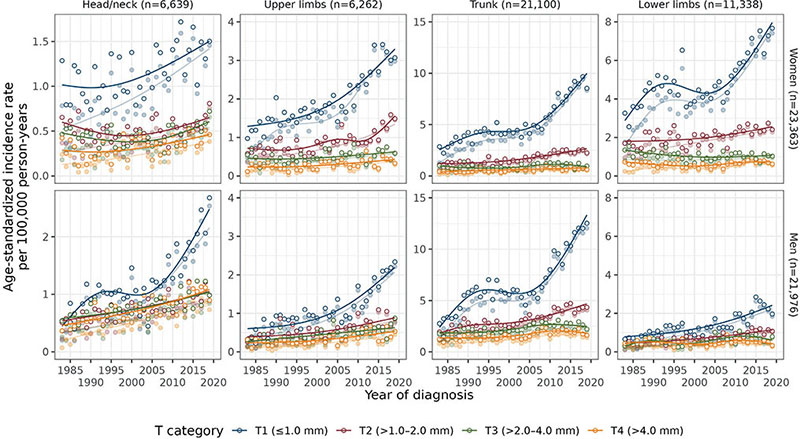
Fig. 2. Age-standardized (European standard population) incidence rates of melanoma per year of diagnosis (1983–2019) for each T category, by anatomic site and sex. Darker colours represent the results from multiple imputation and lighter colours the complete case results; n is the number of cases averaged over the 30 imputed datasets. Note that n is lower than the total n as the “Other” category for anatomic site is not included. Also note that the y-axis is different for each anatomic site. Annual percentage change for each line (from multiple imputation analysis) is presented in Table SVI.
By subtype
For NM, T3 melanoma had the highest incidence over the whole period followed by T2 and T3 melanoma in women and T4 melanoma in men (Fig. S4, Table SVII). The percentages of T3 NMs increased from 1983–1999 to 2008–2019 in head/neck and lower limbs in women and all anatomic sites except lower limbs in men, and T4 NMs except for head/neck (Table II, complete case results in Table SVIII). For SSM, T1–T4 melanoma showed a similar pattern to melanoma overall (Fig. S4, Table SVII).
| Factor | Head/neck | Upper limbs | Trunk | Lower limbs | Overalla | ||||||||
| 1983–1999 | 2000–2007 | 2008–2019 | 1983–1999 | 2000–2007 | 2008–2019 | 1983–1999 | 2000–2007 | 2008–2019 | 1983–1999 | 2000–2007 | 2008–2019 | 1983–2019 | |
| Women | |||||||||||||
| T1, n | 454 | 278 | 587 | 578 | 355 | 1,024 | 1,348 | 868 | 2,578 | 1,536 | 834 | 2,156 | 12,619 |
| SSM, % | 58.6 | 59.6 | 58.5 | 88.0 | 87.2 | 88.1 | 94.6 | 92.3 | 94.3 | 92.1 | 90.0 | 93.3 | 88.7 |
| NM, % | 9.2 | 10.6 | 9.9 | 8.0 | 9.3 | 5.6 | 4.5 | 6.6 | 3.1 | 5.7 | 6.9 | 3.6 | 5.5 |
| LMM, % | 31.3 | 29.1 | 31.1 | 3.2 | 3.3 | 5.9 | 0.8 | 0.7 | 2.2 | 1.2 | 1.4 | 1.9 | 5.1 |
| Other, % | 0.9 | 0.8 | 0.6 | 0.9 | 0.3 | 0.4 | 0.2 | 0.4 | 0.4 | 1.0 | 1.6 | 1.2 | 0.8 |
| T2, n | 255 | 142 | 260 | 288 | 203 | 433 | 480 | 324 | 813 | 695 | 409 | 847 | 5,175 |
| SSM, % | 36.2 | 47.6 | 50.6 | 63.9 | 61.9 | 66.0 | 71.6 | 68.6 | 73.9 | 71.4 | 69.3 | 73.2 | 66.9 |
| NM, % | 31.7 | 30.9 | 26.6 | 29.8 | 32.2 | 29.9 | 26.2 | 28.4 | 24.3 | 23.9 | 26.6 | 22.6 | 26.3 |
| LMM, % | 29.3 | 18.2 | 19.4 | 3.5 | 2.4 | 2.8 | 1.3 | 1.9 | 0.9 | 1.5 | 1.2 | 1.4 | 4.4 |
| Other, % | 2.8 | 3.4 | 3.4 | 2.8 | 3.5 | 1.3 | 0.9 | 1.1 | 0.9 | 3.2 | 2.8 | 2.7 | 2.4 |
| T3, n | 224 | 118 | 259 | 191 | 132 | 256 | 329 | 197 | 423 | 465 | 217 | 422 | 3,248 |
| SSM, % | 28.4 | 24.9 | 25.8 | 34.3 | 26.7 | 32.0 | 47.7 | 37.8 | 43.7 | 44.9 | 45.9 | 44.8 | 38.8 |
| NM, % | 47.9 | 54.0 | 55.7 | 60.4 | 67.1 | 60.3 | 49.0 | 58.1 | 50.8 | 45.6 | 48.0 | 48.8 | 52.1 |
| LMM, % | 19.8 | 12.7 | 13.2 | 3.2 | 2.3 | 3.9 | 1.9 | 2.0 | 3.3 | 2.3 | 2.9 | 2.5 | 5.1 |
| Other, % | 4.0 | 8.5 | 5.2 | 2.1 | 3.9 | 3.7 | 1.4 | 2.1 | 2.2 | 7.1 | 3.2 | 3.8 | 4.1 |
| T4, n | 158 | 110 | 242 | 127 | 96 | 204 | 199 | 159 | 330 | 284 | 136 | 339 | 2,417 |
| SSM, % | 13.6 | 18.3 | 16.6 | 22.3 | 21.6 | 17.1 | 28.6 | 21.4 | 23.7 | 29.0 | 31.9 | 23.4 | 22.6 |
| NM, % | 65.7 | 62.3 | 64.9 | 67.0 | 68.2 | 72.5 | 64.0 | 69.8 | 68.8 | 57.7 | 59.0 | 66.9 | 65.3 |
| LMM, % | 11.9 | 5.1 | 7.5 | 3.6 | 2.2 | 3.4 | 3.8 | 2.8 | 2.5 | 4.8 | 2.7 | 2.6 | 4.2 |
| Other, % | 8.7 | 14.3 | 11.0 | 7.1 | 8.1 | 7.0 | 3.6 | 6.0 | 4.9 | 8.5 | 6.4 | 7.1 | 7.8 |
| Men | |||||||||||||
| T1, n | 332 | 211 | 687 | 262 | 185 | 607 | 1,772 | 1,050 | 3,556 | 364 | 230 | 682 | 9,950 |
| SSM, % | 66.3 | 56.9 | 61.2 | 89.9 | 87.9 | 90.7 | 92.9 | 90.9 | 93.5 | 91.6 | 89.8 | 93.5 | 88.6 |
| NM, % | 9.9 | 17.0 | 10.9 | 6.3 | 8.4 | 5.5 | 5.2 | 6.9 | 3.2 | 6.9 | 5.7 | 3.7 | 5.6 |
| LMM, % | 22.8 | 25.0 | 26.9 | 3.5 | 2.3 | 3.4 | 1.7 | 1.8 | 2.9 | 0.9 | 1.6 | 1.6 | 5.2 |
| Other, % | 0.9 | 1.0 | 1.0 | 0.3 | 1.4 | 0.3 | 0.2 | 0.4 | 0.3 | 0.7 | 2.9 | 1.2 | 0.6 |
| T2, n | 240 | 164 | 356 | 159 | 93 | 286 | 874 | 577 | 1,458 | 204 | 134 | 346 | 4,897 |
| SSM, % | 47.5 | 44.8 | 50.9 | 62.2 | 63.5 | 67.7 | 73.0 | 66.7 | 76.5 | 68.4 | 64.1 | 76.9 | 68.4 |
| NM, % | 36.6 | 36.8 | 33.8 | 33.1 | 32.3 | 28.2 | 24.9 | 30.1 | 21.5 | 25.7 | 32.6 | 18.8 | 26.5 |
| LMM, % | 14.2 | 13.7 | 12.0 | 2.3 | 2.3 | 2.4 | 1.2 | 1.6 | 1.4 | 1.9 | 0.8 | 1.2 | 3.3 |
| Other, % | 1.7 | 4.7 | 3.3 | 2.4 | 1.8 | 1.7 | 1.0 | 1.6 | 0.6 | 4.0 | 2.5 | 3.1 | 1.8 |
| T3, n | 261 | 166 | 366 | 122 | 97 | 222 | 705 | 450 | 993 | 176 | 127 | 264 | 3,972 |
| SSM, % | 28.2 | 25.9 | 25.6 | 39.3 | 34.9 | 35.3 | 48.5 | 41.9 | 40.7 | 37.3 | 40.6 | 43.2 | 38.8 |
| NM, % | 54.1 | 59.3 | 60.1 | 51.8 | 58.7 | 58.4 | 48.0 | 54.4 | 54.5 | 48.6 | 51.1 | 48.5 | 53.4 |
| LMM, % | 14.6 | 7.7 | 6.7 | 4.6 | 2.9 | 4.0 | 1.9 | 1.9 | 2.1 | 2.9 | 2.4 | 3.0 | 3.8 |
| Other, % | 3.1 | 7.2 | 7.6 | 4.3 | 3.5 | 2.3 | 1.6 | 1.7 | 2.7 | 11.2 | 5.8 | 5.3 | 4.0 |
| T4, n | 226 | 158 | 389 | 93 | 68 | 188 | 524 | 318 | 774 | 177 | 84 | 209 | 3,244 |
| SSM, % | 15.9 | 17.5 | 16.9 | 27.4 | 20.5 | 19.7 | 29.5 | 24.5 | 23.0 | 23.6 | 24.3 | 24.9 | 22.8 |
| NM, % | 73.5 | 68.5 | 66.9 | 62.0 | 71.9 | 72.0 | 64.3 | 68.3 | 69.3 | 59.1 | 64.0 | 62.0 | 66.9 |
| LMM, % | 4.6 | 3.2 | 2.8 | 4.8 | 2.8 | 2.4 | 2.9 | 3.1 | 2.8 | 4.2 | 3.0 | 3.2 | 3.1 |
| Other, % | 6.1 | 10.8 | 13.4 | 5.8 | 4.8 | 5.9 | 3.3 | 4.1 | 4.8 | 13.1 | 8.6 | 10.0 | 7.2 |
| aThe “Overall” column includes the “Other” category of anatomic site. | |||||||||||||
| SSM: superficial spreading melanoma; NM: nodular melanoma; LMM: lentigo maligna melanoma. T1: ≤1.0 mm; T2: >1.0–2.0 mm; T3: >2.0–4.0 mm; T4: >4.0 mm | |||||||||||||
By sex, age, and birth year
T1 incidence peaked at age 65–69 in women and age 70–74 in men, T2 incidence flattened around those ages, and T3 and T4 incidence continued to increase by age (Fig. S5). During 1983–2019, women had higher T1 melanoma incidence than men up to age 64 years, thereafter men had the highest incidence (Fig. S6). A similar switch occurred at an earlier age in T2 melanoma. For thicker melanoma, men had higher incidence than women in all age groups and the difference between the sexes increased by age. There was no plateau in T1 incidence below age 40, where incidence was quite stable over the period, and no plateau in ages above 75 where a steady steep increase was found throughout the whole period (Fig. S6). Moreover, the difference in melanoma incidence between younger and older age groups increased from 1983 to 2019 in all T categories, particularly after 2000, and the difference was larger in thicker than thinner melanoma (Fig. S7).
From age 40, age-specific T1 incidence increased by birth year in all age groups and in the oldest age groups for T2 (> 50), T3 (> 65), and T4 (> 70) melanoma (Fig. 3). In younger age groups born after 1950, incidence flattened by birth year for all T categories. T3 and T4 incidence strongly increased by age in all birth cohorts in both sexes, while the effect of age was less evident for thinner melanoma in the older birth cohorts (Fig. S8).
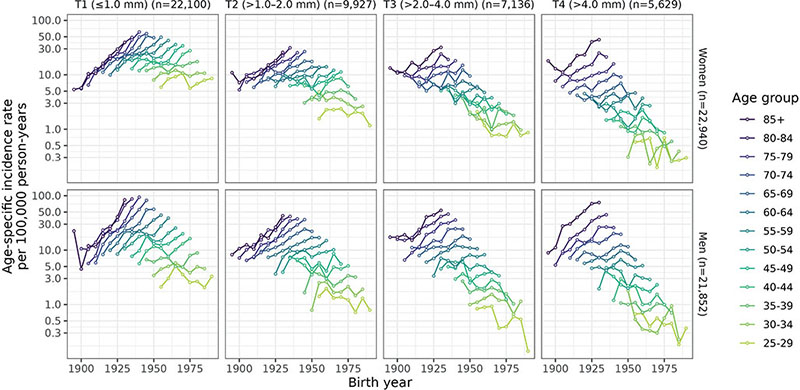
Fig. 3. Age-specific melanoma incidence rates (age ≥25 years) by birth year, T category, and sex; n is the number of cases averaged over the 30 imputed datasets. The y-axis is in log-scale and represents the age-specific incidence rate per 100,000 person-years averaged over imputed datasets.
DISCUSSION
In Norway, national trends during 1983–2019 showed a substantial increase in the incidence rate of thin (T1) melanoma until 1989/90, followed by a plateau, and a steep increase from 2004/05. A temporary plateau was not observed in the other modestly increasing T categories. T1 incidence increased during 1983–2019 in all residential regions. NM incidence rates were highest in T3 tumours, while SSM trends were similar to overall trends in all T categories. Incidence flattened by birth year for all T categories in the youngest age groups, and the largest difference in incidence between younger and older age groups was found for T3 and T4 melanoma, particularly since 2000.
Studies from several countries, covering earlier and/or shorter time periods, have found increasing incidence of T1 melanoma, e.g., in Italy (1994–2012) (5), the Netherlands (1989–2010) (6,22,23), USA (1989–2009) (7), Denmark (1985–2012) (24), and Sweden (1997–2018) (10). We observed a temporary plateau in T1 incidence from the early 1990s among those aged 40–74 years. A plateau might be a selection effect. If more T1 cases are discovered, then the pool of such cases is emptied out to some extent. This might give a plateau effect for a while. Such a plateau has not been found in Sweden (10) and Denmark (24). A plateau was previously reported in melanoma incidence overall in Norway (13, 25), but without information on tumour thickness. A plateau in T1 incidence was also observed in Australia during 1996–2006, but with no later increase as in our study (26). In the most recent US study (2010–2018), T1 incidence had stabilized in all age groups and slightly decreased after a small peak in 2013–2015 (27). Primary prevention is likely driving the stabilizing trends in Australia and the USA.
Skin cancer prevention campaigns have been far less coordinated and less intensive in Norway than in Australia (28), and Norway does not have a nationally funded prevention programme. The Norwegian Cancer Society (NCS) has been the driving force in skin cancer awareness and sun safety campaigns since the 1990s, and the Norwegian Radiation and Nuclear Safety Authority (DSA) has collaborated with the NCS in several campaigns. Sunburn throughout life increases melanoma risk (29), and sun-habit surveys from the NCS and DSA have demonstrated that sunbathing and sunburn are still common in the Norwegian population(30).
A study from 13 European countries (1995–2012) (4) concluded that the rise in invasive melanoma was mainly driven by an increase in T1 melanoma, but a modest increase was also found in melanoma > 1 mm (4). In line with recent Swedish results (1997–2018) (10), we found a clear increase in T2 incidence and a stable T3 incidence. The increase in T4 incidence in both sexes is consistent with recent results from Sweden (10) and the USA (27).
The recent steep rise in T1 melanoma, since 2008 mainly in T1a melanoma, may have been driven by several factors: increased awareness in the general population and general practitioners, lower clinical thresholds for biopsying pigmented lesions, and a shift in histopathological thresholds to label morphologic changes as invasive cancer (3). Consistent with our results, low-risk melanoma constitutes a growing proportion of diagnosed melanomas in the USA (31). Furthermore, a recent Norwegian study with histopathological reassessment, spanning diagnoses from benign nevi to invasive melanoma, from 2009 and 2018–2019 (32), indicated that the “threshold” for making more serious diagnoses may have become lower.
Our results indicate sex- and age-specific differences in melanoma awareness. Men had higher T3 and T4 incidence than women at all ages and higher T1 and T2 incidence after middle age. Women are more likely than men to be aware of their skin, conduct self-examination, and seek healthcare (8), and women are being diagnosed at a younger age and with thinner melanoma (9–11). The flattening trend in younger generations may be a result of the sun safety campaigns or spending more time indoors (12). However, NM appears somewhat more prevalent in Norway than in other Nordic countries (9, 10, 24). The percentages of NM in T3 and T4 melanoma in our study may reflect the challenges in early diagnosis of NM because of its characteristic early, rapid vertical growth and often late detection due to its symmetry and uniform colour (33). Men and older individuals elsewhere have been shown to be more likely to have NMs of greater thickness (34, 35), and our results suggest a similar lack of awareness in older Norwegians.
Potential overdiagnosis is discussed in connection with increasing incidence of in situ and thin melanoma (36). Increased focus on early diagnosis and diagnostic shift can, as mentioned earlier, contribute to increased incidence. Clinical skin examination has resulted in overdetection in Australia, especially of in situ melanoma, but such examination is less common in Norway (37). Overtreatment following overdiagnosis implies additional costs and potential side effects (36). However, it is still unclear which melanomas are being overtreated (36, 38), and thin melanomas contribute substantially to melanoma mortality (38).
National cancer data over a 35-year period are an important strength of our study. Mandatory reporting from several independent sources ensures completeness and high-quality data (39). From 2000, >99.5% of melanoma cases have been morphologically verified (39). Limitations include lack of national data on melanoma in situ and missing tumour thickness data. However, the proportion of cases with missing thickness in Norway from 2008 (7% women; 9% men) is comparable to other studies (12,27). Missing information on tumour thickness, anatomic site, and histopathologic subtype was imputed using multiple imputation, taking the decrease in missing data over time into account, and thereby avoiding bias from exclusion of cases without thickness data (40). The T1 proportion was lower and the T4 proportion higher in imputed versus complete case data, consistent with the results of Shaikh et al. (2013), where exclusion of individuals with missing thickness resulted in underestimation of fatal melanoma (40).
In conclusion, we found a steep increase in thin melanoma until 1989/90, followed by a plateau, and from 2004/05 again a steep increase. A similar plateau was not found in the more moderately increasing trends of thicker melanoma. The higher incidence of T4 melanoma in men in all age groups, the higher incidences of T1 and T2 melanoma after middle age in men, and the higher incidence increase in men than women in all T categories point to a need for increased melanoma awareness in men. Likewise, the increases in T3 and T4 incidence by age and the increase in percentage of NM in T3 and T4 melanoma indicate a need for more awareness of new and rapidly growing pigmented lesions in older people.
Acknowledgements
Data availability: The Cancer Registry of Norway’s data-delivery unit handles all inquiries concerning data from the Cancer Registry of Norway via application to Helsedata.no. Access will be conditional on adherence to local ethical and security policy. The R code used to conduct specific analyses will be available in GitHub (https://github.com/ocbe-uio/Melanoma-Incidence-in-Norway.git).
Ethics statement: Use and reporting of de-identified data from the CRN/NMR was covered by the CRN’s regulations of collection and treatment of health information.
Disclaimer: Where authors are identified as personnel of the International Agency for Research on Cancer/World Health Organization, the authors alone are responsible for the views expressed in this article and they do not necessarily represent the decisions, policy, or views of the International Agency for Research on Cancer/World Health Organization.
REFERENCES
- Olsen CM, Green AC, Pandeya N, Whiteman DC. Trends in melanoma incidence rates in eight susceptible populations through 2015. J Invest Dermatol 2019; 139: 1392–1395.
- Arnold M, de Vries E, Whiteman DC, Jemal A, Bray F, Parkin DM, et al. Global burden of cutaneous melanoma attributable to ultraviolet radiation in 2012. Int J Cancer 2018; 143: 1305-1314. https://doi.org/10.1002/ijc.31527
- Welch HG, Mazer BL, Adamson AS. The rapid rise in cutaneous melanoma diagnoses. N Engl J Med 2021; 384: 72-79. https://doi.org/10.1056/NEJMsb2019760
- Sacchetto L, Zanetti R, Comber H, Bouchardy C, Brewster DH, Broganelli P, et al. Trends in incidence of thick, thin and in situ melanoma in Europe. Eur J Cancer 2018; 92: 108-118. https://doi.org/10.1016/j.ejca.2017.12.024
- Bianconi F, Crocetti E, Grisci C, Primieri C, Stracci F. What has changed in the epidemiology of skin melanoma in central Italy during the past 20 years? Melanoma Res 2020; 30: 396-401. https://doi.org/10.1097/CMR.0000000000000551
- Leeneman B, Schreuder K, Uyl-de Groot CA, Van Akkooi ACJ, Haanen JBAG, Wakkee M, et al. Stage-specific trends in incidence and survival of cutaneous melanoma in the Netherlands (2003-2018): a nationwide population-based study. Eur J Cancer 2021; 154: 111-119. https://doi.org/10.1016/j.ejca.2021.06.007
- Shaikh WR, Dusza SW, Weinstock MA, Oliveria SA, Geller AC, Halpern AC. Melanoma thickness and survival trends in the United States, 1989-2009. J Natl Cancer Inst 2016; 108: djv294-djv294. https://doi.org/10.1093/jnci/djv294
- Schwartz MR, Luo L, Berwick M. Sex differences in melanoma. Curr Epidemiol Rep 2019; 6: 112-118. https://doi.org/10.1007/s40471-019-00192-7
- Robsahm TE, Helsing P, Nilssen Y, Vos L, Rizvi SMH, Akslen LA, et al. High mortality due to cutaneous melanoma in Norway: a study of prognostic factors in a nationwide cancer registry. Clin Epidemiol 2018; 10: 537-548. https://doi.org/10.2147/CLEP.S151246
- Eriksson H, Nielsen K, Vassilaki I, Lapins J, Mikiver R, Lyth J, et al. Trend shifts in age-specific incidence for in situ and invasive cutaneous melanoma in Sweden. Cancers (Basel) 2021; 13: 2838. https://doi.org/10.3390/cancers13112838
- Stefansson H, Tryggvadottir L, Olafsdottir EJ, Mooney E, Olafsson JH, Sigurgeirsson B, et al. Cutaneous melanoma in Iceland: changing Breslow’s tumour thickness. J Eur Acad Dermatol Venereol 2015; 29: 346-352. https://doi.org/10.1111/jdv.12552
- Aitken JF, Youlden DR, Baade PD, Soyer HP, Green AC, Smithers BM. Generational shift in melanoma incidence and mortality in Queensland, Australia, 1995-2014. Int J Cancer 2018; 142: 1528-1535. https://doi.org/10.1002/ijc.31141
- Robsahm TE, Bergva G, Hestvik UE, Møller B. Sex differences in rising trends of cutaneous malignant melanoma in Norway, 1954-2008. Melanoma Res 2013; 23: 70-78. https://doi.org/10.1097/CMR.0b013e32835c7e48
- Gershenwald JE, Scolyer RA, Hess KR, Sondak VK, Long GV, Ross MI, et al. Melanoma staging: evidence-based changes in the American Joint Committee on Cancer eighth edition cancer staging manual. CA Cancer J Clin 2017; 67: 472-492. https://doi.org/10.3322/caac.21409
- Walters S, Maringe C, Butler J, Brierley JD, Rachet B, Coleman MP. Comparability of stage data in cancer registries in six countries: lessons from the International Cancer Benchmarking Partnership. Int J Cancer 2013; 132: 676-685. https://doi.org/10.1002/ijc.27651
- Andersen PK, Borgan O, Gill RD, Keiding N. Statistical models based on counting processes. Berlin/Heidelberg: Springer Science & Business Media; 2012.
- Engholm G, Ferlay J, Christensen N, Bray F, Gjerstorff ML, Klint Å, et al. NORDCAN - a Nordic tool for cancer information, planning, quality control and research. Acta Oncol 2010; 49: 725-736. https://doi.org/10.3109/02841861003782017
- Rubin DB. Multiple imputation for nonresponse in surveys. Chichester/New York: Wiley; 2004.
- Wagner AK, Soumerai SB, Zhang F, Ross-Degnan D. Segmented regression analysis of interrupted time series studies in medication use research. J Clin Phar Ther 2002; 27: 299-309. https://doi.org/10.1046/j.1365-2710.2002.00430.x
- Muggeo VMR. Segmented: an R package to fit regression models with broken-line relationships. R News 2008; 8: 20-25.
- Muggeo VMR. Estimating regression models with unknown break-points. Stat Med 2003; 22: 3055-3071. https://doi.org/10.1002/sim.1545
- Hollestein LM, van den Akker SAW, Nijsten T, Karim-Kos HE, Coebergh JW, de Vries E. Trends of cutaneous melanoma in The Netherlands: increasing incidence rates among all Breslow thickness categories and rising mortality rates since 1989. Ann Oncol 2012; 23: 524-530. https://doi.org/10.1093/annonc/mdr128
- Van Der Leest RJT, Zoutendijk J, Nijsten T, Mooi WJ, Van Der Rhee JI, De Vries E, et al. Increasing time trends of thin melanomas in The Netherlands: what are the explanations of recent accelerations? Eur J Cancer 2015; 51: 2833-2841. https://doi.org/10.1016/j.ejca.2015.09.008
- Helvind NM, Hölmich LR, Smith S, Glud M, Andersen KK, Dalton SO, et al. Incidence of in situ and invasive melanoma in Denmark from 1985 through 2012: a national database study of 24 059 melanoma cases. JAMA Dermatol 2015; 151: 1087-1095. https://doi.org/10.1001/jamadermatol.2015.1481
- Erdmann F, Lortet-Tieulent J, Schüz J, Zeeb H, Greinert R, Breitbart EW, et al. International trends in the incidence of malignant melanoma 1953-2008: are recent generations at higher or lower risk? Int J Cancer 2013; 132: 385-400. https://doi.org/10.1002/ijc.27616
- Baade P, Meng X, Youlden D, Aitken J, Youl P. Time trends and latitudinal differences in melanoma thickness distribution in Australia, 1990-2006. Int J Cancer 2012; 130: 170-178. https://doi.org/10.1002/ijc.25996
- Chen ML, de Vere Hunt IJ, John EM, Weinstock MA, Swetter SM, Linos E. Differences in thickness-specific incidence and factors associated with cutaneous melanoma in the US from 2010 to 2018. JAMA Oncol 2022; 8: 755-759. https://doi.org/10.1001/jamaoncol.2022.0134
- Iannacone MR, Green AC. Towards skin cancer prevention and early detection: evolution of skin cancer awareness campaigns in Australia. Melanoma Manag 2014; 1: 75-84. https://doi.org/10.2217/mmt.14.6
- Lergenmuller S, Rueegg CS, Perrier F, Robsahm TE, Green AC, Lund E, et al. Lifetime sunburn trajectories and associated risks of cutaneous melanoma and squamous cell carcinoma among a cohort of Norwegian women. JAMA Dermatol 2022; 158: 1367-1377. https://doi.org/10.1001/jamadermatol.2022.4053
- Kreftforeningen i samarbeid med Direktoratet for strålevern og atomsikkerhet (DSA). Solvaneundersøkelse i den norske befolkningen 2022; 2022.
- Kerr KF, Elder DE, Piepkorn MW, Knezevich SR, Eguchi MM, Shucard HL, et al. Pathologist characteristics associated with rendering higher-grade diagnoses for melanocytic lesions. JAMA Dermatol 2023; 159: 1315-1322. https://doi.org/10.1001/jamadermatol.2023.4334
- Gjersvik P, Veierød MB, Thompson A, Grzyb K, Liland KH, Vazov N, et al. Histopathologic reassessment of melanoma and other melanocytic skin lesions excised in 2009 and 2018-2019. Tidsskr Nor Laegeforen 2022; 142(15). https://doi.org/10.4045/tidsskr.22.0204
- Corneli P, Zalaudek I, Magaton Rizzi G, di Meo N. Improving the early diagnosis of early nodular melanoma: can we do better? Expert Rev Anticancer Ther 2018; 18: 1007-1012. https://doi.org/10.1080/14737140.2018.1507822
- Geller AC, Elwood M, Swetter SM, Brooks DR, Aitken J, Youl PH, et al. Factors related to the presentation of thin and thick nodular melanoma from a population-based cancer registry in Queensland Australia. Cancer 2009; 115: 1318-1327. https://doi.org/10.1002/cncr.24162
- Liu W, Dowling JP, Murray WK, McArthur GA, Thompson JF, Wolfe R, et al. Rate of growth in melanomas: characteristics and associations of rapidly growing melanomas. Arch Dermatol 2006; 142: 1551-1558. https://doi.org/10.1001/archderm.142.12.1551
- Bjørch MF, Gram EG, Brodersen JB. Overdiagnosis in malignant melanoma: a scoping review. BMJ Evid Based Med 2024; 29: 17-28. https://doi.org/10.1136/bmjebm-2023-112341
- Whiteman DC, Olsen CM, MacGregor S, Law MH, Thompson B, Dusingize JC, et al. The effect of screening on melanoma incidence and biopsy rates. Br J Dermatol 2022; 187: 515-522. https://doi.org/10.1111/bjd.21649
- Whiteman DC, Baade PD, Olsen CM. More people die from thin melanomas (≤1 mm) than from thick melanomas (>4 mm) in Queensland, Australia. J Invest Dermatol 2015; 135: 1190-1193. https://doi.org/10.1038/jid.2014.452
- Cancer Registry of Norway. Cancer in Norway 2021: cancer incidence, mortality, survival and prevalence in Norway. Oslo: Cancer Registry of Norway; 2022.
- Shaikh WR, Weinstock MA, Halpern AC, Oliveria SA, Geller AC, Dusza SW. The characterization and potential impact of melanoma cases with unknown thickness in the United States’ Surveillance, Epidemiology, and End Results Program, 1989-2008. Cancer Epidemiol 2013; 37: 64-70. https://doi.org/10.1016/j.canep.2012.08.010