ORIGINAL REPORT
Novel Detection and Clinical Utility of Serum-Derived Extracellular Vesicle in Angiosarcoma
Kazunori YOKOI1# , Jing WANG1#, Yusuke YOSHIOKA2, Yasuhiro FUJISAWA3, Manabu FUJIMOTO1, Takahiro OCHIYA2 and Atsushi TANEMURA1
1Department of Dermatology, Osaka University Graduate School of Medicine, Osaka, 2Department of Molecular and Cellular Medicine, Institute of Medical Science, Tokyo Medical University, Tokyo, and 3Department of Dermatology, Tsukuba University, Tsukuba, Ibaraki, Japan
#These authors contributed equally to this study.
Cutaneous angiosarcoma is a rare and highly aggressive skin malignancy. The aim of this study is to explore the alteration of serum-derived extracellular vesicle (EV) in angiosarcoma patients and to evaluate its clinical utility as a novel circulating biomarker. In a microarray analysis to examine the differential expression of specific EV-associated microRNAs in sera between cutaneous angiosarcoma patients and healthy controls, 73 microRNAs with significant upregulation and 100 microRNAs with significant downregulation, respectively, were identified in patients with angiosarcoma. Among them, quantitative PCR confirmed that miR-184, miR-3925-5p, miR-3926, and miR-5703 were upregulated in sera of cutaneous angiosarcoma patients compared with those of healthy controls and melanoma patients. Additionally, these 4 microRNAs were expressed more highly in angiosarcoma cell lines compared with normal human endothelial cell lines and were prone to elevate along with disease progression. Furthermore, a gene analysis predicted that the target gene set of microRNAs might affect the regulation of TP53 via the epigenetic regulation of MECP2. Taken together, these 4 extracellular vesicle-associated microRNAs in circulation serve as a promising liquid biomarker to identify angiosarcoma patients and trace disease progression.
SIGNIFICANCE
Due to their rarity, research on angiosarcoma patient-derived microRNAs is very limited. To our knowledge, no studies have reported the clinical significance of serum extracellular vesicle-associated microRNAs in angiosarcoma patients. In this study, a differential expression analysis detected 73 microRNAs that were significantly upregulated and 100 microRNAs that were significantly downregulated in the sera of cutaneous angiosarcoma patients. Of these upregulated microRNAs, we identified 4 microRNAs as potential disease biomarkers and predicted their target genes and functions.
Key words: angiosarcoma; serum; extracellular vesicle; microRNA; biomarker.
Citation: Acta Derm Venereol 2025; 105: adv40902. DOI: https://doi.org/10.2340/actadv.v105.40902.
Copyright: © 2025 The Author(s). Published by MJS Publishing, on behalf of the Society for Publication of Acta Dermato-Venereologica. This is an Open Access article distributed under the terms of the Creative Commons Attribution-NonCommercial 4.0 International License (https://creativecommons.org/licenses/by-nc/4.0/).
Submitted: May 30, 2024. Accepted after revision: Feb 3, 2025. Published: Feb 25, 2025.
Corr: Atsushi Tanemura, MD, PhD, Department of Dermatology, Osaka University Graduate School of Medicine, 2-2 Yamadaoka, Suita, Osaka 565-0871, Japan. E-mail: tanemura@derma.med.osaka-u.ac.jp
Competing interests and funding: The authors have no conflicts of interest to declare.
INTRODUCTION
Angiosarcoma (AS) is a rare and aggressive malignant tumor that originates from lymphatic or vascular endothelial cells (1). Cutaneous AS accounts for approximately 60% of all cases of AS, and often arises from the scalp in the elderly (2). Pulmonary involvement is observed in 60–80% of cases of cutaneous AS (3). Although some innovative treatments, including immune checkpoint inhibitors, have been developed for skin malignancies, the prognosis of cutaneous AS is still poor (4). Therefore, it is crucial to gain a deeper understanding of cutaneous AS in order to develop more effective diagnostic and treatment strategies.
MicroRNAs (miRNAs) are endogenous small non-coding RNAs found in various bodily fluids, including serum or plasma (5, 6). In mammals, more than 2,500 types of miRNAs are known to control 30–90% (7–9) of gene expression. They are involved in modulating diverse biological processes, including inflammation, cell cycle regulation, stress responses, differentiation, apoptosis, and cell migration (10). Numerous studies have demonstrated that genomic alterations in miRNA genes play a crucial role in tumor development (5).
The regulatory patterns of miRNAs are closely associated with the diagnosis, staging, progression, and characteristics of tumors; in some cases, miRNAs can serve as direct targets for cancer gene therapy (9, 11). Recent studies indicate that various cells, including cancer cells, secrete miRNAs into bodily fluids through extracellular vesicles (EVs) including exosomes. In this paper, according to the latest International Society for Extracellular Vesicles (ISEV) guidelines (12), we use the term EV instead of exosome.
EVs are produced by both normal and cancerous cells and act as pivotal messengers between cells by transporting bioactive substances to both nearby and distant regions. This process plays a crucial role in fostering the onset, invasion, and spread of tumors (13). Additionally, EV-associated miRNAs (EV-miRNAs) contribute to regulating the response of the tumor microenvironment, potentially stimulating or suppressing cancer cell growth. These findings imply a potentially meaningful role in guiding both the diagnosis and prognosis of tumors (13, 14). The progression of sarcoma is also reported to be regulated by miRNAs and EVs (15). However, reports describing the association between AS and miRNAs are limited. Although it was reported that miR-497-5p was downregulated in AS tissue and that miR-497-5p suppresses the expression of calcium-activated potassium channel KCa3.1, contributing to the inhibition of AS malignancy development (16), there is currently a lack of information regarding the relationship between EV-miRNA profiles in the blood and the pathological conditions of AS patients.
To investigate novel biomarkers related to the diagnosis or disease activity of cutaneous AS, we conducted a microarray-based analysis of EV-miRNAs in the serum of healthy controls (HCs) and patients with cutaneous AS.
MATERIALS AND METHODS
Patients and blood serum samples
Blood serum samples of the patients were collected from Osaka University Hospital (Suita, Osaka, Japan). Serum EV-miRNAs for a miRNA microarray analysis were extracted from 15 cutaneous AS patients and 5 healthy controls (HCs) (Fig. 1a). Quantitative reverse transcription PCR (qRT-PCR) was performed on serum EV-miRNA samples from 6 of 15 AS patients, 6 patients with malignant melanoma (MM), and 6 HCs. The mean age of AS patients, MM patients, and HCs was 82.3 (range: 66–95), 68.8 (range: 61–101), and 75 (range: 64–93) years, respectively. Four of the 6 angiosarcoma patients had lymph node or distant metastases. Six MM patients were all in advanced stages including Stage IIIC and Stage IV according to the AJCC, 8th edition. Six HCs had no history of malignancy. The details of the qRT-PCR samples used in this comparison are given in Table SI. To compare the activity levels of EV-miRNAs at the initial diagnosis and after loading a higher tumor burden, we collected serum samples at both times from 3 patients with cutaneous AS (Table SII). For a 70-year-old man with cutaneous AS, serum samples were collected 4 times (at the time of the initial diagnosis [0 months] and 10, 15, and 16 months later). The third and fourth serum samples were collected at the terminal stage with anemia, and the patient died 12 days after the fourth collection. Institutional Review Board approval for the use of the samples was obtained from Osaka University Hospital. According to the Declaration of Helsinki, written informed consent was obtained from all patients and healthy volunteers included in this study.
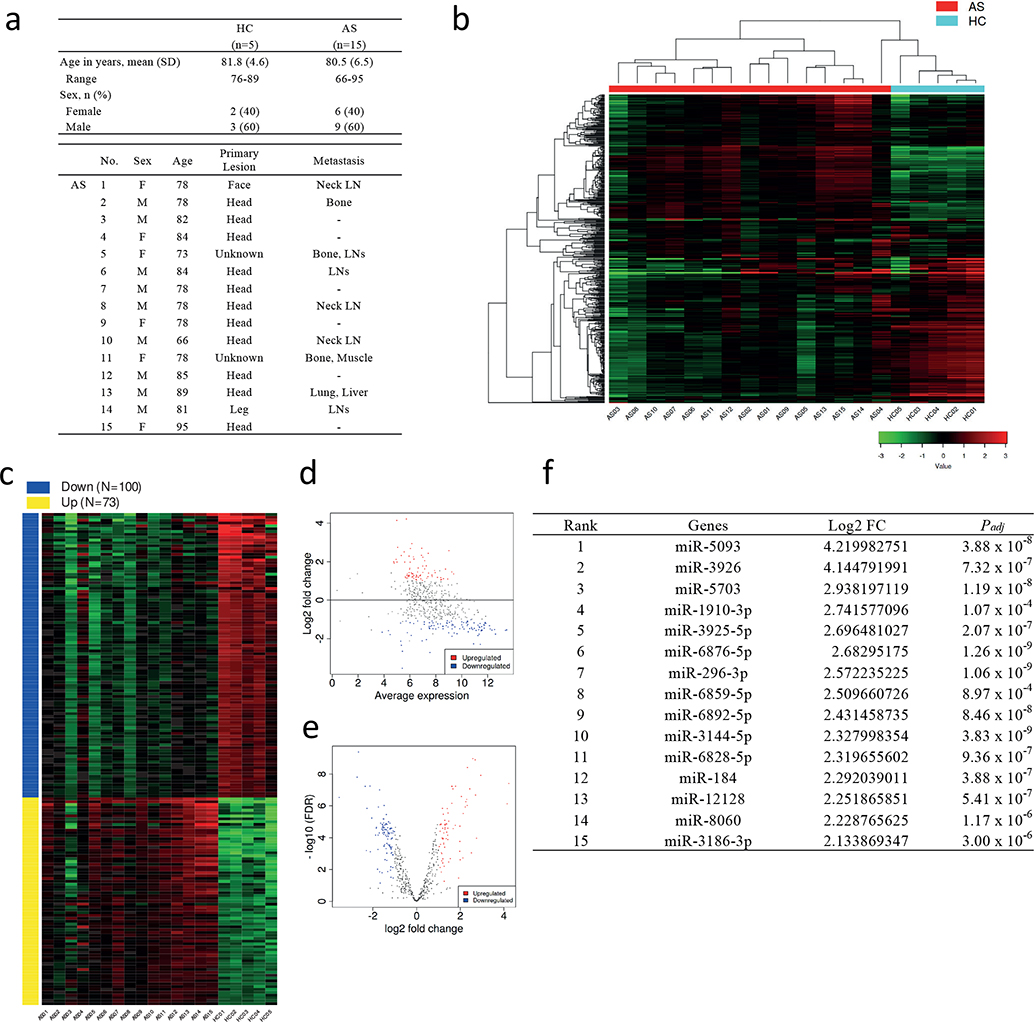
Fig. 1. Significantly upregulated and downregulated extracellular vesicle-associated microRNAs (EV-miRNAs) in angiosarcoma (AS) patients as detected by a microarray analysis. (a) Characteristics of the 15 AS patients and 5 healthy controls (HCs) included in the miRNA microarray analysis. (b) The gene expression levels of each sample are shown in the heatmap. (c) Seventy-three upregulated miRNAs and 100 downregulated miRNAs detected as differentially expressed genes. (d) Plot of the log2 fold change (Log2 FC) of upregulated and downregulated genes. (e) Volcano plot of upregulated and downregulated genes. (f) List of the top 15 upregulated miRNAs in AS patients shown with Log2 FC and adjusted p-value (Padj).
EV-miRNA extraction
The EV fraction from the blood serum was prepared using an EVAGLAXTM spin column (AGC, Tokyo, Japan). Blood serum was added to an EVAGLAXTM spin column and centrifuged at 4°C and 3000 × g for 5 min. For elution, 500 μL of Qiazol (Qiagen, Venlo, Netherlands) was added to the column and centrifuged at 4°C at 3000 × g for 5 min. The aqueous phase was collected by adding 99% chloroform. After the addition of 99% ethanol to the aqueous phase, total RNA was purified using an RNeasy Mini Kit (Qiagen).
miRNA microarray analysis and differential expression analysis
Extracted total EV-miRNA samples from 15 patients with AS and 5 HCs were subjected to a microarray analysis (3D-Gene®, TORAY, Tokyo, Japan). The patient profiles are shown in Fig. 1a.
A differential expression analysis of the microarray data was performed using an integrated web application (iDEP.94; http://bioinformatics.sdstate.edu/idep94/, accessed 12 January 2022). For pre-processing, only miRNAs with values of > 100 in at least 1 sample were kept, and missing values were treated as 0. Data values were subjected to logarithmic transformation, and the constant starting logarithm was set to 1. A heatmap was obtained using the 1,000 most variable genes, with the following settings: Distance: correlation, Linkage: average, Cutoff Z score: 4. Differentially expressed genes were detected by the DESeq2 method. Adjustment for multiple testing was performed by estimating the false discovery rate (FDR). FDR values are shown as adjusted p-values (Padj). The FDR cutoff and minimum fold-change were set to 0.1 and 2 respectively.
Cell lines and cell culture
Commercial human umbilical vein endothelial cells (HUVEC) (ATCC®, Manassas, VA, USA, PCS-100-010™) and human dermal microvascular endothelial cells neonatal (HDMVECn) (ATCC®, PCS-110-010™) were cultured in vascular cell basal medium (ATCC®, PCS-110-030™) supplemented with an Endothelial Cell Growth Kit-VEGF (ATCC®, PCS-110-041™). ISO-HAS B supplied by the Cell Resource Center for Biomedical Research Institute of Development, Aging and Cancer at Tohoku University was cultured with Dulbecco’s Modified Eagle’s medium (DMEM) supplemented with 10% fetal bovine serum (FBS). All cells were incubated at 37°C under 5% CO2, and the culture medium was changed 2–3 times per week.
qRT-PCR
cDNAs were reverse-transcribed from the samples containing miRNAs using the TaqMan MicroRNA Reverse Transcription Kit (Thermo Fisher, Waltham, MA, USA). Transcriptional products were amplified using the TaqMan Fast Advenced Master Mix (Thermo Fisher). PCR and quantification were performed using QuantStudio 7 (Thermo Fisher). Relative miRNA expression levels were calculated using the 2−ΔΔCt method. Raw data from serum EV-miRNAs and cell lines was normalized to miR-16 and RNU6B, respectively. TaqMan MicroRNA Assay for each cell line was performed with triplicate samples.
Statistical analysis
With the exception of the microarray analysis, all statistical analyses were performed using GraphPad Prism (GraphPad Software, MA, USA; https://www.graphpad.com/). Standard t-tests or one-way ANOVA and Tukey’s multiple comparison tests were used to assess the significance of differences in continuous variables. In all analyses, p-values or Padj values of < 0.05 were considered to indicate statistical significance.
Target gene prediction of miRNA and functional enrichment analysis
Target gene prediction of miRNAs was performed using 4 databases (miRBD, miRWalk, TargetScan, and miRTarBase). A Venn diagram was used to identify the target genes that appeared in each database. A target gene set was created by integrating the target genes of the 4 key miRNAs. Functional enrichment analysis was performed on the target gene set of miRNAs using Metascape (https://metascape.org/, accessed 5 February 2024) (17) and Reactome (https://reactome.org/, accessed 7 February 2024) (18).
Protein–protein interaction (PPI) network analysis
The PPI network analysis of the target gene set of the 4 miRNAs was performed using STRING (version 11.0, http://string-db.org/, accessed 15 February 2024). Cytoscape (version 3.7.1, https://cytoscape.org/, accessed 15 February 2024) was used for the visualization of PPI networks. A confidence score of 0.4 was used as the cutoff criterion.
RESULTS
Seventy-three upregulated miRNAs and 100 downregulated miRNAs were detected by miRNA microarray analysis
To detect differentially expressed miRNAs in AS patients in comparison with HCs, miRNA microarray analysis was performed using serum EV-miRNA samples from 15 AS patients and 5 HCs. Sample profiles are shown in Fig. 1a. The distribution and density plot of transformed data are shown in Fig. S1. The differential expression analysis identified 73 differentially upregulated genes and 100 differentially downregulated genes (Fig. 1b–e, Table SIII). Among the 73 miRNAs whose activity was significantly increased, the 15 miRNAs with the largest differences are shown as representative examples (Figs 1f and 2).
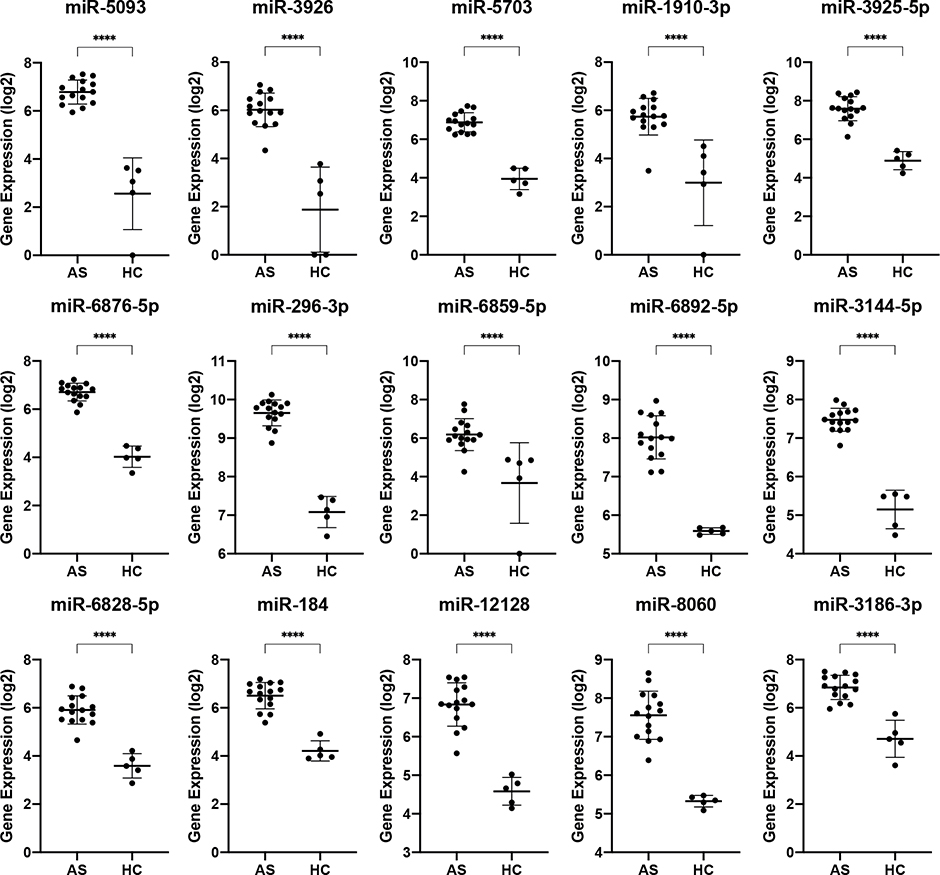
Fig. 2. Plot of expression levels of top 15 significantly upregulated microRNAs (miRNAs) in angiosarcoma (AS) patients. Top 15 upregulated serum extracellular vesicle-associated microRNAs (EV-miRNAs) detected as differentially expressed genes by a miRNA microarray analysis, in which 15 AS patients and 5 healthy controls were enrolled. Each EV-miRNA shown in this figure has Log2 fold change > 2 and an adjusted p-value (Padj) of < 0.0001.
Serum EV-derived miR-3926, miR-5703, miR-3925-5p, and miR-18 were upregulated in angiosarcoma patients in comparison with HCs and MM patients
To confirm the results of miRNA microarray analysis, qRT-PCR using the TaqMan MicroRNA Assay was performed on the extracted EV-miRNAs from AS and MM patients and HCs (n = 6 for each group). We found that miR-3926 (Fold Change = 4.220, Padj = 0.0415), miR-5703 (Fold Change = 5.470, Padj = 0.0120), and miR-3925-5p (Fold Change = 3.418, Padj = 0.0254) were significantly upregulated in patients with AS in comparison with HCs and mir-184 tended to be more highly expressed in AS patients than in HCs (Fold Change = 5.614, Padj = 0.0618). Moreover, miR-3926 (Fold Change = 1.651, Padj = 0.3692) and miR-3925-5p (Fold Change = 1.571, Padj = 0.3119) also tended to be more highly expressed in AS patients than in MM patients (Fig. 3a).
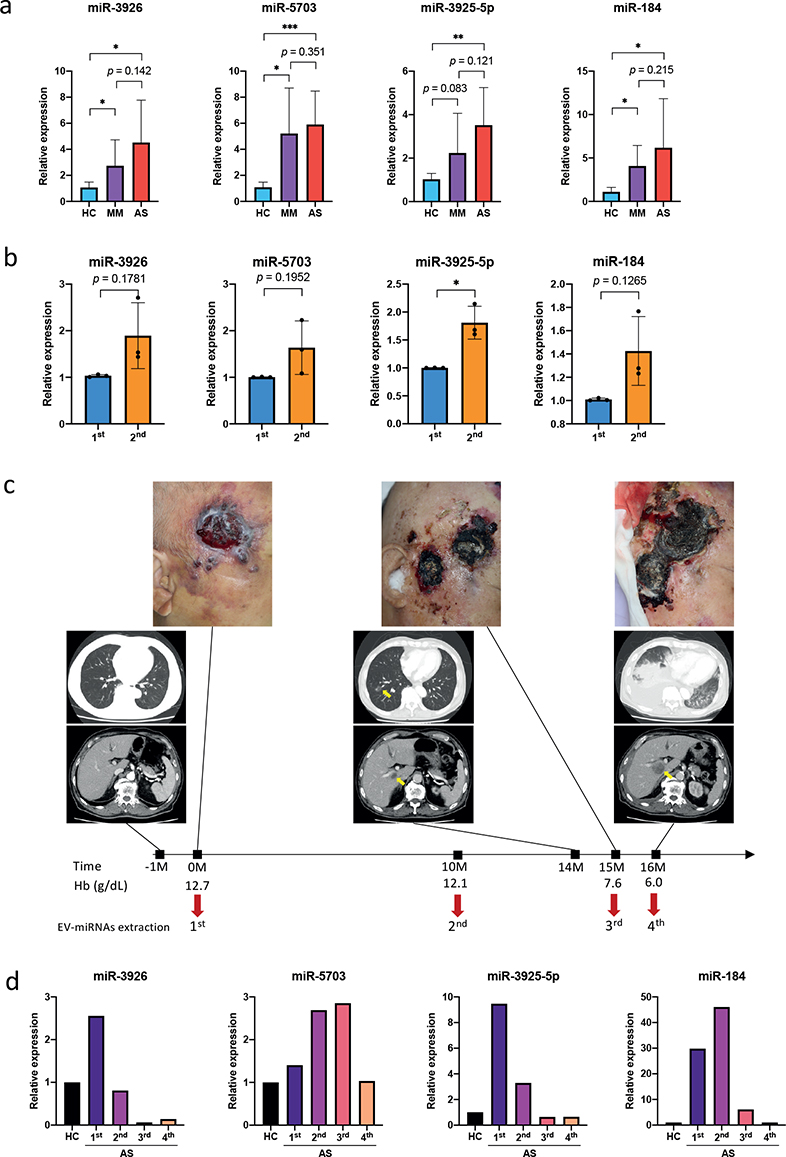
Fig. 3. Extracellular vesicle (EV)-derived miR-3926, miR-5703, miR-3925-5p, and miR-184 were upregulated in angiosarcoma (AS) patients. (a) Expression levels of serum EV-derived microRNA (EV-miRNA) were quantified by quantitative reverse transcription PCR using TaqMan MicroRNA Assays in 6 AS patients, 6 malignant melanoma (MM) patients, and 6 healthy controls (HCs). The expression levels of EV-derived miR-3926, miR-5703, miR-3925-5p, and miR-184 were upregulated (F value for each one-way ANOVA analysis was 3.635, 6.471, 4.350, and 1.089, respectively) in AS patients. In comparison with HCs, miR-3926 (Fold Change = 4.220, Padj = 0.0415), miR-5703 (Fold Change = 5.470, Padj = 0.0120), and miR-3925-5p (Fold Change = 3.418, Padj = 0.0254) were significantly upregulated in patients with AS. (b) Expression levels of 4 miRNAs were also upregulated in advanced AS patients. (c) Clinical course of a 70-year-old male with cutaneous AS. Yellow arrows indicate pulmonary or hepatic metastases, respectively. (d) The expression levels of miR-3926, miR-5703, miR-3925-5p and miR-184 in each EV-miRNAs extraction. *Adjusted p-value (Padj) < 0.05. *p < 0.05.
The expression levels of miR-3926, miR-5703, miR-3925-5p, and miR-184 were higher in serum collected after progression than in the serum collected at the initial visit
To compare the abundance of EV-miRNAs in serum collected at the initial visit and after progression, qRT-PCR using the TaqMan MicroRNA Assay was performed for 3 patients with AS. We found that miR-3926 (Fold Change = 1.833, p = 0.1781), miR-5703 (Fold Change = 1.629, p = 0.1952), and miR-184 (Fold Change = 1.412, p = 0.1265) tended to be more upregulated in the serum collected after progression than at the initial visit. For miR-3925-5p (Fold Change = 1.806, p = 0.0407), we found a significant difference (Fig. 3b).
Serum expression levels of EV-derived miR-3926, miR-5703, miR-3925-5p and miR-184 showed a correlation with the disease progress in a 70-year-old angiosarcoma patient
When we compared the expression of 4 miRNAs in a 70-year-old patient with AS on the scalp, whose condition worsened, leading to death over a 16-month period (Fig. 3c), we found that although there were differences in timing, all miRNAs reached peak activity levels during the course of the disease, and the activity decreased in the final stage (Fig. 3d).
miR-3926, miR-5703, miR-3925-5p, and miR-184 were upregulated in an angiosarcoma cell line (ISO-HAS B) in comparison with normal human vascular endothelial cell lines (HUVEC and HDMVECn)
To investigate whether AS cells could be the source of miRNA production, we performed a TaqMan MicroRNA Assay using an AS cell line (ISO-HAS B) and normal human vascular endothelial cell lines (HUVEC and HDMVECn). The expression levels of miR-3926 (Fold Change = 1.86, p = 0.0474), miR-5703 (Fold Change = 3.55, p = 0.1129), miR-3925-5p (Fold Change = 1.45, p = 0.1196), and miR-184 (Fold Change = 3.29, p = 0.0267) were elevated in ISO-HAS B in comparison with HUVEC. ISO-HAS B also showed higher expression levels of miR-3926 (Fold Change = 1.48, p = 0.142), miR-5703 (Fold Change = 1.99, p = 0.182), and miR-184 (Fold Change = 6.30, p = 0.0006) in comparison with HDMVECn (Fig. 4).
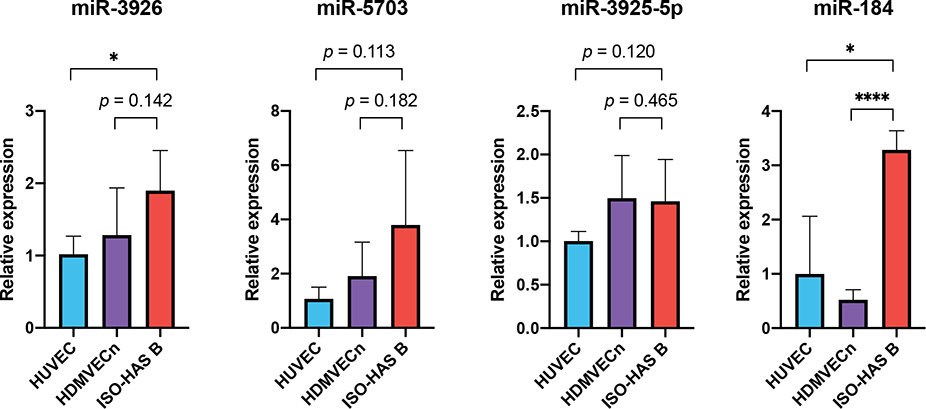
Fig. 4. miR-3926, miR-5703, miR-3925-5p, and miR-184 were upregulated in angiosarcoma (AS) cell lines. Expression of microRNAs (miRNAs) in an AS cell line (ISO-HAS B) and benign human endothelial cell lines (HUVEC and HDMVECn.) were compared by quantitative reverse transcription PCR. ISO-HAS B showed significant upregulation of miR-5703 (Padj = 0.0078 and Padj = 0.0261, respectively) and miR-184 (Padj = 0.0214 and Padj = 0.0053, respectively) in comparison with HUVEC and HDMVECn (F value for each one-way ANOVA analysis was 12.14 and 14.06, respectively). ISO-HAS B also showed a tendency to upregulations in miR-3926 and miR-3925-5p, while the differences were not significant (F value for each one-way ANOVA analysis was 3.154 and 3.237, respectively). The experiment was performed 3 times with triplicate samples for each cell line. HUVEC: human umbilical vein endothelial cell; HDMVECn: human dermal microvascular endothelial cells neonatal. *p < 0.05, **p < 0.01.
The gene set of predicted targets of miR-3926, miR-5703, miR-3925-5p, and miR-184
We then attempted to predict the targets of miR-3926, miR-5703, miR-3925-5p, and miR-184 and found 41, 31, 5, and 1 candidate genes for each miRNA, respectively, using online databases (Fig. 5a). The Metascape analysis (including GO and KEGG analyses) of these 77 predicted genes (1 gene, SPRY3, was shared by miR-3926 and miR-3925-5p) revealed that the target gene set was related to the regulation of the expression and activity of MECP2 (Fig. 5b). The Reactome pathway analysis also showed a relationship between the gene set and the regulation of the expression and activity of MECP2 (Fig. 5c).
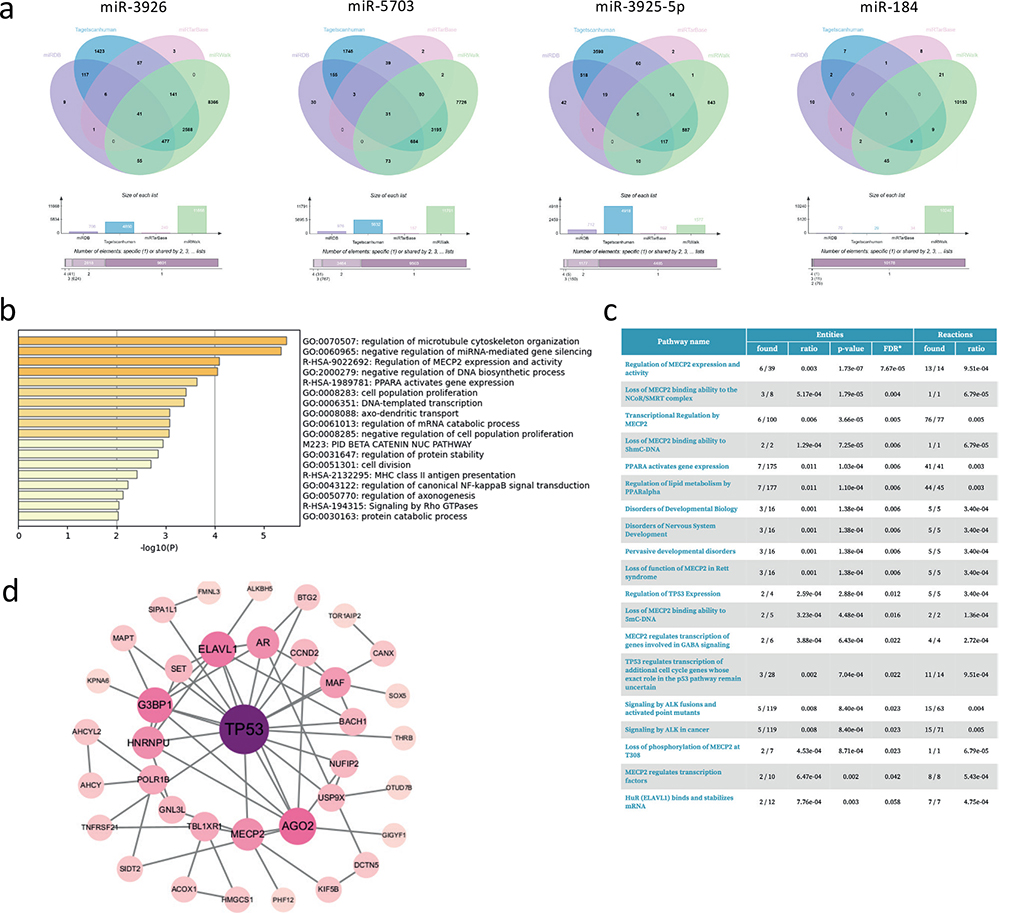
Fig. 5. Target genes of miR-3926, miR-5703, miR-3925-5p, and miR-184 were found to be possibly related to the regulation of MECP2 and TP53 by a functional enrichment analysis and protein–protein interaction (PPI) network analysis, respectively. (a) Prediction of target genes of miR-3926, miR-5703, miR-3925-5p, and miR-184 was performed using 4 databases (miRBD, miRWalk, TargetScan, and miRTarBase). Seventy-seven genes were detected as target genes of 4 microRNAs (miRNAs). (b) Functional enrichment analysis by Metascape (http://www.metascape.com/) revealed that the regulation of the MECP2 expression and activity was significantly enriched. (c) A Reactome pathway analysis also showed that regulation of the MECP2 expression and activity was significantly enriched. (d) Shared PPI network diagram of 77 genes (excluding disconnected nodes in the network). Increasing node color and size indicate an increase in the number of interactions between genes. The lines between 2 nodes represent their correlation. TP53 was detected as a hub gene.
TP53 is a predicted hub gene of the targets of miR-3926, miR-5703, miR-3925-5p, and miR-184
To explore the connectivity between the 77 predicted target genes of the 4 miRNAs, calculations were performed using the cytoHubba application of the Cytoscape software program. A PPI network containing 37 nodes and 62 edges was obtained, and TP53 was identified as a hub gene (Fig. 5d).
DISCUSSION
Cutaneous AS is known as rare skin malignancy featuring severe invasiveness, metastatic potential, and high recurrence rate. Currently, the most widely recognized effective treatment for this condition is early surgical removal (19). We aim to use a convenient clinical blood test to improve diagnostic accuracy and patient survival rates in patients with this disease. Through a thorough examination of the relevant literature (20–22), we learned that certain EV-miRNAs are associated with tumor activity. This provides valuable information for exploring new and more practical diagnostic and therapeutic approaches. Therefore, we believe that certain EV-miRNAs may serve as novel biomarkers for cutaneous AS, offering new insights into the diagnosis and treatment of the disease. However, previous studies on the relationship between AS and miRNAs are limited. Although there is a report investigating miRNAs derived from AS tissues (16), there are no reports on EV-miRNAs.
Therefore, we conducted a differential gene expression analysis of serum EV-miRNA samples between cutaneous AS patients and HCs. The results indicated that the expression of 73 miRNAs was significantly upregulated, while that of 100 miRNAs was significantly downregulated in AS patients. This suggests that in the specific context of cutaneous AS, the regulatory behaviors of these miRNAs undergo significant changes. Because of technical feasibility, focusing on a preliminary analysis of the top 15 genes we obtained, we identified the following 4 genes from the 15 genes as proposed biomarkers: miR-3926, miR-5703, miR-3925-5p, and miR-184.
We confirmed by qRT-PCR that the expression of these 4 miRNAs obtained from the microarray analysis was significantly elevated in AS patients in comparison with HCs. Moreover, these 4 miRNAs tended to be more highly expressed in patients with AS than in those with MM. We reviewed previous reports of EV-miRNAs in other skin malignancies and found that they were very limited. We found only reports on MM (Table SIV) (23–27) and miR-3926, miR-5703, miR-3925-5p, and miR-184 have not been reported as EV-miRNAs associated with MM. Thus, these 4 miRNAs are thought to be exclusively upregulated in AS patients.
We found that the expression of these 4 miRNAs was elevated in the advanced stage of the disease in comparison with that in the early stage. Although miR-3926 and miR-3925-5p were not statistically significant in this experimental setting, the expression levels of miRNAs were higher in the AS cell line. Thus, it is suggested that these miRNAs originated from AS cells and are crucial in regulating genetic activity in AS.
To analyze miRNAs chronologically along with the disease course, sera were collected 4 times from a 70-year-old male patient. The results revealed that the expression levels decreased during the terminal phase with severe anemia. This suggests that these 4 miRNAs may be useful as biomarkers in the early or advanced stages of the disease, but not in the terminal stages. A possible reason for the decreased expression in the terminal stage could be that the ability to produce these miRNAs is reduced due to the decreased function of the organism or that these miRNAs are trapped by intense inflammation of the pleura, which is characteristic of AS metastasis; however, this remains to be clarified.
Using online databases and analysis tools, we attempted to predict the targets of these 4 miRNAs and found that they were significantly related to the regulation of the Methyl-CpG binding protein 2 (MECP2) expression and activity. The MECP2 gene is known as a critical epigenetic regulator of gene transcription (28). While the relationship between MECP2 and various types of cancer, including breast cancer, colorectal cancer, and pancreatic cancer, has been previously reported, the relevant molecular pathways varied depending on the cancer type (28).
In addition, the connectivity between genes was calculated using the Cytoscape software program. A set of 77 shared genes was used to construct a PPI network, which consisted of 37 nodes and 62 edges. Genes with high connectivity are expected to play a significant role in cancer development. We found that the TP53 gene exhibited the highest correlation. A literature review revealed that TP53 gene mutations have been detected in skin cance and, under certain conditions, TP53 gene mutations resemble those specific to ultraviolet radiation exposure (29). As for the relationship between p53 and miRNAs, the positive feedback regulatory network formed by p53 and miR-34 family is well known and inhibits the growth and metastasis of tumor cells (30). The downregulation of miR-34a was reported in squamous cell carcinoma tissue (31). In this study, downregulation of the miR-34 family in circulating EV-miRNAs of AS patients was not detected. It is also reported that breast cancer, soft tissue sarcoma, and bone sarcomas account for over 50% of tumors in carriers of TP53 mutations (32). In AS tissue, the deletion or mutation of TP53 was rarely detected and p53 protein was often immunohistochemically positive (33). The positivity for p53 protein is generally attributed to a TP53 gene mutation, but AS tissues express p53 despite the absence of TP53 mutations on the basis of an unknown mechanism (33). Our present analysis supposes that epigenetic, not genetic, regulation of TP53 via MECP2 may be underlain for p53 expression.
In conclusion, miR-3926, miR-5703, miR-3925-5p, and miR-184 within circulating EV may serve as potential tumor markers of AS. We believe that further studies on the predicted target genes of EV-miRNAs including TP53 or MECP2 may lead to the development of new treatments for AS.
ACKNOWLEDGEMENTS
The authors would like to thank Mr Hiroaki Tojo for technical support.
IRB approval status: This study was approved by the research ethics committee of Osaka University Hospital (approval number 15019).
Data availability: The datasets generated and/or analyzed during the current study are available from the corresponding author on reasonable request.
REFERENCES
- Breiteneder-Geleff S, Soleiman A, Kowalski H, Horvat R, Amann G, Kriehuber E, et al. Angiosarcomas express mixed endothelial phenotypes of blood and lymphatic capillaries. Am J Pathol 1999; 154: 385–394. https://doi.org/10.1016/S0002-9440(10)65285-6
- Bi S, Chen S, Wu B, Cen Y, Chen J. The effectiveness of different treatment modalities of cutaneous angiosarcoma: results from meta-analysis and observational data from SEER Database. Front Oncol 2021; 11: 627113. https://doi.org/10.3389/fonc.2021.627113
- Patel AM, Ryu JH. Angiosarcoma in the lung. Chest 1993; 103: 1531–1535. https://doi.org/10.1378/chest.103.5.1531
- Zhang C, Xu G, Liu Z, Xu Y, Lin F, Baklaushev VP, et al. Epidemiology, tumor characteristics and survival in patients with angiosarcoma in the United States: a population-based study of 4537 cases. Jpn J Clin Oncol 2019; 49: 1092–1099. https://doi.org/10.1093/jjco/hyz113
- Zhang L, Huang J, Yang N, Greshock J, Megraw MS, Giannakakis A, et al. microRNAs exhibit high frequency genomic alterations in human cancer. Proc Natl Acad Sci 2006; 103: 9136–9141. https://doi.org/10.1073/pnas.0508889103
- Cortez MA, Bueso-Ramos C, Ferdin J, Lopez-Berestein G, Sood AK, Calin GA. MicroRNAs in body fluids: the mix of hormones and biomarkers. Nat Rev Clin Oncol 2011; 8: 467–477. https://doi.org/10.1038/nrclinonc.2011.76
- Lewis BP, Burge CB, Bartel DP. Conserved seed pairing, often flanked by adenosines, indicates that thousands of human genes are microRNA targets. Cell 2005; 120: 15–20. https://doi.org/10.1016/j.cell.2004.12.035
- Friedman RC, Farh KK, Burge CB, Bartel DP. Most mammalian mRNAs are conserved targets of microRNAs. Genome Res 2009; 19: 92–105. https://doi.org/10.1101/gr.082701.108
- Miranda KC, Huynh T, Tay Y, Ang YS, Tam WL, Thomson AM, et al. A pattern-based method for the identification of MicroRNA binding sites and their corresponding heteroduplexes. Cell 2006; 126: 1203–1217. https://doi.org/10.1016/j.cell.2006.07.031
- Annese T, Tamma R, De Giorgis M, Ribatti D. microRNAs biogenesis, functions and role in tumor angiogenesis. Front Oncol 2020; 10: 581007. https://doi.org/10.3389/fonc.2020.581007
- Yanaihara N, Caplen N, Bowman E, Seike M, Kumamoto K, Yi M, et al. Unique microRNA molecular profiles in lung cancer diagnosis and prognosis. Cancer Cell 2006; 9: 189–198. https://doi.org/10.1016/j.ccr.2006.01.025
- Welsh JA, Goberdhan DCI, O’Driscoll L, Buzas EI, Blenkiron C, Bussolati B, et al. Minimal information for studies of extracellular vesicles (MISEV2023): from basic to advanced approaches [published correction appears in J Extracell Vesicles 2024; 13: e12451]. J Extracell Vesicles 2024; 13: e12404. https://doi.org/10.1002/jev2.12451
- Li B, Cao Y, Sun M, Feng H. Expression, regulation, and function of exosome-derived miRNAs in cancer progression and therapy. FASEB J 2021; 35: e21916. https://doi.org/10.1096/fj.202100294RR
- Urabe F, Kosaka N, Ito K, Kimura T, Egawa S, Ochiya T. Extracellular vesicles as biomarkers and therapeutic targets for cancer. Am J Physiol Cell Physiol 2020; 318: C29–C39. https://doi.org/10.1152/ajpcell.00280.2019
- Kohama I, Kosaka N, Chikuda H, Ochiya T. An insight into the roles of MicroRNAs and exosomes in sarcoma. Cancers 2019; 11: 428. https://doi.org/10.3390/cancers11030428
- Chen Y, Kuang D, Zhao X, Chen D, Wang X, Yang Q, et al. miR-497-5p inhibits cell proliferation and invasion by targeting KCa3.1 in angiosarcoma. Oncotarget 2016; 7: 58148–58161. https://doi.org/10.18632/oncotarget.11252
- Zhou Y, Zhou B, Pache L, Chang M, Khodabakhshi AH, Tanaseichuk O, et al. Metascape provides a biologist-oriented resource for the analysis of systems-level datasets. Nat Commun 2019; 10: 1523. https://doi.org/10.1038/s41467-019-09234-6
- Wu G, Haw R. Functional interaction network construction and analysis for disease discovery. Methods Mol Biol 2017; 1558: 235–253. https://doi.org/10.1007/978-1-4939-6783-4_11
- Mendenhall WM, Mendenhall CM, Werning JW, Reith JD, Mendenhall NP. Cutaneous angiosarcoma. Am J Clin Oncol 2006; 29: 524–528. https://doi.org/10.1097/01.coc.0000227544.01779.52
- Sun Z, Shi K, Yang S, Liu J, Zhou Q, Wang G, et al. Effect of exosomal miRNA on cancer biology and clinical applications. Mol Cancer 2018; 17: 147. https://doi.org/10.1186/s12943-018-0897-7
- Masoudi MS, Mehrabian E, Mirzaei H. MiR-21: a key player in glioblastoma pathogenesis. J Cell Biochem 2017; 119: 1285–1290. https://doi.org/10.1002/jcb.26300
- Liu B, Shyr Y, Cai J, Liu Q. Interplay between miRNAs and host genes and their role in cancer. Brief Funct Genomics 2019; 18: 255–266. https://doi.org/10.1093/bfgp/elz002
- Tengda L, Shuping L, Mingli G, Jie G, Yun L, Weiwei Z, et al. Serum exosomal microRNAs as potent circulating biomarkers for melanoma. Melanoma Res 2018; 28: 295–303. https://doi.org/10.1097/CMR.0000000000000450
- Pfeffer SR, Grossmann KF, Cassidy PB, Yang CH, Fan M, Kopelovich L, et al. Detection of exosomal miRNAs in the plasma of melanoma patients. J Clin Med 2015; 4: 2012–2027. https://doi.org/10.3390/jcm4121957
- Alegre E, Sanmamed MF, Rodriguez C, Carranza O, Martín-Algarra S, González A. Study of circulating microRNA-125b levels in serum exosomes in advanced melanoma. Arch Pathol Lab Med 2014; 138: 828–832. https://doi.org/10.5858/arpa.2013-0134-OA
- Xiao D, Barry S, Kmetz D, Egger M, Pan J, Rai SN, et al. Melanoma cell-derived exosomes promote epithelial–mesenchymal transition in primary melanocytes through paracrine/autocrine signaling in the tumor microenvironment. Cancer Lett 2016; 376: 318–327. https://doi.org/10.1016/j.canlet.2016.03.050
- Li J, Chen J, Wang S, Li P, Zheng C, Zhou X, et al. Blockage of transferred exosome-shuttled miR-494 inhibits melanoma growth and metastasis. J Cell Physiol 2019; 234: 15763–15774. https://doi.org/10.1002/jcp.28234
- Nejati-Koshki K, Roberts C-T, Babaei G, Rastegar M. The epigenetic reader methyl-CpG-binding protein 2 (MeCP2) is an emerging oncogene in cancer biology. Cancers 2023; 15: 2683. https://doi.org/10.3390/cancers15102683
- Basset-Séguin N, Molès JP, Mils V, Dereure O, Guilhou JJ. TP53 tumor suppressor gene and skin carcinogenesis. J Invest Dermatol 1994; 103: 102S–106S. https://doi.org/10.1111/1523-1747.ep12399372
- Pan W, Chai B, Li L, Lu Z, Ma Z. p53/MicroRNA-34 axis in cancer and beyond. Heliyon 2023; 9: e15155. https://doi.org/10.1016/j.heliyon.2023.e15155
- Lefort K, Brooks Y, Ostano P, Cario-André M, Calpini V, Guinea-Viniegra J, et al. A miR-34a-SIRT6 axis in the squamous cell differentiation network. EMBO J 2013; 32: 2248–2263. https://doi.org/10.1038/emboj.2013.156
- Olivier M, Hollstein M, Hainaut P. TP53 mutations in human cancers: origins, consequences, and clinical use. Cold Spring Harb Perspect Biol 2010; 2: a001008. https://doi.org/10.1101/cshperspect.a001008
- Italiano A, Chen CL, Thomas R, Breen M, Bonnet F, Sevenet N, et al. Alterations of the p53 and PIK3CA/AKT/mTOR pathways in angiosarcomas: a pattern distinct from other sarcomas with complex genomics. Cancer 2012; 118: 5878–5887. https://doi.org/10.1002/cncr.27614