ORIGINAL REPORT
Seasonal Variation of the Burden of Atopic Dermatitis in Finnish Primary Care: A Database Study on Effects of Weather and Air Quality
Emilia RÄISÄNEN  , Anita REMITZ and Alexander SALAVA
Helsinki University Hospital, Department of Dermatology and Allergology, Helsinki, Finland
The burden of atopic dermatitis has been increasing in Finland during recent decades and seems to vary seasonally. The aim was to investigate the effect of season and weather factors on patient numbers of primary care. Data bank information of the Finnish Institute for Health and Welfare was analysed for frequency of atopic dermatitis patients in the primary care of Helsinki during 2018–2023. In addition, the seasonal burden was compared with weather data from the Finnish Meteorological Institute. Patient numbers varied significantly during the year (p = 0.028). There was a recurrent seasonal variation with most atopic dermatitis diagnoses in January, February, March, and November and the least in July and August. A significant inverse association was observed between atopic dermatitis patients and outside temperature (p = 0.004) and UV Index (p = 0.008). Low air quality was associated with a higher burden in primary care (p = 0.013). There was no significant association regarding rain (p = 0.103) or relative air humidity (p = 0.392). The burden of atopic dermatitis in primary care shows a significant seasonal variation. There are specific weather parameters that follow similar patterns and likely comprise important extrinsic pathogenetic factors. It is reasonable to address the changing burden of atopic dermatitis with seasonally directed medical measures, education, and resources.
SIGNIFICANCE
We carried out a combined analysis of a large primary care database with weather parameters for Helsinki, the capital city of Finland. Atopic dermatitis caused a substantial burden in primary care and showed significant seasonal variations. Weather-related factors likely play important roles regarding disease activity and recurrence of disease flairs. There are specific meteorological parameters (temperature, UV Index, air pollution), which follow similar patterns with patient numbers and likely comprise important pathogenetic mechanisms that explain the seasonal variation. It would be reasonable to address the changing burden of atopic dermatitis with seasonally directed medical measures, education, and resources.
Key words: atopic dermatitis; seasonal variation; effects of weather; air quality.
Citation: Acta Derm Venereol 2025; 105: adv43041. DOI: https://doi.org/10.2340/actadv.v105.43041.
Copyright: © 2025 The Author(s). Published by MJS Publishing, on behalf of the Society for Publication of Acta Dermato-Venereologica. This is an Open Access article distributed under the terms of the Creative Commons Attribution-NonCommercial 4.0 International License (https://creativecommons.org/licenses/by-nc/4.0/).
Submitted: Jan 28, 2025; Accepted after revision: Apr 10, 2025; Published: May 12, 2025.
Corr: Emilia Räisänen, University of Helsinki, Department of Dermatology and Allergology; Helsinki University Hospital, Department of Dermatology and Allergology; Meilahdentie 2, 00250 Helsinki, Finland. E-mail: emilia.k.raisanen@helsinki.fi
Competing interests and funding: The authors have no conflicts of interest to declare.
Grant of the Teachers’ Academy of the University of Helsinki, Finland. Open access funded by Helsinki University Library.
INTRODUCTION
A topic dermatitis (AD) causes a significant medical and economic burden in primary care and appears to be increasing in recent years, notably in adult and elderly patients (1, 2). In many countries, especially in Northern Europe, the disease is known to vary substantially according to seasons and the associated weather changes, such as the outside temperature or amount of sunshine. Globally, the population affected by AD has reached 2–3%, but there is a high geographical variety (3). Seasonal changes in the AD burden have been reported from different countries and specific weather and extrinsic factors seem to drive the changes.
The pathogenesis of AD is grounded on disruption of the epidermal barrier, different immunological mechanisms, and a microbial dysbiosis of the skin (4). As a barrier to the outside world, all these factors are strongly influenced by weather. Previously, there have been reports concerning reciprocal associations of severity and burden with the outside temperature. This has been explained by skin dryness in colder winter months (epidermal barrier disruption, effect on the microbiome) and decreased amount of UV radiation (immunological modulation). Possible AD flares in summer and in humid warm countries are believed to be caused by an increase in air humidity, sweating, and skin microbial colonization, e.g., staphylococci. Transient receptor potential vanilloid ion channels (TRPVs) have been described as major components of temperature-induced defects in skin barrier function and itch (5). In addition, air pollution has been reported to increase the burden of AD, although the mechanisms have remained unclear (6).
In our former studies, we could show the high burden AD causes in patients of all age groups of Finnish healthcare (7–9). In this study our aim is to investigate AD patient numbers in primary care in Helsinki, Finland, and the effect of season, weather factors, and air quality.
MATERIALS AND METHODS
Patient visits in primary care
Number of patients and consultations were retrieved from the databank of the Finnish Institute for Health and Welfare (10). This is an open access database that comprises all patient visits in Finnish public healthcare. Outpatient doctors’ visits during 2018–2023 in the public primary healthcare sector of the city of Helsinki were included. In 2023, Helsinki had a total of 674,500 inhabitants. Our study was approved by the ethical committee of Helsinki University, Finland (reference number: 14/2024).
Criteria for the data collection and analysis were doctor’s outpatient visit, diagnosis of atopic dermatitis (ICD-10 code: L20, including L20.8, L20.9), and public healthcare. All age groups (0–99 years) and both sexes were included. We searched for all patient visits in the Helsinki area. The database has been characterized in detail in our former publications (2,7)
Weather parameters
We acquired validated weather data from the Finnish Meteorological Institute (11). The database included past weather measurements of urban observation stations in Kumpula and Mäkelänkatu, Helsinki, Finland. Weather factors comprised outside temperature (°Celsius), relative air humidity (%), ultraviolet radiation (UV Index), rainfall (mm), and air quality (Air Quality Index, AQI), which were measured within Helsinki. For all the different factors, we counted a mean value for every month (n = 72, monthly cumulative) during the years 2018–2023.
Rainfall was measured with a standard rain gauge and 1 millimetre of rainfall equals 1 litre of rainwater per square metre. Relative air humidity is used to measure actual perceived humidity. It considers the actual amount of water vapour in the outside air compared with the total amount of vapour that can exist in the air at its current temperature. The UV Index is used to describe the amount of UV radiation. We included average UV Indices during daily periods of 06.00 h until 22.00 h, as in Finland during the night and early hours of the morning there is no substantial sunshine or measurable UV radiation. The AQI represents the amount of air pollution in the air and can consider nitrogen dioxide (NO2), sulphur dioxide (SO2), inhalable particulate matter (PM10), fine particulate matter (PM2,5), ozone (O3), and odorous sulphur compounds (TRS) when calculated. The AQI ranges from 1 (good) to 5 (very poor) (11).
Statistical analysis
The statistical analyses were conducted with the IBM SPSS Statistics program (version 29.0.0.0; IBM Corp, Armonk, NY, USA). Differences between months and seasonal variations were compared with the Mann–Whitney U- and Kruskal–Wallis tests; p-values < 0.05 were considered statistically significant and we used a confidence interval of 95%.
The association between different weather factors and number of AD patients was analysed with linear regression models. The variables were absolute patient numbers (dependent variables) and different numeric weather parameters such as temperature, amount of rain, relative air humidity, UV Index, and AQI (predictor variables).
RESULTS
Database characteristics
Patients. AD caused a substantial burden in primary care in Helsinki, with an average of 229 doctor’s visits per month (range 119–424 visits per month). It was one of the most frequent skin-related conditions diagnosed during the study period. On average, 2,750 AD patients per year attended primary care and this comprised 0.50% of all patient visits. The relatively high proportion of AD patients in primary care remained similar during different years of the study period and ranged from 0.46% (2018) to 0.59% (2021).
Patients with AD had on average 1.14 primary care visits per year. There were more female patients (mean 1,683 per year) than male patients (mean 1,066 per year) (Table I). The gender proportions remained similar over the study period with a substantial female predominance. The total number of patients in primary care and the number of patients with AD decreased after the year 2020, but there was a slight increase in patient numbers observed again in 2023.
| Item | 2018 | 2019 | 2020 | 2021 | 2022 | 2023 |
| All AD patients, n | 3,658 | 3,424 | 2,951 | 2,373 | 2,029 | 2,065 |
| Percentage of all visits | 0.46 | 0.50 | 0.48 | 0.59 | 0.56 | 0.47 |
| All diagnoses | 792,380 | 687,383 | 621,251 | 400,189 | 359,679 | 435,829 |
| Males (% of all) | 1,371 (37.48) | 1388 (40.54) | 1,118 (37.89) | 920 (38.77) | 810 (39.92) | 790 (38.39) |
| Females (% of all) | 2,287 (62.52) | 2,036 (59.46) | 1,833 (62.11) | 1,453 (61.23) | 1,219 (60.08) | 1,268 (61.61) |
| Visits per patient | 1.2 | 1.2 | 1.1 | 1.1 | 1.1 | 1.1 |
| Outside temperature (°Celsius), mean (range) | 7.18 (–7.30–21.30) |
7.23 (–5.10–17.60) |
8.39 (0.90–18.10) |
6.35 (–7.00–21.60) |
7.11 (–2.60–19.40) |
6.93 (–3.80–17.80) |
| Rain (mm), mean (range) | 42.21 (7.80–68.40) | 64.53 (6.40–101.60) | 71.88 (44.00–108.40) | 59.08 (27.10–132.40) | 60.45 (14.90–127.50) | 71.52 (2.80–166.10) |
| Relative air humidity (%), mean (range) | 76.90 (54.56–88.68) | 78.02 (59.07–89.85) | 77.60 (61.32–88.22) | 78.07 (62.13–90.87) | 78.61 (64.08–93.06) | 77.90 (55.11–92.84) |
| UV Indexa, mean (range) | 0.70 (0.02–1.78) | 0.66 (0.03–1.94) | 0.74 (0.02–2.34) | 0.70 (0.02–2.16) | 0.75 (0.02–2.08) | 0.72 (0.04–1.93) |
| Air Quality Indexb, mean (range) | 1.77 (1.44–2.23) | 1.64 (1.31–2.30) | 1.55 (1.26–1.88) | 1.57 (1.15–2.05) | 1.58 (1.19–2.34) | 1.62 (1.18–2.32) |
| aUV Index ranges from 0 (lowest) to 17+ (highest); bAir Quality Index ranges from 1 (good) to 5 (very poor). AD: atopic dermatitis; UV: ultraviolet. | ||||||
Weather data. The weather factors analysed showed a significant seasonal variation but remained very similar when considering different years during the study period 2018–2023. The mean outside temperature was highest in June (17.6°C), July (18.8°C) and August (17.7°C), whereas the coldest months were December (–1.6°C), January (–2.0°C), and February (–2.8°C). The UV Index and relative air humidity were significantly associated with the outside temperature in a direct proportional manner. Relative air humidity and rainfall showed a reverse proportionality with AQI, i.e., the air quality was worse during relatively humid and rainy months. AQI showed no significant association with outside temperature or UV Index. The air quality was lowest during springtime. The amount of rain showed a lesser seasonal variation. The highest amount rain was observed in January (mean 83.3 mm), August (mean 92.1 mm), and October (mean 82.6 mm).
Seasonal variation in AD patient numbers
The number of AD patients in primary care showed a significant seasonal variation during the study period (p = 0.028, CI: 0.000–0.066). During 2018–2023, there was a similar recurrent seasonal variation with most AD patient consultations in January (mean 272), February (mean 263), March (mean 262), and November (mean 268), and the least in July (mean 169) and August (mean 188). Relatively low patient numbers were seen in December and April. The seasonal variation in patient numbers recurred every year in a similar manner. The data are presented in Tables II and III and Figs. 1 and 2.
| Comparison (AD patient numbers) | Results (p-values) | Description |
| Different months (years 2018–2023) | 0.028a (CI 0.000–0.066) 0.128b (CI 0.070–0.236) |
aComparison of highest number of patients: March, November, and lowest number of patients: July, August; bcomparison of all months with each other |
| Outside temperature (°Celsius) | 0.004c Bd: –0.39 (CI –0.065 to –0.013) SE (B)e: 0.013 |
Dependent variable: temperature (mean) Independent variable: number of patients (n) |
| Rain amount (mm) | 0.103c Bd: –0.89 (CI –0.196–0.018) SE (B)e: 0.054 |
Dependent variable: rain (mean) Independent variable: number of patients (n) |
| Relative air humidity (%) | 0.392c Bd: 0.016 (95% CI –0.021–0.052) SE (B)e: 0.018 |
Dependent variable: humidity (mean) Independent variable: number of patients (n) |
| UV Index (0–17+) | 0.008c Bd: –0.003 (CI –0.005 to –0.001) SE (B)e: 0.001 |
Dependent variable: UV-index (mean) Independent variable: number of patients (n) |
| Air Quality Index (1-5) | 0.013c Bd: 0.001 (CI 0.000–0.002) SE (B)e: 0.000 |
Dependent variable: air quality (mean) Independent variable: number of patients (n) |
| P-values in bold are statistically significant; aMann–Whitney U-test, bKruskal–Wallis t-test, cLinear regression analysis; dunstandardized regression coefficient beta; estandard error of regression coefficient beta. AD: atopic dermatitis; CI: 95% confidence interval; UV: ultraviolet. |
||
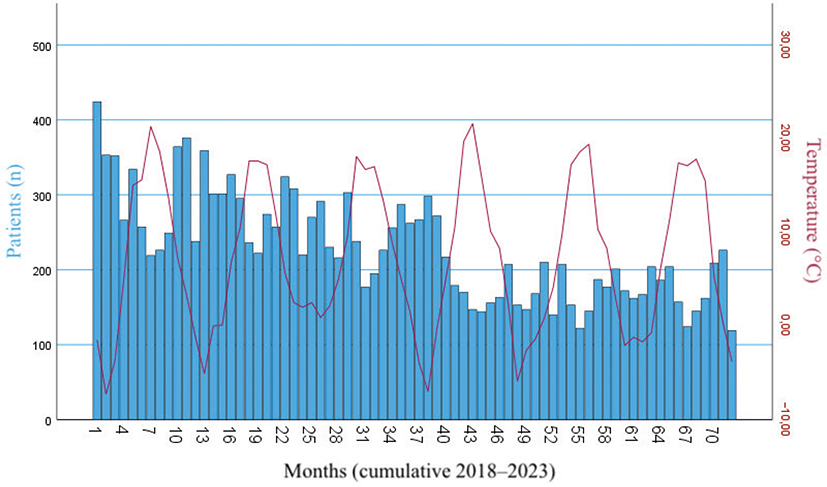
Fig. 1. Changes in patient numbers and temperature. Number of AD patients in primary care in Helsinki, Finland, cumulative months (0–72) during the years 2018–2023; each blue boxplot depicts the absolute monthly patient number; red line: seasonally changing outside temperature (°Celsius); meteorological measurement station: Kumpula, Helsinki, Finland.
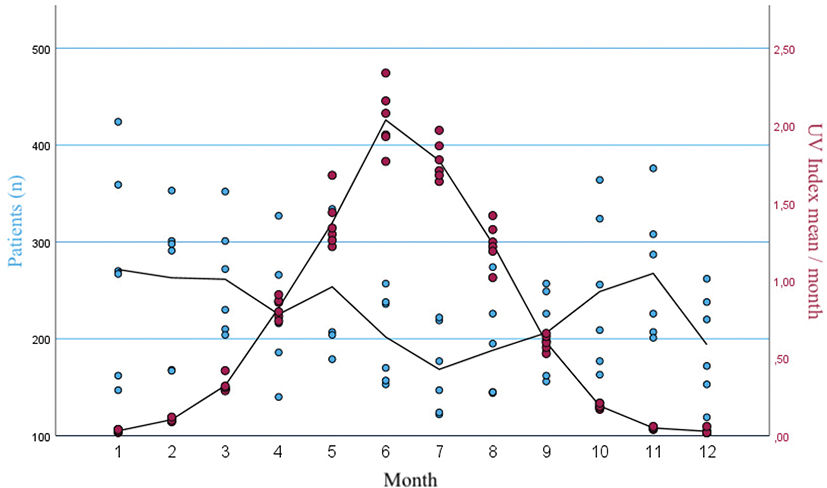
Fig. 2. Patient numbers in relation to UV Index. Scatter graph of absolute AD patient numbers per month (blue dots) and mean monthly UV Index (red dots). Black lines depict the mean values of all same months during the study period 2018–2023. Meteorological measurement station: Kumpula, Helsinki, Finland.
Effects of weather factors on AD patient numbers
There was a significant inverse association between the number of AD patients and the outside temperature (p = 0.004, B: –0.39, CI: –0.065 to –0.013) (Fig. 3) and UV Index (p = 0.008, B: –0.003, CI: –0.005 to –0.001) . During the months with the highest temperatures and UV Index there were the lowest numbers of AD patients. On the other hand, AQI showed a direct proportionality with patient numbers. This means that in months of lower air quality (e.g., March, November) there were higher numbers of AD patients (p = 0.013, B: 0.001, CI: 0.000–0.002).
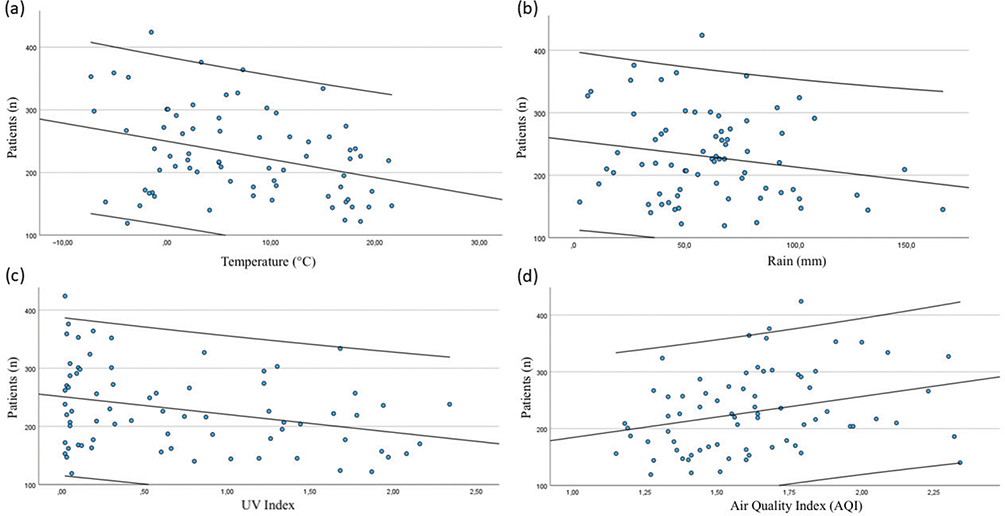
Fig. 3. Linear regression models between patients and different weather factors. Linear regression models regarding the relationship of AD patient numbers in primary care in Helsinki, Finland, and meteorological data (monthly mean); meteorological measurement station: Kumpula, Helsinki, Finland (temperature, rain, and UV Index) and Mäkelänkatu, Helsinki, Finland (Air Quality Index); middle line: mean; inside upper and lower lines: 95% confidence interval; (a) temperature (°Celsius); (b) amount of rain (mm); (c) UV Index, ranges from 0 (lowest) to 17+ (highest); (d) Air Quality Index (AQI), ranges from 1 (good) to 5 (very poor).
There was no significant association regarding the amount of rain (p = 0.103, B: –0.89, CI –0.196–0.018) or relative air humidity (p = 0.392, B: 0.016, CI: –0.021–0.052) with numbers of AD patients. Comparisons are depicted in Table III.
DISCUSSION
AD was one of the most frequent skin-related conditions diagnosed in primary care. On average, it was diagnosed in up to 0.50% of all primary care doctor’s visits, which indicates a substantial medical and socioeconomic burden. The relatively high burden was observed during the whole study period. Although patient numbers decreased in 2020, probably due to the COVID-19 pandemic, in 2023 there was again an observable increase.
Helsinki is a prime example of a geographic location with strong seasonal changes (e.g., in temperature and UV radiation), which makes it possible to observe how these changes affect disease activity and burden. The data showed that there is a significant variation of patient numbers based on season and different months of the year. The highest patient numbers were seen in colder winter months with less sunshine (lower UV radiation). On the other hand, in the warmer summer months the patient numbers were lower. There was a significant association with outside temperature and UV Index with lower patient numbers. Higher air quality was significantly associated with lower patient numbers.
Many studies have shown the seasonal variation in AD severity and burden (12). Hamann et al. (13). demonstrated that, in Denmark, healthcare utilization markers of AD changed significantly with season, while outpatient visits were common in winter and early spring and most common in November. The results are similar to our observation, but weather factors are different in Denmark compared with Helsinki. Khodaei et al. found that AD was more frequent during spring and winter in Iran (14), which differs significantly from Helsinki regarding geography and weather.
In the United States, Fleischer observed the highest numbers of AD visits in May but also in June. Smaller peaks were remarked in January and October (15). On the other hand, Hancox et al. claim that in the USA from 1990 to 1998 AD showed no significant seasonal variation (16). Some 66% of AD patients in a Japanese study experienced seasonal aggravation and the most common seasons for incidence in exacerbation were spring and winter (17). In another Japanese study, the peak month for first AD visits to a dermatology outpatient clinic was March (18). In the Netherlands, Young (19) found that autumn was the most frequent season for first visits (37% of all visits).
Public holidays, when fewer physicians are in the office, might explain the sudden drop in patient numbers during December in our study. Additionally, in Finland people usually go on holiday in June or July, which might decrease outpatient visits. Still, it is highly unlikely that this alone would explain the significant decrease in patient numbers from summer to early autumn. We observed the highest burden of AD during winter, early spring, and late autumn, which is in accordance with most other studies. It is also possible that increased infections during seasons with increased social contact act as confounding factors.
Morita et al. demonstrate how bleomycin hydrolase (BH, a natural moisturizing factor generating agent) activity is elevated in winter in healthy and non-lesional skin of AD children but not in the skin of lesional AD children (20). This could be one mechanism contributing to the aggravation of AD symptoms during winter months. Although we could not observe an association of patient numbers with the outside air humidity, it is known that in colder winter months patients spend more time in heated apartments with drier ambient air. This may have effects on the epidermal barrier function and the cutaneous microbiome. In addition, an increase in exposure to chlorinated water in winter (e.g., from public swimming pools rather than natural lakes) could have influenced the results. In Finland, winter is also the season when temperatures are the lowest and sunlight as well as UV radiation are insufficient.
Many studies have shown how average temperature is negatively correlated with the healthcare utilization of AD patients (13, 21). and the prevalence of AD (22, 23). Our study supports these findings as there was a significant inverse association between the number of AD patients and the outside temperature (p = 0.004). The effect of temperature on epidermal barrier function has been linked to TRPVs, which are sensed by neuronal endings and epithelial cells in the skin. Different TRPVs can be activated specifically by low or by high temperatures (5). In addition, there have been recent reports that the topical use of a TRPV1 antagonist is effective on itching in AD. Fleischer noted that in the western USA, the likelihood of an AD visit decreased when temperature increases whereas, conversely, in the northern, eastern, and southern USA the likelihood increased. The observation of an increased AD visit in correlation with temperature was most notable above 30°C (15). TRPVs (e.g., TRPV3 and 4) that mediate itch during high temperatures have also been described (5), but in Finland it is quite rare to reach temperatures above 30°C. Sargen et al. found that higher temperature and sun exposure were associated with poorly controlled AD in the USA (24). The broad spectrum of different climates (e.g., higher mean temperatures and lower seasonal variation) found in the USA might affect these American results concerning the effects of temperature, season, and also UV radiation on AD that are contradictory to many other studies.
Interestingly, Kim et al. (25). found that in autumn UV radiation increased AD symptoms in a study group of 82 AD children in Seoul but decreased symptoms in winter, while no statistically significant difference was found in summer or spring. It should be noted that the analysis was based on self-reported symptoms. In the USA, higher cumulative UVA and UVB exposure was associated with poorly controlled AD (24). On the other hand, in prevalence studies, residence closer to the Equator (12, 26) and higher UV Index (22) are associated with lower prevalence of AD or its symptoms.
UV radiation has long been used to treat AD with good efficacy (27–29). It has also been suggested that decreased environmental UV radiation exposure could play a role in the increasing global prevalence of AD (30). Low-dose UVB has positive immunosuppressive effects on AD; the radiation induces the formation of cutaneous vitamin D3 and increases the expression of skin barrier proteins filaggrin and involucrin along with antimicrobial peptides (30, 31). In addition, vitamin D deficiency has been reported in AD patients (32, 33). Our study demonstrates that AD patient visits are significantly lowest during months when there is the most UV radiation (p = 0.008). Nevertheless, more studies should be conducted to elucidate the intricate role of UV radiation in AD, such as what appropriate doses are that could ameliorate the disease symptoms.
In previous studies, worsened air quality (i.e., a rise of NO2, PM2,5, and PM10 in the air) has been linked to flares of AD (34–36). These findings are in accordance with our results. However, the Air Quality Index is formed of different components, thus we could not differentiate whether NO2, PM2,5, or PM10, for example, are responsible for the correlation between an increase in outpatient visits and a higher AQI. NO2 is recognized to induce oxidative damage through free radicals (36), which could be one possible driving mechanism in the aggravation of AD symptoms. Also pollen and other aeroallergens are connected to AD exacerbations (37). Pollen, which is included in PM10, occurs mainly in spring and summer in Finland. Our observations are in line with previous studies indicating a reciprocal association of air quality and AD burden, as in months of lower air quality (higher AQI), e.g., in spring, there were higher numbers of AD patient visits (p = 0.013). Nevertheless, the mechanisms leading to the increase in AD exacerbation during periods of worsened air quality and increased air pollution remain somewhat unclear and further studies are needed to clarify specific causes (6).
Relative air humidity and precipitation were not significantly associated with AD patient numbers, which could be explained by the relatively low seasonal variation of these weather parameters in Helsinki. In the United States, Silverberg et al. demonstrated that lower AD prevalence was found in areas with higher relative humidity and lower precipitation (22). In another study, AD prevalence was positively correlated with precipitation and humidity in Spain (23). Engebretsen et al. conclude in their review article that dry and cold weather increases the risk of flares in AD patients (38). In Helsinki, relative humidity is highest during winter months due to long-term climate trends. It remains unclear what effects this could have on short-term weather patterns and thus on the burden of AD.
Limitations
Our results were retrieved from a primary care database and thus the confirmation and the initial timepoint of AD diagnosis could not be verified, which could possibly lead to selection bias. The AD diagnosis was made by primary care doctors (i.e., non-specialist doctors), which might have led to overestimation regarding the burden of AD and possible information bias. In addition, we could not make conclusions concerning the probable causality of weather parameters and number of AD patients. We also analysed data only for the city of Helsinki, Finland, which limits the generalizability of the findings to the broader AD population. The weather data were retrieved from only 2 weather stations corresponding to an urban environment and thus possible limitations regarding the acquisition and accuracy of weather data should be acknowledged.
Conclusions
AD causes a substantial burden in primary care in Helsinki, Finland, and shows a significant seasonal variation. This indicates that weather and other extrinsic factors play an important role regarding disease activity and recurrence of flares. There are specific weather parameters (temperature, UV Index, and air pollution) that follow similar patterns with patient numbers in primary care and likely comprise important direct and indirect pathogenetic factors that explain the seasonal variation. We believe that it would be reasonable to address this changing burden of AD with seasonally directed medical measures, educational activity, and resources.
ACKNOWLEDGEMENTS
IRB approval status: This study was approved by the ethical committee of Helsinki University, Finland (reference number: 14/2024).
REFERENCES
- Kiiski V, Salava A, Susitaival P, Barnhill S, Remitz A, Heliovaara M. Atopic dermatitis in adults: a population-based study in Finland. Int J Dermatol 2022; 61: 324–330. https://doi.org/10.1111/ijd.15912
- Salava A, Rieppo R, Lauerma A, Salo V. Age-dependent distribution of atopic dermatitis in primary care: a nationwide population-based study from Finland. Acta Derm Venereol 2022; 102: adv00738. https://doi.org/10.2340/actadv.v102.2287
- Tian J, Zhang D, Yang Y, Huang Y, Wang L, Yao X, et al. Global epidemiology of atopic dermatitis: a comprehensive systematic analysis and modelling study. Br J Dermatol 2023; 190: 55–61. https://doi.org/10.1093/bjd/ljad339
- Kim J, Kim BE, Leung DYM. Pathophysiology of atopic dermatitis: clinical implications. Allergy Asthma Proc 2019; 40: 84–92. https://doi.org/10.2500/aap.2019.40.4202
- Hui-Beckman JW, Goleva E, Leung DYM, Kim BE. The impact of temperature on the skin barrier and atopic dermatitis. Ann Allergy Asthma Immunol 2023; 131: 713–719. https://doi.org/10.1016/j.anai.2023.08.007
- Zeldin J, Ratley G, Shobnam N, Myles IA. The clinical, mechanistic, and social impacts of air pollution on atopic dermatitis. J Allergy Clin Immunol 2024; 154: 861–873. https://doi.org/10.1016/j.jaci.2024.07.027
- Salava A, Oker-Blom A, Remitz A. The spectrum of skin-related conditions in primary care during 2015–2019: a Finnish nationwide database study. Skin Health Dis 2021; 1: e53. https://doi.org/10.1002/ski2.53
- Antti A, Salava A, Perälä M, Pelkonen AS, Mäkelä MJ, Remitz A. Are infants and toddlers with moderate-to-severe atopic dermatitis undertreated? Experiences of a Finnish tertiary care hospital. Acta Derm Venereol 2021; 101: adv00368. https://doi.org/10.2340/00015555-3739
- Salava A, Perälä M, Juppo M, Pelkonen AS, Mäkelä MJ, Remitz A. Effective treatment of atopic dermatitis in small children significantly improves the quality of life of patients and their families. Eur J Dermatol 2021; 31: 791–797. https://doi.org/10.1684/ejd.2021.4169
- Database of the Finnish Institute for Health and Welfare (THL), Avohilmo: ICD-10. (database search conducted in April 2024). Availabel from: https://sampo.thl.fi/pivot/prod/fi/avo/perus06/summary_icd1001
- Database of the Finnish Meteorological Institute (database search conducted in April 2024). Available from https://en.ilmatieteenlaitos.fi/download-observations
- Weiland SK, Hüsing A, Strachan DP, Rzehak P, Pearce N; ISAAC Phase One Study Group. Climate and the prevalence of symptoms of asthma, allergic rhinitis, and atopic eczema in children. Occup Environ Med 2004; 61: 609–615. https://doi.org/10.1136/oem.2002.006809
- Hamann CR, Andersen YMF, Engebretsen KA, Skov L, Silverberg JI, Egeberg A, et al. The effects of season and weather on healthcare utilization among patients with atopic dermatitis. J Eur Acad Dermatol Venereol 2018; 32: 1745–1753. https://doi.org/10.1111/jdv.15023
- Khodaei B, Seyedpour S, Gholami B, Garmarudi G, Nasimi M. Seasonal and gender variation in skin disease: a cross-sectional study of 3120 patients at Razi hospital. Int J Womens Dermatol 2021; 7: 799–802. https://doi.org/10.1016/j.ijwd.2021.09.014
- Fleischer AB Jr. Atopic dermatitis: the relationship to temperature and seasonality in the United States. Int J Dermatol 2019; 58: 465–471. https://doi.org/10.1111/ijd.14289
- Hancox JG, Sheridan SC, Feldman SR, Fleischer AB Jr. Seasonal variation of dermatologic disease in the USA: a study of office visits from 1990 to 1998. Int J Dermatol 2004; 43: 6–11. https://doi.org/10.1111/j.1365-4632.2004.01828.x
- Uenishi T, Sugiura H, Uehara M. Changes in the seasonal dependence of atopic dermatitis in Japan. J Dermatol 2001; 28: 244–247. https://doi.org/10.1111/j.1346-8138.2001.tb00125.x
- Aoki T, Kojima M, Adachi J, Fukuzumi T, Endo K, Sumitsuji H, et al. Seasonal variation in the month of first visit for atopic dermatitis patients. Allergol Int 1998; 47: 137–142. https://doi.org/10.2332/allergolint.47.137
- Young E. Seasonal factors in atopic dermatitis and their relationship to allergy. Acta Derm Venereol 1980; 60: 111–112. https://doi.org/10.2340/0001555592111112
- Morita K, Yasudo H, Chiba T, Kitazawa H, Narita M, Yamamoto-Hanada K, et al. Seasonal variability of epidermal Bleomycin Hydrolase activity in healthy children and pediatric patients with atopic dermatitis. J Dermatol Sci 2021; 102: 137–139. https://doi.org/10.1016/j.jdermsci.2021.03.007
- Furue M, Yamazaki S, Jimbow K, Tsuchida T, Amagai M, Tanaka T, et al. Prevalence of dermatological disorders in Japan: a nationwide, cross-sectional, seasonal, multicenter, hospital-based study. J Dermatol 2011; 38: 310–320. https://doi.org/10.1111/j.1346-8138.2011.01209.x
- Silverberg JI, Hanifin J, Simpson EL. Climatic factors are associated with childhood eczema prevalence in the United States. J Invest Dermatol 2013; 133: 1752–1759. https://doi.org/10.1038/jid.2013.19
- Suárez-Varela MM, García-Marcos Alvarez L, Kogan MD, González AL, Gimeno AM, Aguinaga Ontoso I, et al. Climate and prevalence of atopic eczema in 6- to 7-year-old school children in Spain. ISAAC phase III. Int J Biometeorol 2008; 52: 833–840. https://doi.org/10.1007/s00484-008-0177-0
- Sargen MR, Hoffstad O, Margolis DJ. Warm, humid, and high sun exposure climates are associated with poorly controlled eczema: PEER (Pediatric Eczema Elective Registry) cohort, 2004–2012. J Invest Dermatol 2014; 134: 51–57. https://doi.org/10.1038/jid.2013.274
- Kim YM, Kim J, Lee JY, Kim M, Kim H, Jung K, et al. Impact of solar ultraviolet radiation on atopic dermatitis symptoms in young children: a longitudinal study. Pediatr Allergy Immunol 2017; 28: 551–556. https://doi.org/10.1111/pai.12746
- Osborne NJ, Ukoumunne OC, Wake M, Allen KJ. Prevalence of eczema and food allergy is associated with latitude in Australia. J Allergy Clin Immunol 2012; 129: 865–867. https://doi.org/10.1016/j.jaci.2012.01.037
- Krutmann J, Morita A. Mechanisms of ultraviolet (UV) B and UVA phototherapy. J Investig Dermatol Symp Proc 1999; 4: 70–72. https://doi.org/10.1038/sj.jidsp.5640185
- Abeck D, Schmidt T, Fesq H, Strom K, Mempel M, Brockow K, et al. Long-term efficacy of medium-dose UVA1 phototherapy in atopic dermatitis. J Am Acad Dermatol 2000; 42: 254–257. https://doi.org/10.1016/S0190-9622(00)90134-8
- Garritsen FM, Brouwer MW, Limpens J, Spuls PI. Photo(chemo)therapy in the management of atopic dermatitis: an updated systematic review with implications for practice and research. Br J Dermatol 2014; 170: 501–513. https://doi.org/10.1111/bjd.12645
- Thyssen JP, Zirwas MJ, Elias PM. Potential role of reduced environmental UV exposure as a driver of the current epidemic of atopic dermatitis. J Allergy Clin Immunol 2015; 136: 1163–1169. https://doi.org/10.1016/j.jaci.2015.06.042
- Hong SP, Kim MJ, Jung MY, Jeon H, Goo J, Ahn SK, et al. Biopositive effects of low-dose UVB on epidermis: coordinate upregulation of antimicrobial peptides and permeability barrier reinforcement. J Invest Dermatol 2008; 128: 2880–2887. https://doi.org/10.1038/jid.2008.169
- Vähävihu K, Ala-Houhala M, Peric M, Karisola P, Kautiainen H, Hasan T, et al. Narrowband ultraviolet B treatment improves vitamin D balance and alters antimicrobial peptide expression in skin lesions of psoriasis and atopic dermatitis. Br J Dermatol 2010; 163: 321–328. https://doi.org/10.1111/j.1365-2133.2010.09767.x
- Peroni DG, Piacentini GL, Cametti E, Chinellato I, Boner AL. Correlation between serum 25-hydroxyvitamin D levels and severity of atopic dermatitis in children. Br J Dermatol 2011; 164: 1078–1082. https://doi.org/10.1111/j.1365-2133.2010.10147.x
- Kim J, Kim EH, Oh I, Jung K, Han Y, Cheong HK, et al. Symptoms of atopic dermatitis are influenced by outdoor air pollution. J Allergy Clin Immunol 2013; 132: 495–498.e1. https://doi.org/10.1016/j.jaci.2013.04.019
- Song S, Lee K, Lee YM, Lee JH, Lee SI, Yu SD, et al. Acute health effects of urban fine and ultrafine particles on children with atopic dermatitis. Environ Res 2011; 111: 394–399. https://doi.org/10.1016/j.envres.2010.10.010
- Eberlein-König B, Przybilla B, Kühnl P, Pechak J, Gebefügi I, Kleinschmidt J, et al. Influence of airborne nitrogen dioxide or formaldehyde on parameters of skin function and cellular activation in patients with atopic eczema and control subjects. J Allergy Clin Immunol 1998; 101: 141–143. https://doi.org/10.1016/S0091-6749(98)70212-X
- Chong AC, Chwa WJ, Ong PY. Aeroallergens in atopic dermatitis and chronic urticaria. Curr Allergy Asthma Rep 2022; 22: 67–75. https://doi.org/10.1007/s11882-022-01033-2
- Engebretsen KA, Johansen JD, Kezic S, Linneberg A, Thyssen JP. The effect of environmental humidity and temperature on skin barrier function and dermatitis. J Eur Acad Dermatol Venereol 2016; 30: 223–249. https://doi.org/10.1111/jdv.13301