ORIGINAL REPORT
Assessing Targeted Proteomics in Inflammatory Skin Diseases with the Tape-stripping Method
Anna SCHULTZ VINGE1,2  , Sule ALTINTAS1, Niels ØDUM3 , Jeanne DUUS JOHANSEN2,4 , Marianne BENGTSON LØVENDORF1,3 and Lone SKOV1,2
1Department of Dermatology and Allergy, Copenhagen University Hospital – Herlev and Gentofte, Copenhagen, 2Department of Clinical Medicine, Faculty of Health and Medical Sciences, University of Copenhagen, Copenhagen, 3LEO Foundation Skin Immunology Research Center, Department of Immunology and Microbiology, Faculty of Health and Medical Sciences, University of Copenhagen, Copenhagen, and 4The National Allergy Research Centre, Department of Dermatology and Allergy, Copenhagen University Hospital – Herlev and Gentofte, Copenhagen, Denmark
This cross-sectional study aimed to determine the detectability of a panel of 92 inflammatory biomarkers in tape strips from the skin of patients with inflammatory skin diseases, and whether this depended on the number of tape strips taken. Furthermore, the biomarker levels in the patients were compared with those in healthy controls. Eight consecutive uniform tape strips (each 3.8 cm²) were obtained from 2 adjacent skin sites from 8 atopic dermatitis, contact dermatitis, and psoriasis patients, respectively, and 5 controls. Three separate analyses were carried out using the Olink® Target Inflammation panel: (i) all 8 tape strips (1–8) from 1 skin site and from the other skin site, (ii) the first 4 tape strips (1–4), and (iii) the next 4 tape strips (5–8). Biomarkers were above the detection limit for 65.7% of atopic dermatitis, 70.2% of psoriasis, and 45.1% of contact dermatitis samples. There were no significant differences in biomarker levels between the use of 4 or 8 tape strips, or between the first and last 4 tape strips. In general, atopic dermatitis and psoriasis patients were distinguishable from controls, whereas contact dermatitis patients were not. Based on the overall data quality, analysing protein signatures in tape strips with the targeted inflammatory panel is feasible.
SIGNIFICANCE
Examining inflammatory skin diseases with the minimally invasive tape-stripping technique seems advantageous when repeated samples must be collected or when samples are obtained from children or from sensitive areas such as the hands or face. However, obtainment and analysis of tape strip material has some methodological challenges. This study finds that the tape-stripping method, using 4 tape strips combined with a protein analysis technology that has low sample volume requirement, can be used to measure protein signatures in the skin of patients with psoriasis and atopic dermatitis but needs to be further optimized for use in patients with contact dermatitis.
Key words: atopic dermatitis; contact dermatitis; proteomics; psoriasis; skin tape.
Citation: Acta Derm Venereol 2026; 106: adv43362. DOI: https://doi.org/10.2340/actadv.v106.43362.
Copyright: © 2026 The Author(s). Published by MJS Publishing, on behalf of the Society for Publication of Acta Dermato-Venereologica. This is an Open Access article distributed under the terms of the Creative Commons Attribution-NonCommercial 4.0 International License (https://creativecommons.org/licenses/by-nc/4.0/).
Submitted: Mar 31, 2025. Accepted after revision: Jan 19, 2026. Published: Feb 23, 2026.
Corr: Lone Skov, Department of Dermatology and Allergy, Copenhagen University Hospital – Herlev and Gentofte, Gentofte Hospitalsvej 15, Opg. 15, 3. Sal, 2900 Hellerup, Denmark. E-mail: lone.skov.02@regionh.dk
Competing interests and funding: LS has been a paid speaker for AbbVie, Eli Lilly, Takeda, Sanofi, Pfizer, and LEO Pharma, and has been a consultant or has served on Advisory Boards with AbbVie, Eli Lilly, Novartis, Pfizer, LEO Pharma, Janssen, UCB, Almirall, Galderma, Bristol-Myers Squibb, Stada, Takeda, and Sanofi and has received research and educational grants from Bristol-Myers Squibb, Janssen, Sanofi, UCB, Almirall, the Danish National Psoriasis Foundation, and the LEO Foundation. The remaining authors have no conflicts of interest to declare.
This study received funding from the LEO Foundation grant number [LF-ST-21-500002] and Copenhagen University Hospital – Herlev and Gentofte Hospital, Denmark.
INTRODUCTION
Tape-stripping provides epidermal material that can be used to analyse different cutaneous biomarkers, e.g., with proteomics (1). Due to the minimally invasive nature of the method, it is optimal for obtaining repeated samples (2). It holds great potential for following disease course over time (2), determining severity and prognosis (3, 4), or evaluating treatment response (5). Additionally, the method is applicable and preferable to paediatric patient groups (2, 3) and even sensitive areas such as the hands and face (6). In contrast, biopsy specimens possess strength in the ability to examine all layers of the skin (7), yet the invasiveness of the method comes with limitations.
The use of tape strips has been investigated in different patient groups such as atopic dermatitis (AD) (4, 8–14) and to a lesser degree psoriasis (9, 10, 15, 16) and hand eczema, including irritant or allergic contact dermatitis (CD) (6, 17–20). Although these studies show promising results, a surprisingly large variation in methodology challenges the practical applicability of the technique. The number of applied tape strips differs from study to study, along with which layers and how many tape strips are pooled before different types of analyses. Choosing an appropriate number of tape strips is pivotal. It requires finding the balance between, on one hand, obtaining enough epidermal material to detect the desired proteins, and on the other hand, limiting the time-consuming steps to make the sampling method favourable in an everyday clinical setting.
Different methods for protein analysis of the tape strip material can be employed. Most previous studies have used Meso Scale Discovery (MSD) or mass spectrometry (21, 22). One of the main challenges with tape strips is the small amount of skin material obtained and, hence, the low protein concentrations. Olink® is a multiplex immunoassay that requires very little material compared with conventional immunoassays (22). Thus, it may be an optimal method for analysing tape strips, yet the technology has traditionally been used on blood specimens. So far, investigation into the combination of tape strips and Olink® is still in its early stages (21–24).
In this study, we investigated the tape-stripping method for examining protein signatures of the skin in patients with AD, CD, and psoriasis using the targeted inflammatory Olink® panel. We evaluated the use of different numbers of tape strips and investigated whether the depth of the tape strips influences the detection of disease-relevant proteins.
MATERIALS AND METHODS
This method study was conducted as a part of the BIOSKIN cohort study that has been described in detail (25). The study is approved by the Scientific Ethical Committee of the Capital Region (H-21032986) and the Danish Data Protection Agency (P-2021-435). An overview of the study design is presented in Fig. 1A. Patients with AD (n = 8), CD (n = 8), psoriasis (n = 8), and healthy controls (n = 5) were recruited from November 2023 to January 2024. Inclusion criteria were participants ≥18 years of age and able to read and understand Danish. Lesional sample sites were assessed with a local severity score (Table I) (25). Each lesion had to be homogeneous based on the local severity score and large enough to contain 2 sets of tape strips. Exclusion criteria were pregnancy, breastfeeding, and deprivation of liberty.
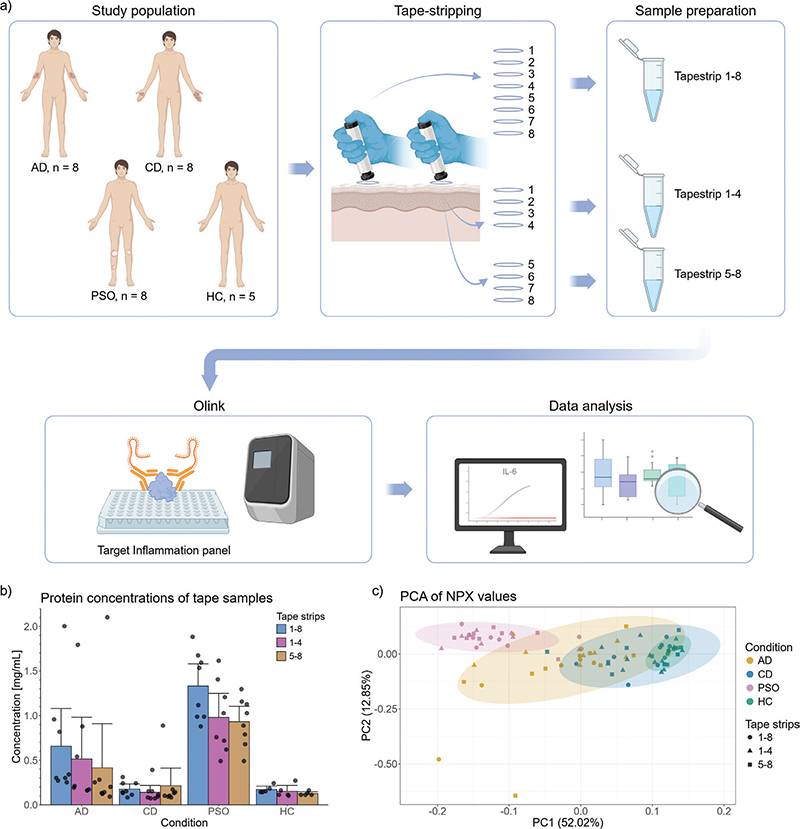
Fig. 1. Study design, protein concentrations, and principal component analysis. (A) Overview of study design. Patients with atopic dermatitis (AD), contact dermatitis (CD) and psoriasis were enrolled (n = 8 in each group) along with healthy controls (HC, n = 5). Two sets of 8 tape strips were obtained from each study participant – lesional samples for disease groups and samples from healthy skin for controls. In one set, all 8 tape strips were pooled before analysis, in the other, number 1–4 and 5–8 were pooled separately. Samples were analysed with the Target Inflammation panel from Olink® including 92 protein assays. (B) Bar plot of protein concentrations for samples from patients with AD (n = 8), CD (n = 8), psoriasis (n = 8), and healthy controls (n = 5). Protein concentrations from tape strips number 1–8, 1–4 and 5–8, respectively, are depicted for each disease group, with individual values as dots and error bars showing the bootstrapped mean standard errors. (C) Principal component analysis (PCA) of relative protein concentrations for patients with AD, CD, and psoriasis and healthy controls, with the percentage of variance explained by the first and second principal components (PC1 and PC2) in parentheses. Fig. 1A was created with BioRender.com. HC: healthy controls; NPX: Normalized Protein eXpression; PC: principal component; PSO: psoriasis.
| Total n = 29 |
AD n = 8 |
CD n = 8 |
PSO n = 8 |
HC n = 5 |
p-values | |
| Demographics | ||||||
| Age, median (IQR) | 52.0 (29.5) | 47.5 (26.3) | 54.5 (30.5) | 53.0 (27.5) | 35.0 (29.5) | 0.674 |
| Sex, females, n (%) | 13 (44.8) | 2 (25.0) | 6 (75.0) | 3 (37.5) | 2 (40.0) | 0.218 |
| Disease relevant characteristics | ||||||
| Topical treatmenta, n (%) | 8 (33.3) | 2 (25.0) | 5 (62.5) | 1 (12.5) | N/A | |
| Systemic treatment, n (%) | 11 (45.8) | 4 (50.0) | 4 (50.0) | 3 (37.5) | N/A | |
| Disease-specific severity score, median (IQR) | ||||||
| EASI Range 0–72 | N/A | 6.3 (10.7) | N/A | N/A | N/A | |
| HECSI Range 0–360 | N/A | N/A | 69.0 (42.0)b | N/A | N/A | |
| PASI Range 0–72 | N/A | N/A | N/A | 8.95 (6.9) | N/A | |
| Disease-specific sample site local severity score, median (IQR) | ||||||
| ADc Range 0–12 | N/A | 4.5 (3.3) | N/A | N/A | N/A | |
| CDd Range 0–18 | N/A | N/A | 6.5 (1.8) | N/A | N/A | |
| Psoriasise Range 0–12 | N/A | N/A | N/A | 6.0 (1.0) | N/A | |
| Sample site, n (%) | ||||||
| Chest | 1 (3.4) | 1 (12.5) | – | – | – | |
| Back | 8 (27.6) | 3 (37.5) | – | 3 (37.5) | 2 (40.0) | |
| Arm | 5 (17.4) | 2 (25.0) | – | 2 (25.0) | 1 (20.0) | |
| Palm | 6 (20.7) | – | 5 (62.5) | 1 (12.5) | – | |
| Dorsal hand | 2 (6.9) | – | 2 (25.0) | – | – | |
| Buttocks | 1 (3.4) | – | – | 1 (12.5) | – | |
| Leg | 5 (17.2) | 2 (25.0) | – | 1 (12.5) | 2 (40.0) | |
| Foot | 1 (3.4) | – | 1 (12.5) | – | – | |
| p-values were calculated for demographic variables using ANOVA for age and χ2-test for sex. aTopical treatment on the sample site within the last week. bOne missing value. cSample site local severity score for atopic dermatitis (AD) patients was calculated based on an evaluation scale from 0–3 for erythema, oedema/papulation, excoriation, and lichenification, resulting in a score from 0 to 12. dSample site local severity score for contact dermatitis (CD) patients was calculated based on an evaluation from 0–3 for erythema, infiltration, vesicles, fissures, scaling, and oedema, resulting in a score from 0 to 18. eSample site local severity score for psoriasis patients was calculated based on an evaluation scale from 0–4 for erythema, induration, and scaling, resulting in a score from 0 to 12. EASI: Eczema Area and Severity Index; HC: healthy controls; HECSI: Hand Eczema Severity Index; IQR: interquartile range; N/A: not available; PASI: Psoriasis Area and Severity Index; PSO: psoriasis. |
||||||
Tape-stripping
Circular 22 mm tape strips (D-Squame, CuDerm, Dallas, TX, USA) were applied with sterile tweezers to lesional skin for patient groups and healthy skin for controls. Eight consecutive tape strips from two homogeneous sample sites were obtained. The sampling site was marked with a skin marker on the periphery of the tape strip to ensure that the following 7 tape strips were obtained from the same area. Application of each tape strip was followed by 10 s of standardized pressure (225 g cm–2) using a pressure applicator (D500, D-Squame, CuDerm) (Fig. S1A). Following removal with the tweezers (Fig. S1B), each tape strip was immediately placed in an empty 2 mL microtube (SARSTEDT, Nümbrecht, Germany) with the adhesive side facing towards the lumen. All tubes were stored at –80°C until analysis.
Protein extraction
All tape strips were pooled before protein analysis as either all 8 tape strips (1 to 8) or tape strip numbers 1 to 4 and 5 to 8. The pooled tapes were immersed in 800 µL lysis buffer (0.2% Triton X100 in PBS + cOmplete™ Mini Protease Inhibitor Cocktail [Cat # 11836153001, Roche, Basel, Switzerland]) and stirred overnight at room temperature. The lysates were then transferred to clean tubes, and 1 mL syringes (Cat # 2933.1101, Hounisen, Skanderborg, Denmark) were used to pass the samples through a 0.2 µm filter (Cat # 83.1826.001, SARSTEDT, Nümbrecht, Germany). The following protein extract was used for Olink® analysis (1 µL). Protein concentration was measured using the Pierce BCA protein assay (Cat # 23227, Thermo Fisher, Waltham, MA, USA). Samples were stored at –80°C until analysis.
Olink® analysis
For protein analysis, the Target Inflammation panel (96-well plate) from Olink® (Olink Proteomics AB, Uppsala, Sweden) including 92 protein assays was used. Detailed information can be found in Appendix S1. Samples with a total protein concentration higher than 1 mg/mL were normalized to 1 mg/mL. Remaining samples were not further normalized. Each sample either passed the quality control (QC) step, or they were marked with a “warning” based on a deviation larger than a pre-determined value (+/- 0.3) from the median value of all samples on the plate. For each assay, a limit of detection (LOD) was calculated based on negative controls plus 3 standard deviations (SD) according to the manufacturer’s guidelines.
Statistical analysis
All statistical analyses were carried out in R version 4.3.0 (R Foundation for Statistical Computing, Vienna, Austria) (26). Statistical tests were conducted using a significance level of 0.05. Differences between using 8 tape strips and 4 tape strips for each protein assay (1 to 8 vs 1 to 4 and 1 to 8 vs 5 to 8) and differences between using the superficial or deeper layers (1 to 4 vs 5 to 8) were calculated for each patient group using Wilcoxon matched-pairs signed rank test, as implemented in the rstatix library (27).
Additionally, a Kruskal–Wallis test was performed for each protein assay on data from tape strips 1 to 8 to find protein assays with different NPX values in any of the disease groups compared with the controls. The test was performed using the kruskal.test function in R, and post-hoc analysis was performed for selected contrasts using a Dunn’s test as implemented in the dunn.test library (28). The resulting p-values were adjusted according to the Benjamini–Hochberg method. The non-parametric Kruskal–Wallis test was selected on the basis that the data did not follow a normal distribution when examined with the Shapiro–Wilk test.
Principal component analysis was performed on the scaled and centered NPX values using R’s prcomp function. The first two principal components were plotted using ggplot2 (29).
RESULTS
To assess whether the inflammatory Olink® panel could be used to measure proteins obtained from tape strips, we first collected samples from patients with AD, CD (ICD n = 3, ACD n = 2, mixed ACD/ICD n = 2, unknown aetiology n = 1), psoriasis, and healthy controls (Fig. 1A). Baseline characteristics are shown in Table I.
Protein concentrations were highest in tapes obtained from patients with psoriasis, and lowest in patients with CD and healthy controls (Fig. 1B, Table SI). A principal component analysis (PCA) revealed that the groups with AD and psoriasis could be distinguished from the healthy controls, while this was not the case for the group with CD (Fig. 1C).
Quality of Olink® data and comparison of number and depth of tape strips
Quality assessment of the Olink® results is presented in Table II. Overall, 88.5% of samples passed quality control without a warning. This was highest for patients with psoriasis (95.8%) and healthy controls (93.3%), and lowest for patients with AD or CD (83.3% in both groups). Only 187 (2.3% of all samples) resulted in “No data”. Of all NPX values 54.7% were above LOD, and thus our results were above the recommended exclusion limits of the assay. Detectability was highest in patients with psoriasis and AD (70.2% and 65.7% of all samples were above LOD, respectively) and lowest in patients with CD and controls (45.1% and 27.7% of all samples were above LOD, respectively). For more detailed information regarding which protein assays were detectable for each group, please refer to Tables SII–SV. LOD for all assays and the related mean NPX values for all disease groups and healthy controls are presented in Table SVI.
| Total n = 29 |
AD n = 8 |
CD n = 8 |
PSO n = 8 |
HC n = 5 |
|
| Samples for all protein assays, n | 8,004 | 2,208 | 2,208 | 2,208 | 1,380 |
| NPX values above LOD (of samples for all protein assays)a, n (%) | |||||
| Overall | 4,275 (54.7) | 1,389 (65.7) | 954 (45.1) | 1,550 (70.2) | 382 (27.7) |
| 1 to 8 | 1,372 (55.3) | 439 (68.5) | 289 (44.9) | 511 (69.4) | 133 (28.9) |
| 1 to 4 | 1,465 (54.9) | 464 (63.0) | 350 (47.6) | 519 (70.5) | 132 (28.7) |
| 5 to 8 | 1,438 (53.9) | 486 (66.0) | 315 (42.8) | 520 (70.7) | 117 (25.4) |
| Passed quality control (of samples for all protein assays), n (%) | |||||
| Overall | 7,084 (88.5) | 1,840 (83.3) | 1,840 (83.3) | 2,116 (95.8) | 1,288 (93.3) |
| 1 to 8 | 2,208 (82.8) | 552 (75.0) | 552 (75.0) | 644 (87.5) | 460 (100.0) |
| 1 to 4 | 2,484 (93.1) | 644 (87.5) | 644 (87.5) | 736 (100.0) | 460 (100.0) |
| 5 to 8 | 2,392 (89.7) | 644 (87.5) | 644 (87.5) | 736 (100.0) | 368 (80.0) |
| a Samples with “No data” were excluded. AD: atopic dermatitis; CD: contact dermatitis; HC: healthy controls; LOD: limit of detection; NPX: Normalized Protein eXpression; PSO: psoriasis. |
|||||
When analysing all proteins and all groups with regard to using either 4 tape strips or all 8 tape strips and using deeper or superficial tape strips, we found no statistically significant differences (Table SVII).
Comparison between disease groups and healthy controls
When we compared the expression level of all measured proteins from each disease group with healthy controls, we found that patients with psoriasis were the most distinguishable from healthy controls (Table SVIII and Fig. S2). Of the differentially expressed proteins, 58 were upregulated in patients with psoriasis and 39 in patients with AD compared with controls, with an overlap of 35 upregulated proteins in common (Fig. S3). Only IL-1α was significantly downregulated – this was consistent across all disease groups. Sixteen relevant proteins from the Target Inflammation panel were selected (4 interleukins, 4 chemokines, 4 cytokines, and 4 miscellaneous proteins) based on previously published literature and high expression in our data set. Relative concentrations for all disease groups and healthy controls of the selected proteins are presented as boxplots in Fig. 2.
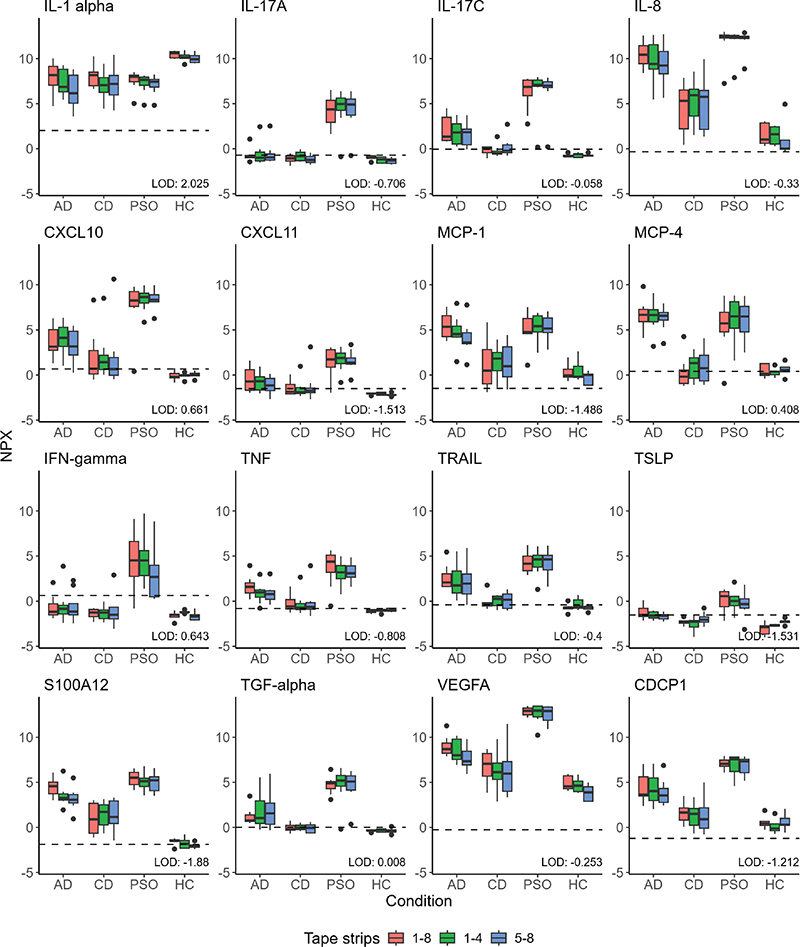
Fig. 2. Boxplots of relative protein concentrations for selected proteins from the Olink® Target Inflammation panel. Boxplots depict Normalized Protein eXpression (NPX) for samples from patients with atopic dermatitis (AD, n = 8), contact dermatitis (CD, n = 8), and psoriasis (PSO, n = 8) and healthy controls (HC, n = 5). For each group, relative protein concentrations (NPX) from tape strips numbers 1–8, 1–4, and 5–8, respectively, are presented. The dotted line depicts the limit of detection (LOD). AD: atopic dermatitis; CD: contact dermatitis; CDCP: CUB domain-containing protein; CXCL: chemokine (C-X-C motif) ligand; HC: healthy controls; IFN: interferon; IL: interleukin; LOD: limit of detection; MCP: monocyte chemoattractant protein; NPX: Normalized Protein eXpression; PSO: psoriasis; TNF: tumour necrosis factor; TRAIL: TNF-related apoptosis-inducing ligand receptor 1; TSLP: thymic stromal lymphopoietin; VEGFA: vascular endothelial growth factor A.
All cytokines and most of the interleukins were significantly higher in patients with psoriasis compared with healthy controls including IL-17, IL-6, IL-8, IFN-γ, and TNF, which are all well known for psoriasis (see Table SVIII). Most cytokines and chemokines were higher in patients with AD compared with healthy controls. In the protein panel, especially IL-4, IL-10, IL-13, IL-17C, IL-22RA1, IL-33, S100A12, and TSLP are relevant for AD. Except for IL-4, IL-10, and IL-13, we found all upregulated (see Table SVIII). The patient group with the least detectability in the selected proteins was CD. Nonetheless, patients with CD demonstrated over 50% of samples above LOD for the proteins IL-1α, IL-8, MCP-1, CXCL10, TNF, TRAIL, CDCP1, S100A12, and VEGFA (see Fig. 2 and Table SIII).
DISCUSSION
This study shows that the tape-stripping method, using only 4 tapes combined with the Olink® technology, can be used to measure protein signatures in the skin of patients with psoriasis and AD but needs to be further optimized for use in CD. In general, patients with psoriasis or AD could be distinguished from healthy controls based on the applied method, whereas this was not the case for patients with CD. We found no significant difference in the comparison of 4 or 8 tape strips across all disease groups and healthy controls. Similarly, no significant difference was found between tapes from the superficial or deeper layers. Inflammatory biomarkers that end up in the stratum corneum are expressed by living resident skin cells and recruited immune cells in dermis and deeper epidermis (8). Clausen et al. hypothesized that biomarkers are transferred to the extracellular space with lipids secreted from deeper epidermis, which might explain why they found no concentration gradient across the stratum corneum (8). Our results support this view of stratum corneum as one compartment with a consistent molecular milieu.
The method applied in this study enabled detectability of many key inflammatory biomarkers in psoriasis including IFN-γ, TNF, IL-6, IL-8, IL-12B, IL-17A, IL-17C, and CXCL10 (10, 31) and concentrations for these proteins were all significantly higher in lesional psoriasis skin compared with healthy skin. A significant increase was observed for TGF-α only in patients with psoriasis. The proliferative effect of TGF-α on keratinocytes and its overexpression in psoriatic lesional epidermis are well known (32), hence our results confirm previous findings and underscore that Olink® captures meaningful inflammatory signals. Most of the previous tape-strip studies of lesional skin in patients with psoriasis have looked at RNA and not protein expression (9, 10, 16). He et al. investigated the correlation between gene expression levels in tape strips vs biopsies in psoriasis compared with healthy controls (10). Notably, tape strips revealed a larger differentiation than biopsies regarding CXCL9/10 in psoriasis skin compared with healthy skin. Our results showed a significant upregulation of CXCL9/10 in psoriasis compared with healthy skin. As we did not directly compare tape strips and biopsies, it remains unclear whether CXCL9/10 levels would be higher in tape strips.
According to two reviews summarizing proteomic studies regarding AD (21, 22), only a single study has examined tape strips from AD patients with Olink®: He et al. compared lesional tape strips before and after treatment with dupilumab and demonstrated significant decreases in e.g., IL-6, IL-8, IL-17C, CCL3, CXCL1, MCP-1, MCP-4, TNF, S100A12, MMP-1, and MMP-10 in lesional skin following treatment (23). In our study, these proteins were significantly higher in patients with AD compared with healthy individuals.
One of the key inflammatory biomarkers in AD, IL-4 (33), was not detectable in our study. Other studies have previously demonstrated how this cytokine is difficult to detect when analysing only the superficial layers of the skin with tape strips (34, 35). This is supported by Andersson et al. analysing the cytokine profile in tape strips from paediatric AD patients using MSD (3). They found that biopsies showed a type 2 skewed response whereas tape strips revealed increased biomarkers related to innate immune response. This key finding suggests that the protein signature of AD may vary based on the applied skin sampling method. Similar to our study, Andersson et al. found high expression of IL-8 in tape strips from lesional skin in patients with AD.
Patients with CD exhibited lowest detectability and were overall not distinguishable from healthy controls. The samples were taken mainly from the hands, where the expression of inflammatory biomarkers is typically lower than for other skin sites and where the physical barrier differs too (36, 37). The results might have been more favourable if the control group had included samples from the hand. However, it was possible to detect some of the proteins that were upregulated in recent hand eczema studies using proteomics and transcriptomics, such as IL-6, S100A12, CXCL9, CXCL10, TNF, TNFRSF9, TNFSF14, CSF-1, and OSM (6, 20, 36). In line with our results, a recent study demonstrated overall low detectability in CD and hand eczema patients with the inflammatory panel from Olink® compared with two other multiplex immunoassays (24).
Significant downregulation of IL-1α compared with controls was consistent across all disease groups. The proinflammatory cytokine is constitutively expressed in basal keratinocytes, playing a role in maintaining skin barrier homeostasis (30, 38). As increased expression of IL-1α has been identified as a driver of cutaneous inflammation, one might expect it to be upregulated across the investigated inflammatory skin diseases in this study (38). The observed downregulation could be due to the presence of IL-1α in stratum basale (30) and the fact that expression levels in superficial tape strips do not necessarily align with those in biopsies (36). Nevertheless, our findings were consistent with previous studies regarding both tape strips and biopsies (8, 30, 39).
Tape-stripping is a promising method with an inarguable advantage over biopsy specimens due to its minimally invasiveness, which is particularly favourable in the case of children or sensitive areas such as the hands (2). Furthermore – despite the cross-sectional nature of this study – we believe that one of the undeniable strengths of tape-stripping is its applicability in longitudinal studies or in monitoring patient progress over time in routine clinical practice. However, it is important to keep in mind that the skin material obtained and the immunologic signatures differ in tape-stripping and biopsies (3, 11, 14, 40) and the two methods cannot be used interchangeably. Instead, they offer different advantages and limitations. Another important consideration regarding tape-stripping is the lack of methodological consistency (4, 6, 8–13, 15–19). In order for tape-stripping to be implemented in clinical practice, the method must be streamlined to a greater extent in future studies. In addition, immunologic biomarkers vary according to anatomical sample site – in particular the palm differs from other sample sites (36) This too must be considered when evaluating analysis of tape strips.
Limitations
This study has some limitations that must be considered. Eight patients were enrolled in each disease group and 5 healthy controls participated. The size of the study population could be part of the explanation as to why we found no significant differences between the numbers and depth of the tape strips. Our results do, however, align with the study by Clausen et al. (8). Total protein concentration varied substantially between the disease groups. To avoid overlooking a biological variation between diseases, the NPX values were not adjusted for absolute protein concentration. This is, however, a methodological limitation that must be considered when interpreting the results. We did not investigate whether there was a difference in other numbers of tape strips and, hence, it remains unclear whether, e.g., 1 or 2 tape strips contain enough skin material to detect different protein signatures. Due to the low protein concentrations in the patient group with CD, it would probably not be advantageous to obtain fewer tape strips, unless other methodological aspects were optimized, e.g., changing the lysis buffer volume and thus the protein concentration. Lack of significance in protein expression levels from patients with CD could be explained by the heterogeneity of the patients’ aetiological subtypes, low total protein concentration due to technical circumstances in the tape-stripping procedure of this disease group, and/or by the lack of site-matched samples in the control group. Another limitation of the study was that we used only one method to detect proteins, and the different available methods to detect small amounts of proteins need to be compared. The Target Inflammation panel used from Olink® consists of 92 protein assays, thus many other proteins that could be relevant to the diseases have not been part of the current study.
Conclusion
The tape-stripping method applied in this study is suitable for investigating protein signatures in inflammatory skin diseases. Of the 3 patient groups, patients with psoriasis demonstrated the highest protein concentrations and highest detectability of the inflammatory biomarkers in question, and they were the most distinguishable from healthy controls. Across all groups, there were no significant differences in the number of tape strips or depth of tape strip material. Analysing cutaneous inflammatory biomarkers in tape strips with Olink® appears to be favourable in patients with psoriasis or AD.
ACKNOWLEDGEMENTS
The authors thank all the participating patients. Furthermore, the authors thank bioanalyst Signe Grønbek Petersen and project nurses Helene Meyer Martin and Ida Gebauer from the BIOSKIN team for their help in the laboratory.
Data availability statement
The data that support the findings of this study are available on request from the corresponding author. The data are not publicly available due to privacy or ethical restrictions.
IRB approval status
This study has been approved by the Danish National Committee on Health Research Ethics (H-21032986). The patients provided their written informed consent prior to inclusion in the study.
REFERENCES
- Hughes AJ, Tawfik SS, Baruah KP, O’Toole EA, O’Shaughnessy RFL. Tape strips in dermatology research. Br J Dermatol 2021; 185: 26–35. https://doi.org/10.1111/bjd.19760
- Kim BE, Goleva E, Kim PS, Norquest K, Bronchick C, Taylor P, et al. Side-by-side comparison of skin biopsies and skin tape stripping highlights abnormal stratum corneum in atopic dermatitis. J Invest Dermatol 2019; 139: 2387–2389.e1. https://doi.org/10.1016/j.jid.2019.03.1160
- Andersson AM, Sølberg J, Koch A, Skov L, Jakasa I, Kezic S, et al. Assessment of biomarkers in pediatric atopic dermatitis by tape strips and skin biopsies. Allergy 2022; 77: 1499–1509. https://doi.org/10.1111/all.15153
- Berdyshev E, Kim J, Kim BE, Goleva E, Lyubchenko T, Bronova I, et al. Stratum corneum lipid and cytokine biomarkers at age 2 months predict the future onset of atopic dermatitis. J Allergy Clin Immunol 2023; 151: 1307–1316. https://doi.org/10.1016/j.jaci.2023.02.013
- Olesen CM, Pavel AB, Wu J, Mikhaylov D, Del Duca E, Estrada Y, et al. Tape-strips provide a minimally invasive approach to track therapeutic response to topical corticosteroids in atopic dermatitis patients. J Allergy Clin Immunol Pract 2021; 9: 576–579.e3. https://doi.org/10.1016/j.jaip.2020.08.037
- Sølberg JBK, Quaade AS, Drici L, Sulek K, Ulrich NH, Løvendorf MB, et al. The proteome of hand eczema assessed by tape stripping. J Invest Dermatol 2023; 143: 1559–1568.e5. https://doi.org/10.1016/j.jid.2022.12.024
- Sølberg J, Ulrich NH, Krustrup D, Ahlström MG, Thyssen JP, Menné T, et al. Skin tape stripping: Which layers of the epidermis are removed? Contact Dermatitis 2019; 80: 319–321. https://doi.org/10.1111/cod.13199
- Clausen ML, Kezic S, Olesen CM, Agner T. Cytokine concentration across the stratum corneum in atopic dermatitis and healthy controls. Sci Rep 2020; 10: 21895. https://doi.org/10.1038/s41598-020-78943-6
- Fischer F, Doll A, Uereyener D, Roenneberg S, Hillig C, Weber L, et al. Gene expression-based molecular test as diagnostic aid for the differential diagnosis of psoriasis and eczema in formalin-fixed and paraffin-embedded tissue, microbiopsies, and tape strips. J Invest Dermatol 2023; 143: 1461–1469.e5. https://doi.org/10.1016/j.jid.2023.02.015
- He H, Bissonnette R, Wu J, Diaz A, Saint-Cyr Proulx E, Maari C, et al. Tape strips detect distinct immune and barrier profiles in atopic dermatitis and psoriasis. J Allergy Clin Immunol 2021; 147: 199–212. https://doi.org/10.1016/j.jaci.2020.05.048
- Del Duca E, He H, Liu Y, Pagan AD, David E, Cheng J, et al. Intrapatient comparison of atopic dermatitis skin transcriptome shows differences between tape-strips and biopsies. Allergy 2024; 79: 80–92. https://doi.org/10.1111/all.15845
- Rinnov MR, Halling AS, Gerner T, Ravn NH, Knudgaard MH, Trautner S, et al. Skin biomarkers predict development of atopic dermatitis in infancy. Allergy 2023; 78: 791–802. https://doi.org/10.1111/all.15518
- Simonsen S, Brøgger P, Kezic S, Thyssen JP, Skov L. Comparison of cytokines in skin biopsies and tape strips from adults with atopic dermatitis. Dermatology 2021; 237: 940–945. https://doi.org/10.1159/000514308
- Fritz B, Halling AS, Cort IDP, Christensen MO, Rønnstad ATM, Olesen CM, et al. RNA-sequencing of paired tape-strips and skin biopsies in atopic dermatitis reveals key differences. Allergy 2024; 79: 1548–1559. https://doi.org/10.1111/all.16086
- Méhul B, Laffet G, Séraïdaris A, Russo L, Fogel P, Carlavan I, et al. Noninvasive proteome analysis of psoriatic stratum corneum reflects pathophysiological pathways and is useful for drug profiling. Br J Dermatol 2017; 177: 470–488. https://doi.org/10.1111/bjd.15346
- Tsoi LC, Xing X, Xing E, Wasikowski R, Shao S, Zeng C, et al. Noninvasive tape-stripping with high-resolution RNA profiling effectively captures a preinflammatory state in nonlesional psoriatic skin. J Invest Dermatol 2022; 142: 1587–1596.e2. https://doi.org/10.1016/j.jid.2021.09.038
- Sølberg JBK, Quaade AS, Jacobsen SB, Andersen JD, Kampmann ML, Morling N, et al. The transcriptome of hand eczema assessed by tape stripping. Contact Dermatitis 2022; 86: 71–79. https://doi.org/10.1111/cod.14015
- Tam I, Hill KR, Park JM, Yu J. Skin tape stripping identifies gene transcript signature associated with allergic contact dermatitis. Contact Dermatitis 2021; 84: 308–316. https://doi.org/10.1111/cod.13749
- Brans R, Jakasa I, Goc S, John SM, Kezic S. Stratum corneum levels of inflammatory mediators and natural moisturizing factor in patch test reactions to thiurams and fragrances and their possible role in discrimination between irritant and allergic reactions to hapten mixtures. Contact Dermatitis 2021; 84: 299–307. https://doi.org/10.1111/cod.13746
- Bar J, Del Duca E, David E, Bose S, Chefitz G, Brunner PM, et al. Skin tape stripping reveals distinct biomarker profiles in chronic hand eczema of patients with and without comorbid atopic dermatitis. Allergy 2025; 80: 2271–2285. https://doi.org/10.1111/all.16466
- Mikhaylov D, Del Duca E, Guttman-Yassky E. Proteomic signatures of inflammatory skin diseases: a focus on atopic dermatitis. Expert Rev Proteomics 2021; 18: 345–361. https://doi.org/10.1080/14789450.2021.1935247
- Obi A, Rothenberg-Lausell C, Levit S, Del Duca E, Guttman-Yassky E. Proteomic alterations in patients with atopic dermatitis. Expert Rev Proteomics 2024; 21: 247–257. https://doi.org/10.1080/14789450.2024.2350938
- He H, Olesen CM, Pavel AB, Clausen ML, Wu J, Estrada Y, et al. Tape-strip proteomic profiling of atopic dermatitis on dupilumab identifies minimally invasive biomarkers. Front Immunol 2020; 11: 1768. https://doi.org/10.3389/fimmu.2020.01768
- Metwally NKA, de Boer F, Vreeken J, Ouwerkerk W, Rustemeyer T, van der Molen HF, et al. Comparison of three multiplex immunoassays for biomarker analysis in stratum corneum tape strips. Sci Rep 2025; 15: 40014. https://doi.org/10.1038/s41598-025-23579-7
- Løvendorf MB, Johansen JD, Skov L. BIOSKIn: a protocol for the Copenhagen Translational Skin Immunology Biobank and Research Programme. BMJ Open 2024; 14: e077207. https://doi.org/10.1136/bmjopen-2023-077207
- R Core Team. R: A language and environment for statistical computing. Vienna, Austria; 2023. Available from: https://www.R-project.org/
- Kassambara A. rstatix: pipe-friendly framework for basic statistical tests. 2023. Available from: https://CRAN.R-project.org/package=rstatix
- Dinno A. dunn.test: Dunn’s test of multiple comparisons using rank sums. 2024. Available from: https://CRAN.R-project.org/package=dunn.test
- Wickham H. ggplot2: Elegant graphics for data analysis. New York: Springer-Verlag; 2016. Available from: https://ggplot2.tidyverse.org
- Debets R, Hegmans JP, Croughs P, Troost RJ, Prins JB, Benner R, et al. The IL-1 system in psoriatic skIn: IL-1 antagonist sphere of influence in lesional psoriatic epidermis. J Immunol 1997; 158: 2955–2963. https://doi.org/10.4049/jimmunol.158.6.2955
- Sieminska I, Pieniawska M, Grzywa TM. The immunology of psoriasis-current concepts in pathogenesis. Clin Rev Allergy Immunol 2024; 66: 164–191. https://doi.org/10.1007/s12016-024-08991-7
- Elder JT, Fisher GJ, Lindquist PB, Bennett GL, Pittelkow MR, Coffey RJ, et al. Overexpression of transforming growth factor α in psoriatic epidermis. Science 1989; 243: 811–814. https://doi.org/10.1126/science.2916128
- Langan SM, Irvine AD, Weidinger S. Atopic dermatitis. Lancet 2020; 396: 345–360. https://doi.org/10.1016/S0140-6736(20)31286-1
- McAleer MA, Jakasa I, Hurault G, Sarvari P, McLean WHI, Tanaka RJ, et al. Systemic and stratum corneum biomarkers of severity in infant atopic dermatitis include markers of innate and T helper cell-related immunity and angiogenesis. Br J Dermatol 2019; 180: 586–596. https://doi.org/10.1111/bjd.17088
- Lee KH, Kim JD, Jeong DH, Kim SM, Park CO, Lee KH. Development of a novel microneedle platform for biomarker assessment of atopic dermatitis patients. Skin Res Technol 2023; 29: e13413. https://doi.org/10.1111/srt.13413
- Quaade AS, Litman T, Wang X, Becker C, McCauley BD, Sølberg JBK, et al. Transcriptomic profiling of chronic hand eczema skin reveals shared immune pathways and molecular drivers across subtypes. J Allergy Clin Immunol 2025; 155: 1250–1263. https://doi.org/10.1016/j.jaci.2024.12.1091
- Wiedemann J, Billi AC, Bocci F, Kashgari G, Xing E, Tsoi LC, et al. Differential cell composition and split epidermal differentiation in human palm, sole, and hip skin. Cell Rep 2023; 42: 111994. https://doi.org/10.1016/j.celrep.2023.111994
- Bou-Dargham MJ, Khamis ZI, Cognetta AB, Sang QXA. The role of interleukin-1 in inflammatory and malignant human skin diseases and the rationale for targeting interleukin-1 alpha. Med Res Rev 2017; 37: 180–216. https://doi.org/10.1002/med.21406
- Koppes SA, Brans R, Ljubojevic Hadzavdic S, Frings-Dresen MHW, Rustemeyer T, Kezic S. Stratum corneum tape stripping: monitoring of inflammatory mediators in atopic patients using topical therapy. Int Arch Allergy Immunol 2016; 170: 187–193. https://doi.org/10.1159/000448400
- Renert-Yuval Y, Thyssen JP, Bissonnette R, Bieber T, Kabashima K, Hijnen D, et al. Biomarkers in atopic dermatitis: a review on behalf of the International Eczema Council. J Allergy Clin Immunol 2021; 147: 1174–1190.e1. https://doi.org/10.1016/j.jaci.2021.01.013