ORIGINAL REPORT
ENO1 Knockdown Impedes Tumour Progression and Promotes Oxidative Phosphorylation in Cutaneous Squamous Cell Carcinoma
Liumei SONG1,5#, Sharui MA2,#, Shengbang WANG1, Xiu ZHANG3, Wenxin FAN4, Ning WANG1, Shuo FENG1, Qiqi DUAN1, Ruimin BAI1 and Yan ZHENG1
1Department of Dermatology, The First Affiliated Hospital of Xi’an Jiaotong University, Xi’an, 2Department of Endocrinology, Shaanxi Provincial People’s Hospital, Xi’an, 3Department of Dermatology, Affiliated Hospital of Zunyi Medical University, Zunyi, 4Department of Dermatology, Xi’an People’s Hospital, Xi’an, and 5Department of Pathology, The First Affiliated Hospital of Xi’an Jiaotong University, Xi’an, China
#Liumei Song and Sharui Ma contributed equally to this work.
Cutaneous squamous cell carcinoma (cSCC) is a common skin malignancy characterized by aggressive growth and metabolic reprogramming. Alpha-enolase (ENO1), a key glycolytic enzyme that is frequently over-expressed in cancer, has not been thoroughly investigated in cSCC, particularly with regard to how it coordinates glycolysis and oxidative phosphorylation (OXPHOS). ENO1 expression was interrogated in Gene Expression Omnibus datasets and validated in cSCC patient specimens. ENO1 was silenced in cSCC cell lines, and the resulting effects on cell viability, migration, invasion, apoptosis, and reactive oxygen species (ROS) levels were quantified. The impact of ENO1 knockdown on tumour growth was assessed in a xenograft model. Metabolic flux was analysed with Seahorse XFe96 extracellular-flux assays. ENO1 was significantly elevated in cSCC relative to normal skin and correlated positively with proliferative and invasive markers, but negatively with apoptosis markers. ENO1 silencing curtailed cell viability, migration, and invasion, while inducing apoptosis. Additionally, tumour growth was significantly impaired in vivo. Seahorse analysis showed that ENO1 knockdown suppressed glycolysis and redirected metabolic flux toward OXPHOS. Consistent with this shift, intracellular ROS increased and partially suppressed cell viability by modulating the ROS-sensitive Akt/mTOR pathway. In conclusion, ENO1 knockdown compromises tumorigenicity and promotes OXPHOS. Combining ENO1 inhibition with oxidative-stress-enhancing treatments, such as chemotherapy or radiotherapy, may further enhance efficacy.
SIGNIFICANCE
This study highlights the critical role of ENO1 in the progression of cutaneous squamous cell carcinoma. The elevated expression of ENO1 in cSCC tissues and its correlation with key tumour characteristics such as increased cell proliferation and invasion suggest that ENO1 promotes tumorigenicity. ENO1 knockdown impaired these malignant traits, slowed tumour growth, and altered metabolic pathways, including the suppression of glycolysis and the enhancement of oxidative phosphorylation, alongside an accumulation of reactive oxygen species. Targeting ENO1 is a promising therapeutic strategy for cSCC. Combining ENO1 inhibition with oxidative-stress-enhancing treatments, such as chemotherapy or radiotherapy, may further enhance efficacy.
Key words: ENO1; glycolysis; oxidative phosphorylation; skin neoplasms; Akt/mTOR.
Citation: Acta Derm Venereol 2025; 105: adv43849. DOI: https://doi.org/10.2340/actadv.v105.43849.
Copyright: 2025 © The Author(s). Published by MJS Publishing, on behalf of the Society for Publication of Acta Dermato-Venereologica. This is an Open Access article distributed under the terms of the Creative Commons Attribution-NonCommercial 4.0 International License (https://creativecommons.org/licenses/by-nc/4.0/).
Submitted: May 13, 2025. Accepted after revision: Nov 12, 2025. Published: Dec 18, 2025.
Corr: Yan Zheng, Department of Dermatology, The First Affiliated Hospital of Xi’an Jiaotong University, Xi’an, China. E-mail: zenyan66@126.com
Competing interests and funding: The authors have no conflicts of interest to declare.
INTRODUCTION
Cutaneous squamous cell carcinoma (cSCC), a subtype of keratinocyte carcinoma, primarily develops from keratinocytes in the interfollicular epidermis. Genetic changes in oncogenes and tumour suppressor genes are involved in the progression of actinic keratosis (AK) to cSCC, as well as in significant metabolic reprogramming (1). Metastasis develops in roughly 1–5% of primary cSCCs, yet the disease still accounts for about 4,000–8,800 deaths per year in the United States – a toll comparable to that of melanoma (2). These statistics underscore the critical need for more detailed characterization of cSCC to discover new therapeutic targets.
Alpha-enolase (ENO1), a widespread metalloenzyme, facilitates the conversion of 2-phospho-D-glycerate to phosphoenolpyruvate, a crucial step in the penultimate stage of the glycolytic pathway (3). Aerobic glycolysis through this enzyme potentially gives neoplastic cells a competitive edge in acquiring nutrients from surrounding tissues to meet the increased anabolic needs of neoplastic cells for proliferation (4). ENO1 overexpression is associated with increased tumour growth, invasion, and metastasis and increased glucose uptake (5).
Pertinent studies regarding the glycolytic role of ENO1 highlight its involvement in maintaining aerobic glycolysis in human pancreatic cancer cells. As a result of ENO1 knockdown, reactive oxygen species (ROS) levels are elevated, leading to cell growth inhibition and cell senescence (6). Notably, Dai et al. reported that the inhibition of ENO1 in human pulmonary artery smooth muscle cells impeded the metabolic shift toward glycolysis and led to growth suppression and apoptosis, which were primarily attributed to reduced activity of the AMPK/Akt/GSK3β signalling pathway (7). Additionally, in colorectal cancer cells, silencing ENO1 diminished cell growth, migration, invasion, and tumorigenesis via inhibition of mTOR pathway and activation of the AMPK pathway (8).
Nevertheless, ENO1 does not invariably act as an oncoprotein that enhances proliferation and reduces apoptosis in all tumours. White-Al Habeeb et al. established a significant association between elevated ENO1 expression and lower histological grade and clinical stage in patients with clear-cell renal cell carcinoma, in whom upregulated ENO1 levels were associated with improved disease-free survival and overall survival (9). Furthermore, Ejeskar et al. reported that increased ENO1 expression decelerated neuroblastoma cell proliferation and triggered apoptosis in a dose-dependent manner (10). The functional role of ENO1 in tumour progression is context dependent, and its specific impact on cSCC has yet to be fully elucidated.
We observed a substantial increase in ENO1 expression in cSCC tissues compared with normal epidermis tissue samples, which was consistent across public databases and our study cohort. Additionally, we found that ENO1 knockdown impeded cSCC cellular viability, migration, invasion, and tumour progression. Seahorse assay results demonstrated that ENO1 knockdown inhibited glycolysis and increased oxidative phosphorylation (OXPHOS) activity, a crucial source of ROS. Accordingly, we quantified intracellular ROS after ENO1 silencing and found that elevated ROS dampened cell viability in part by modulating the ROS‑sensitive Akt/mTOR signalling pathway.
MATERIALS AND METHODS
Patient samples
We retrieved 101 formalin-fixed, paraffin-embedded skin specimens (collected 2018–2024) from the Department of Dermatology, Second Affiliated Hospital, Xi’an Jiaotong University. The study group comprised 51 primary cSCCs – 32 well-differentiated (18 men, 14 women; age 38–80 years) and 19 moderately/poorly differentiated tumours (10 men, 9 women; age 36–94 years). The comparison cohort contained 50 normal-skin samples obtained during elective cosmetic procedures (23 men, 27 women; age 22–76 years). Two experienced pathologists independently confirmed the diagnoses. Prior to specimen collection, all patients and healthy volunteers provided written consent. The Institutional Ethics Committee of Xi’an Jiaotong University granted ethics approval for the study.
Microarray analysis
The mRNA expression profiles, along with relevant clinical data, were acquired from the Gene Expression Omnibus (GEO) database (http://www.ncbi.nlm.nih.gov/geo/). This retrieval included Dataset GSE98767, involving samples from 15 cSCC patients and 3 normal individuals, yielding a total of 54 samples, including triplicates (11). Additionally, Dataset GSE66359 (12) consisted of 5 normal human epidermal keratinocytes and 8 cSCC cell lines. Moreover, GSE45216 (13) comprised data from 30 cSCC and 10 actinic keratosis patients. Post quantile normalization and log2 fold change transformation, the findings were shown using through the ggpubr package (R Foundation for Statistical Computing, Vienna, Austria).
Western blot
Protein expression was quantified by Western blot, in accordance with methods described earlier (14). Detailed protocols and corresponding antibodies are provided in Appendix S1.
ENO1 knockdown
Lentiviral vectors carrying a scrambled control shRNA and 2 independent ENO1-targeting shRNAs (sh-ENO1-1 and sh-ENO1-2) were obtained from Shanghai Gene-pharma Company (Shanghai, China); their nucleotide sequences are provided in Table SI. The cell transfection procedure was carried out in accordance with the instructions provided by the manufacturer. After introducing the genetic material into the cells, the cells that consistently expressed the desired structures were chosen by treating them with a concentration of 5 μg/mL puromycin (ApexBio Technology, Boston, MA, USA).
Gene set enrichment analysis
Gene Set Enrichment Analysis (GSEA) (15) was utilized to analyze the distribution trends of predefined gene sets, ranked according to their Spearman correlation with ENO1 expression profiles. The gene sets, labeled “h.all.v2023.1.Hs.symbols”, were obtained from the Molecular Signatures Database (MSigDB; https://www.gsea-msigdb.org/gsea/msigdb). All relevant data were integrated into GSEA software (version 4.3.2). The significance of enrichment scores was evaluated through 1,000 permutations, setting a false discovery rate (FDR) threshold below 0.25 as significant for GSEA analysis. Enrichment plots from GSEA were generated using the “GseaVis” R package, available at (https://github.com/junjunlab/GseaVis).
Seahorse glycolytic stress test
Glycolytic function was assessed by monitoring the extracellular acidification rate (ECAR) with the Seahorse XF Glycolysis Stress Test Kit (Agilent Seahorse; Agilent Technologies, Santa Clara, CA, USA). Cells were plated in Seahorse 96-well microplates at 1 × 10⁴ cells per well, and the assay was performed following the manufacturer’s protocol and previously published procedures (16). Key metabolic modulators were then introduced sequentially: glucose (10 mM), oligomycin, an ATP synthase inhibitor (1 μM), and 2-deoxy-D-glucose, a glycolytic inhibitor (50 mM), at predetermined time points. ECAR measurements were taken to evaluate glycolytic parameters.
Statistical analysis
Statistical analyses were conducted using SPSS v26.0 (IBM Corp, Armonk, NY, USA) and GraphPad Prism 9.5.0 (https://www.graphpad.com/). Results are reported as mean ± SEM. Differences between 2 independent groups were evaluated with an unpaired, two-tailed Student’s t-test. Comparisons among 3 or more groups were assessed by one-way ANOVA. Immunohistochemistry staining intensities (–, +, ++, +++) were compared between normal skin and cSCC using the Pearson χ2 test and a 2-sided Mann–Whitney U test. A 2-sided p < 0.05 was taken as statistically significant. Additional methodological details are described in Appendix S1.
RESULTS
ENO1 expression is upregulated in cSCC
To explore the expression of ENO1 in cSCC at the transcriptional level, we assessed 3 publicly accessible datasets (GSE98767, GSE66359, and GSE45216). As shown in Fig. 1A, our analysis revealed that ENO1 mRNA levels were significantly greater in cSCC than in the normal skin or AK lesions (p < 0.001, p = 0.008, and p < 0.001, respectively). ENO1 expression was generally weak across the entire epidermis, with moderate to strong staining in only 16% of the normal skin samples (Fig. 1B and D). Conversely, nearly all malignant cells strongly expressed ENO1, with moderate to strong staining in 76.5% of the cSCC samples (Fig. 1C and D). The Mann–Whitney U test revealed significantly higher staining intensities in cSCC than in normal skin (p < 0.001). Additionally, western blot analysis revealed upregulated ENO1 protein levels in cSCC cell lines compared with those in primary epidermal keratinocytes (Fig. 1E).
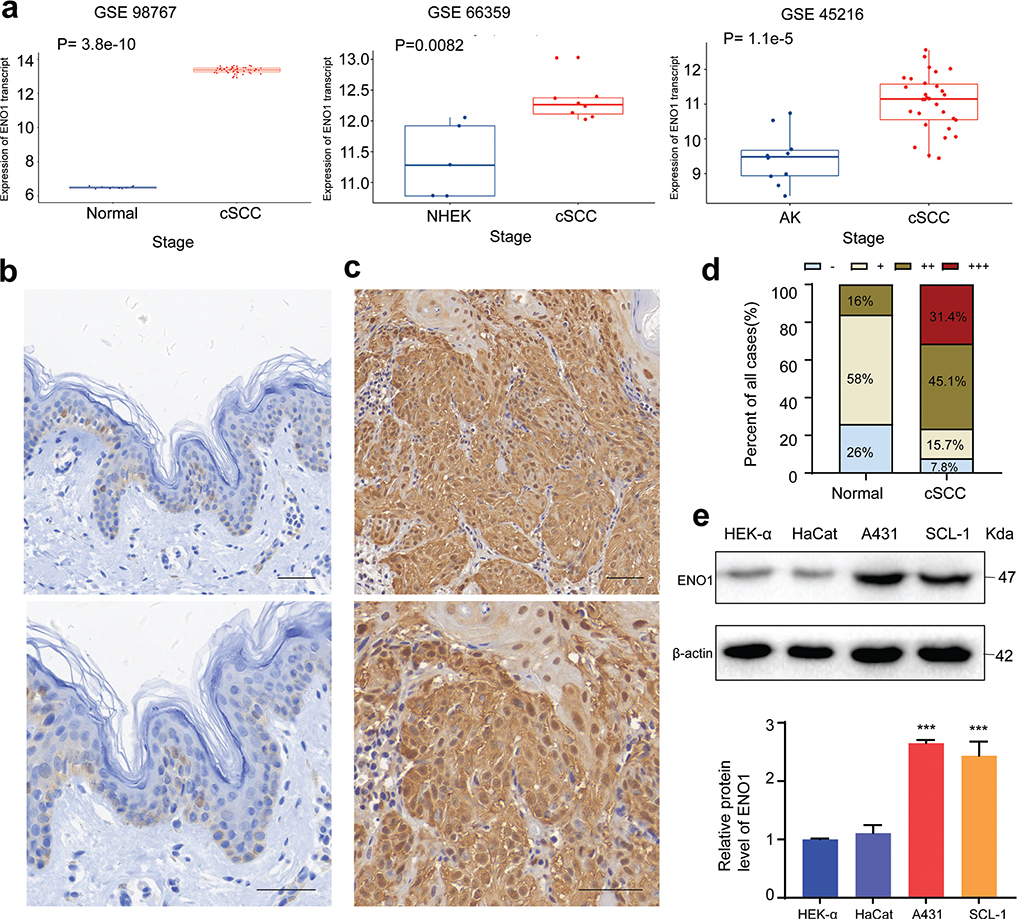
Fig. 1. Comparison of ENO1 expression in the normal skin and cSCC tissue samples and cells. (A) Analysis of GEO datasets GSE98767, GSE66359, and GSE45216 revealed significantly higher ENO1 expression in cSCC relative to normal skin and AK (Wilcoxon rank–sum test). Representative images showing ENO1 expression in (B) normal skin tissues and (C) cSCC lesions (scale bars = 50 μm for B and C). (D) Semiquantitative analysis of ENO1 levels by immunohistochemistry. (E) Relative protein levels of ENO1 in HEK-a, HaCaT, A431, and SCL-1 cells are shown, with β-actin serving as an internal control (n = 3). ***p < 0.001. cSCC: cutaneous squamous cell carcinoma; AK: actinic keratosis; NHEK: normal keratinocytes.
ENO1 knockdown limits cell viability and tumour growth
ENO1 knockdown was achieved with sh-ENO1-1 and sh-ENO1-2, and the efficacy of gene silencing was confirmed using western blot analysis (Fig. 2A). CCK-8 analysis showed a significant decrease in cell viability after ENO1 knock-down in both cell lines. This reduction was particularly evident at 48 and 72 h in comparison with the control group (Fig. 2B). To systematically assess the in vivo effects of ENO1 knockdown, we generated xenograft models by implanting cells of control and ENO1-knockdown clones into nude mice. Compared with the control mice, the mice harbouring ENO1-knockdown cells exhibited significantly reduced tumour diameters and decreased tumour weights, indicating a decreased proliferative capacity of ENO1-knockdown cells in vivo (Fig. 2C and D). Furthermore, immunohistochemical examination revealed significantly lower Ki-67 levels in the ENO1-knockdown group than those in the control group (Fig. 2E).
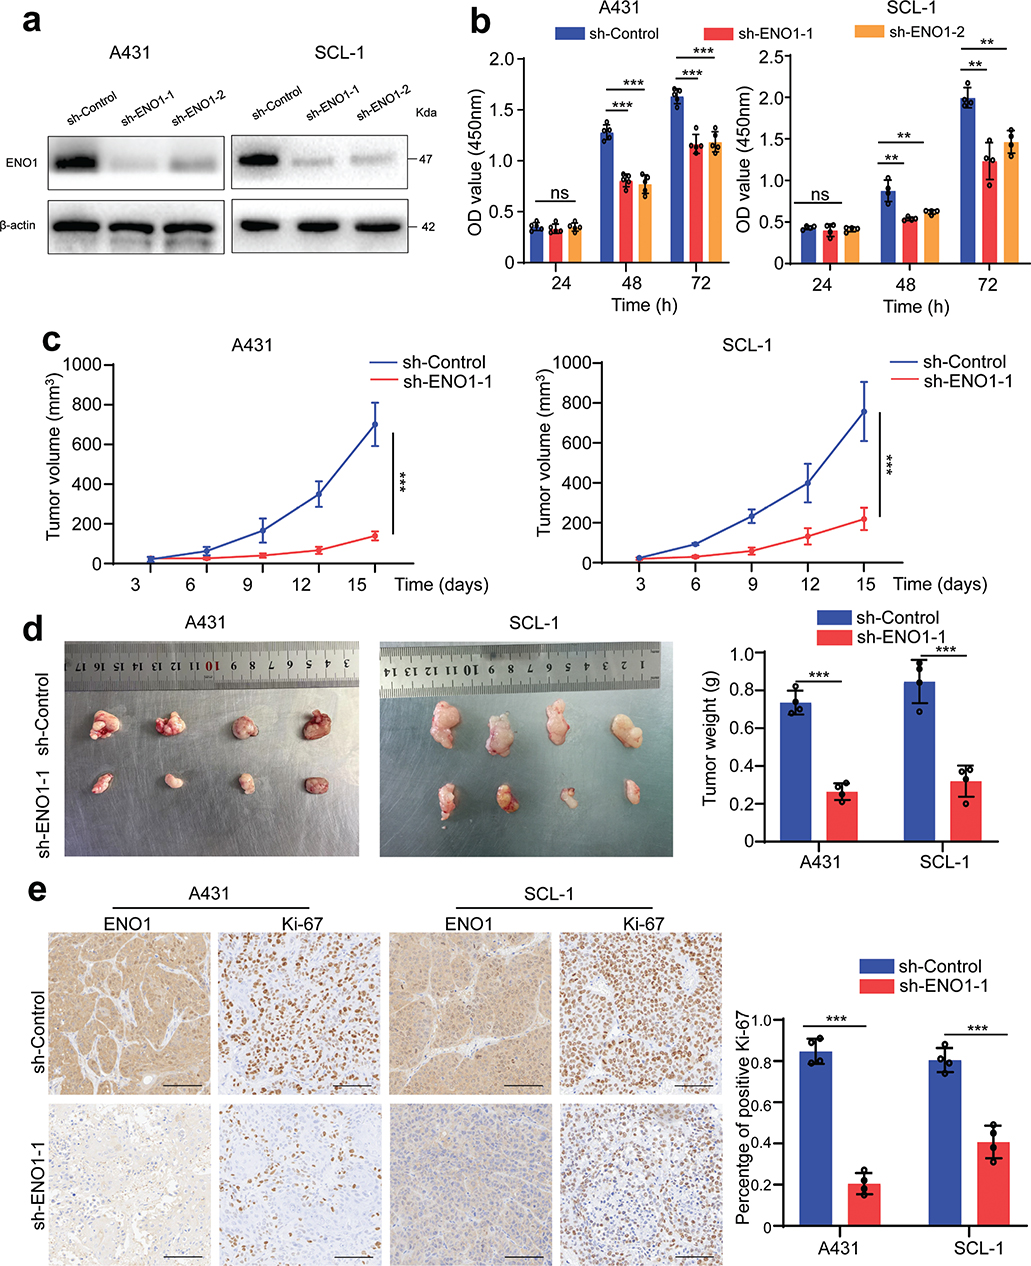
Fig. 2. Impact of ENO1 knockdown on cSCC cell viability and tumour growth. (A) Protein levels of ENO1 in A431 and SCL-1 cells after ENO1 knockdown. (B) Cell viability was assessed by the CCK-8 assay at 24, 48, and 72 h (n ≥ 4). (C) Tumour volumes were measured at the indicated time points post-implantation. (D) Tumour nodules of the xenograft models (left panel) and the corresponding tumour weights (right panel). (E) Immunohistochemical examination of Ki-67 expression was performed in xenograft tissues (scale bar = 100 μm), followed by the quantification of the proportion of Ki-67-positive cells. Statistical significance is presented as follows: ns: p ≥ 0.05; **p < 0.01 and ***p < 0.001. cSCC: cutaneous squamous cell carcinoma; sh-ENO1: ENO1 knockdown; sh-Control: control group; ns: not significant.
Effect of ENO1 knockdown on the cell cycle and apoptosis in cSCC cells
To explore the effects of ENO1 knockdown on the cell cycle and apoptosis, we first conducted Spearman correlation tests to examine the relationships between ENO1 levels and those of genes implicated in the cell cycle and apoptosis. Our results demonstrated robust positive correlations between the ENO1 levels and the expression levels of CDK2, CDK4, BCL-XL, and MCL-1, suggesting a regulatory connection between ENO1 and these associated genes (Fig. 3A). Subsequent flow cytometric analysis revealed that reduced ENO1 expression resulted in an increase in the percentage of cells in the G0/G1 phase and a concomitant decrease in the percentage of cells in the S phase (Fig. 3B). Additionally, western blotting was employed to evaluate the expression of CDK2, CDK4, and cyclin D1, and the results corroborated the cell cycle findings, revealing reduced levels of cyclin D1, CDK2, and CDK4 after ENO1 knockdown (Fig. 3C). To evaluate the impact of ENO1 knockdown on cSCC cell apoptosis, we performed flow cytometry and measured the enzymatic activities of caspase-9 and caspase-3. In control-transfected A431 and SCL-1 cells, we observed a basal apoptosis rate of 4–5%. By contrast, ENO1 knockdown led to increased apoptosis rates of 10–13% in these cell lines (Fig. 3D). Further analysis confirmed the induction of caspase-9 and caspase-3 activity upon ENO1 knockdown (Fig. 3E).
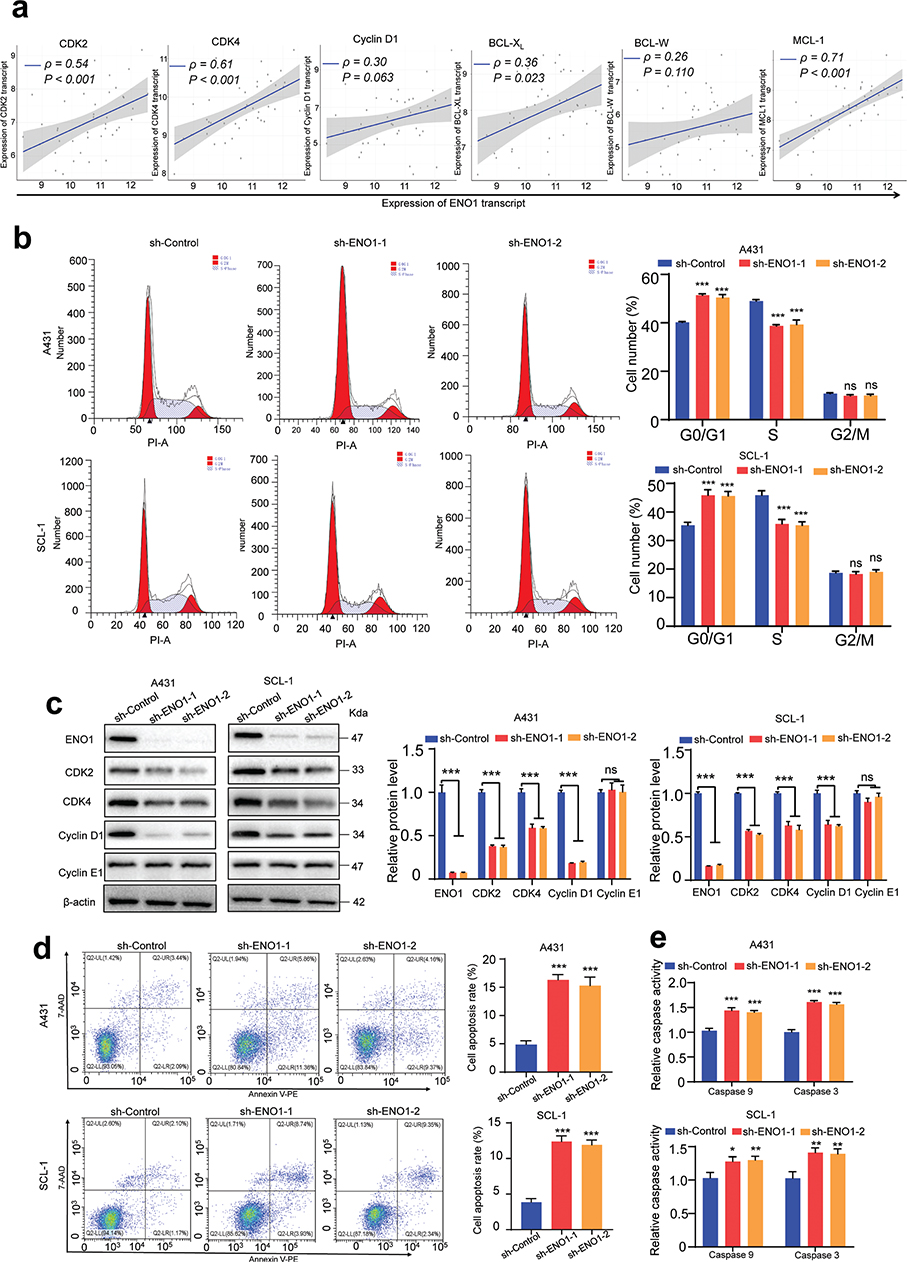
Fig. 3. Impact of ENO1 on the cell cycle and apoptosis in cSCC cells. (A) Spearman’s rank correlation between the ENO1 expression level and those of cell cycle and apoptosis regulators (CDK2, CDK4, cyclin D1, BCL-XL, BCL-W, and MCL-1) in the GSE45216 dataset. (B) Analysis of the cell cycle distribution post-ENO1 knockdown, as assessed by flow cytometry (n = 3). (C) Western blot analysis of cell cycle-related proteins (CDK2, CDK4, cyclin D1, and cyclin E1) following ENO1 knockdown, with β-actin serving as an internal control (n = 3). (D) Apoptosis assessment via annexin V/7-AAD staining and flow cytometry after ENO1 knockdown (n = 3). (E) Measurement of relative caspase-9 and caspase-3 activities after ENO1 knockdown (n = 3). Statistical significance is presented as follows: ns: p ≥ 0.05; *p < 0.05 and ***p < 0.001. cSCC: cutaneous squamous cell carcinoma; CDK: cyclin-dependent kinase; sh-ENO1: ENO1 knockdown; sh-Control: control group; ns: not significant.
ENO1 knockdown inhibits the migration and invasion of cSCC cells
To examine whether there is an association between ENO1 expression and tumour metastasis, the correlations between ENO1 levels and those of metastasis-related molecular markers were determined by Spearman analysis. Analysis of the GSE45216 dataset indicated that ENO1 levels were positively correlated with those of N-cadherin, MMP1, and MMP10 and negatively correlated with the levels of E-cadherin (Fig. 4A). The wound healing assay showed that ENO1 silencing reduced the motility of A431 and SCL-1 cells (Fig. 4B). Furthermore, the number of ENO1-knockdown cells that crossed the Transwell membrane or the Matrigel-coated membrane was lower than that of control cells (Fig. 4C and D). The levels of the metastasis-associated proteins E-cadherin, N-cadherin, and MMP1 were also investigated. The findings indicated that ENO1 knockdown markedly reduced the expression of N-cadherin and MMP1 (Fig. 4E), suggesting a potential inhibitory influence of ENO1 on metastatic traits.
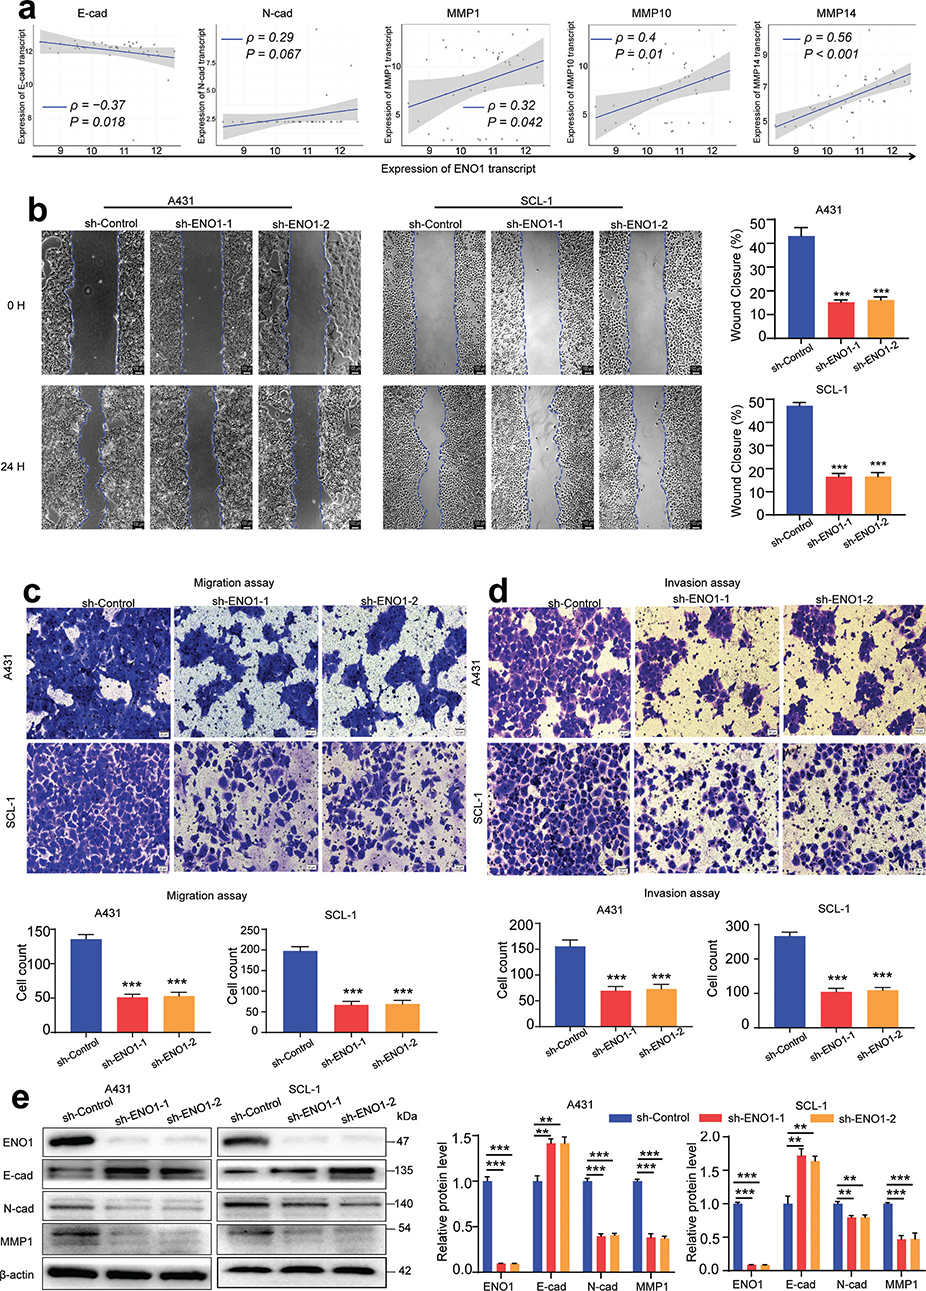
Fig. 4. Influence of ENO1 on cSCC cell migration and invasion. (A) Spearman’s rank correlation between ENO1 expression and the expression of EMT markers (E-cadherin, N-cadherin, MMP1, MMP10, and MMP14) in the GSE45216 dataset. (B) Wound healing assay, (C) Transwell migration assay, and (D) Transwell invasion assay following ENO1 knockdown (n = 3). (E) Western blot analysis of EMT markers (E-cadherin, N-cadherin, and MMP1) after ENO1 knockdown (n = 3). Statistical significance is presented as follows: **p < 0.01 and ***p < 0.001. cSCC: cutaneous squamous cell carcinoma; EMT: epithelial-to-mesenchymal transition; MMP: matrix metallopeptidase; sh-ENO1:, ENO1 knockdown; sh-Control: control group.
ENO1 knockdown compromises glycolysis and promotes oxidative phosphorylation in cSCC cells
To assess the effects of ENO1 knockdown on glycolysis and oxidative phosphorylation, we employed a Seahorse XFe96 analyser to evaluate cellular metabolism. Our focus was to determine the oxygen consumption rate (OCR) and extracellular acidification rate (ECAR). The findings of the Seahorse assay demonstrated that reducing ENO1 expression greatly decreased the ECAR and simultaneously increased the OCR in cSCC cells. Specifically, the XF glycolytic stress test revealed that ENO1 depletion diminished basal glycolysis, the glycolytic capacity, and the glycolytic reserve in shENO1 cells (Fig. 5A and B), indicating a reduction in the glycolytic activity and capacity due to ENO1 knockdown. Moreover, the XF Mito stress test indicated that ENO1 downregulation enhanced basal and maximal respiration in shENO1 cells, which suggested an increase in oxidative phosphorylation (Fig. 5C and D). Consequently, this led to a higher OCR/ECAR ratio, indicating that ENO1 knockdown promoted a metabolic shift from glycolysis to mitochondrial respiration.
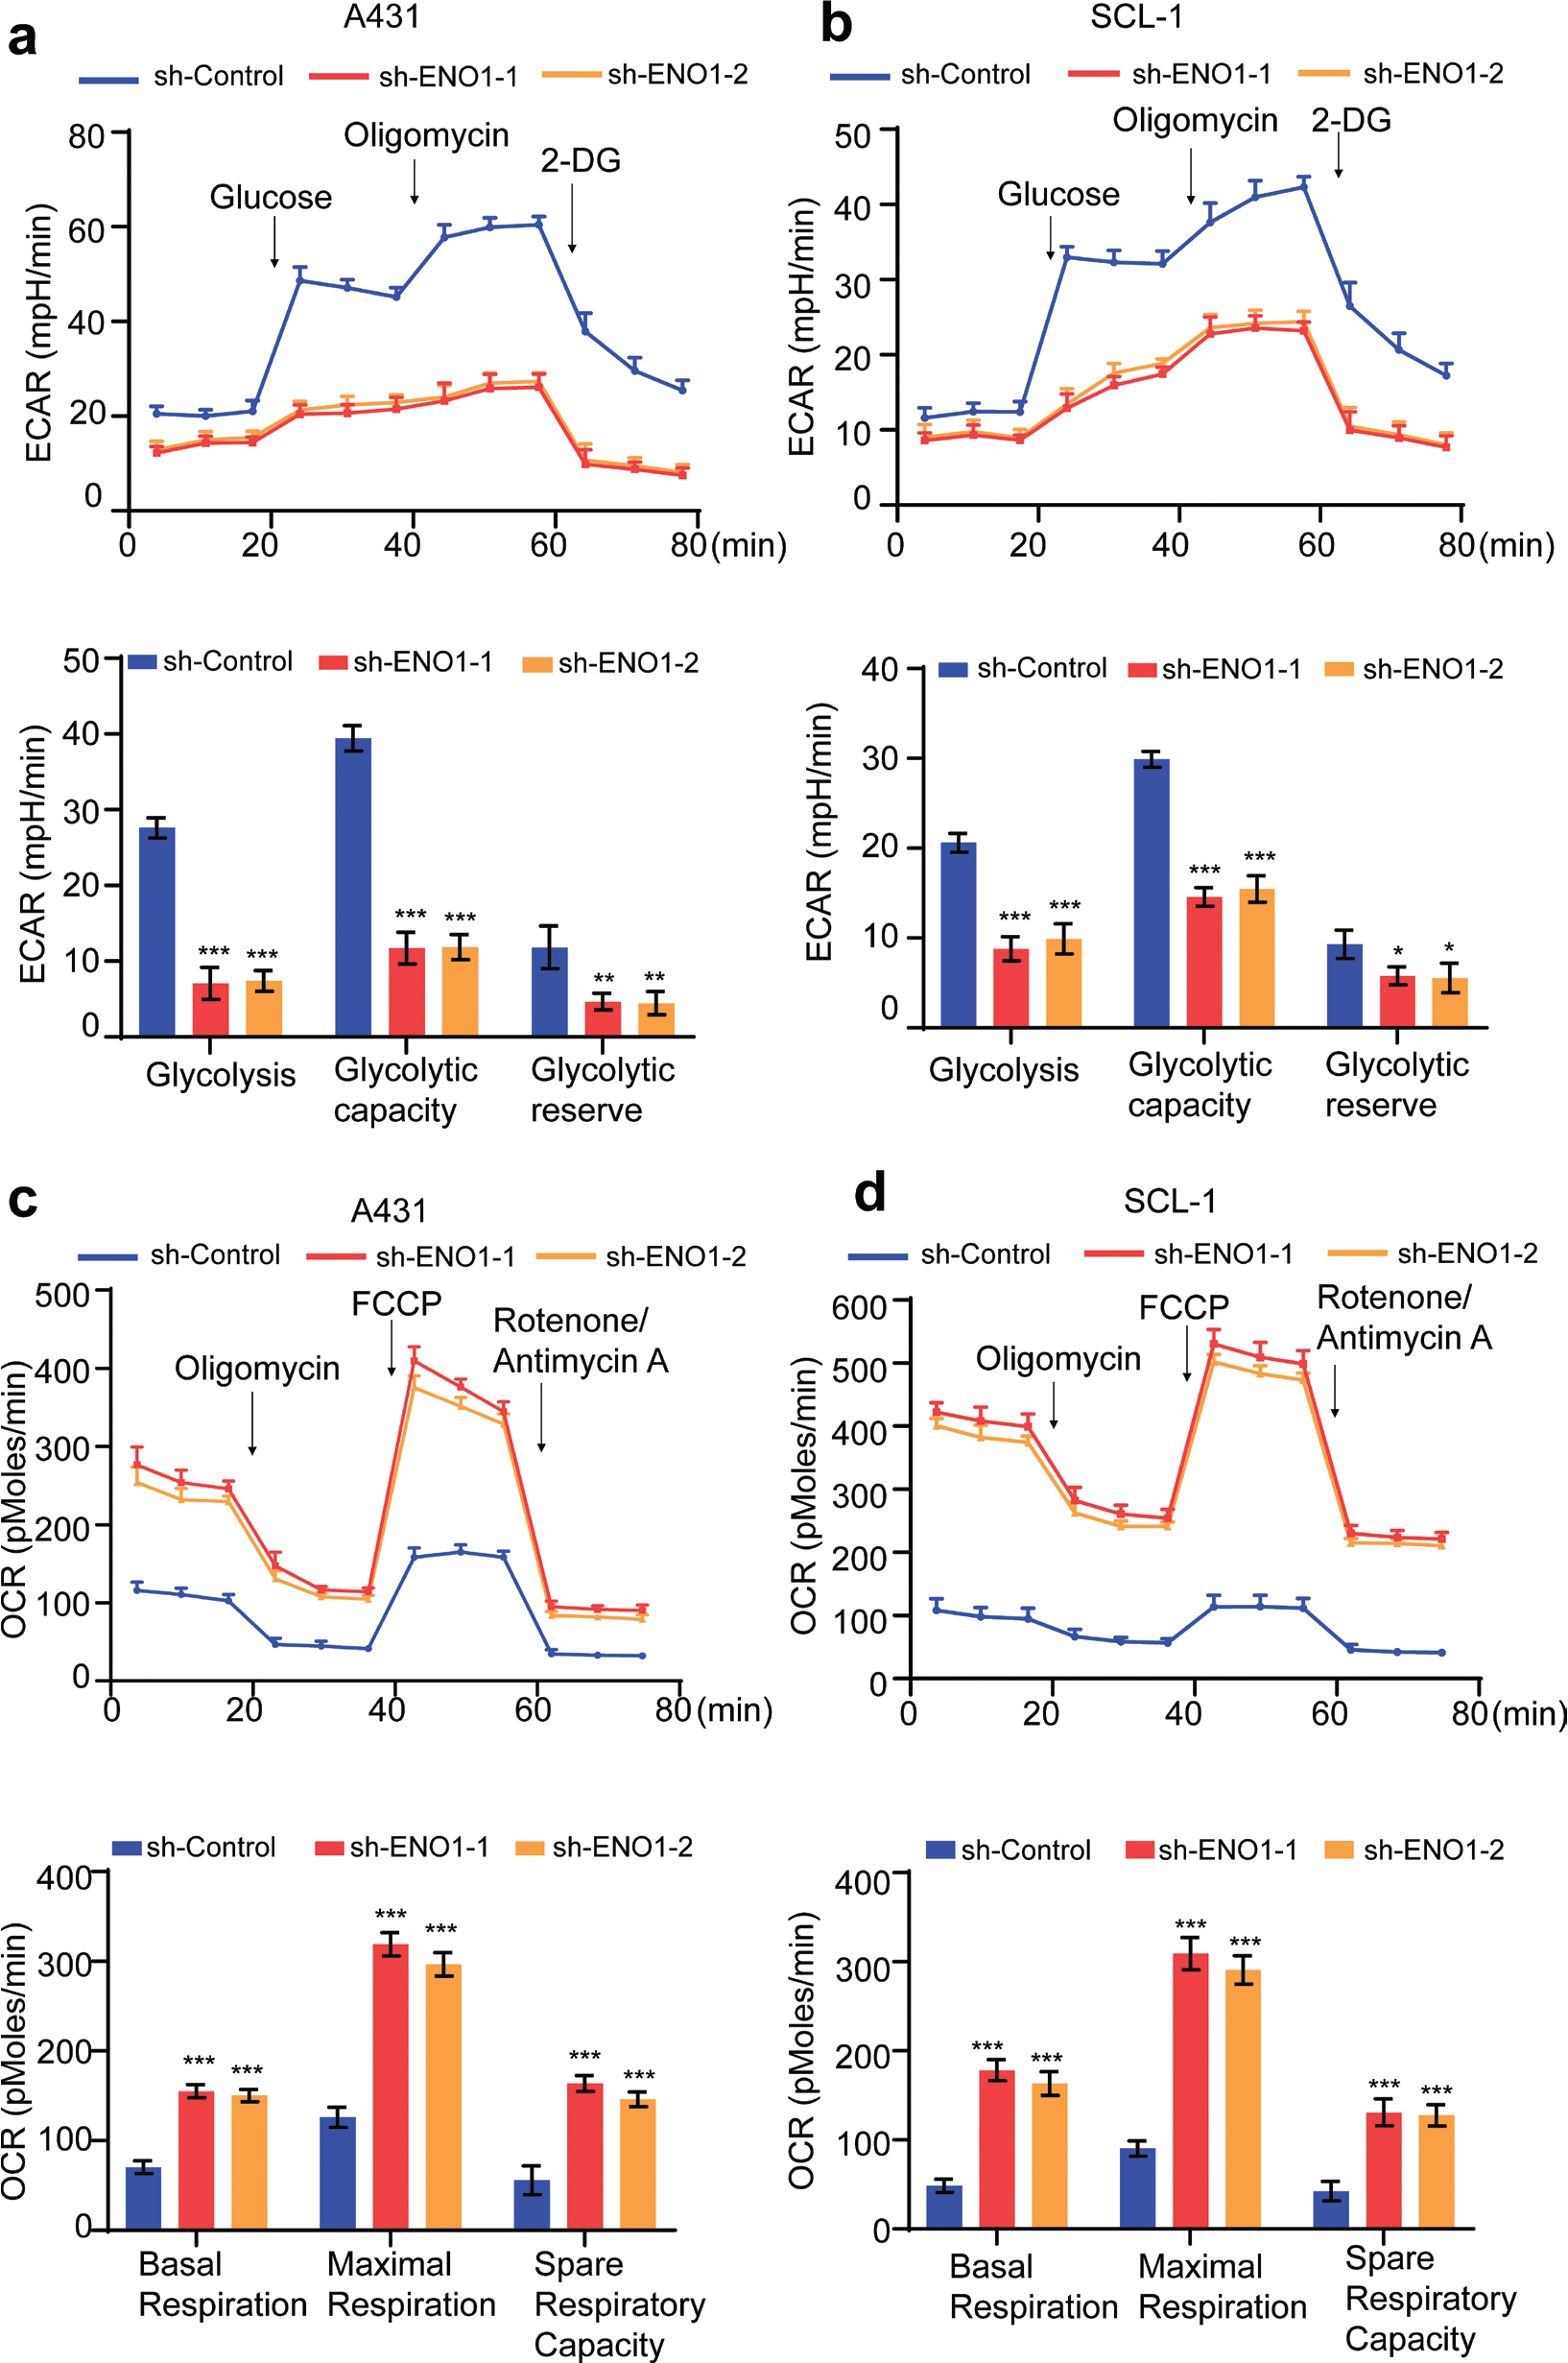
Fig. 5. Effects of ENO1 knockdown on metabolic alterations, resulting in glycolysis repression and oxidative phosphorylation enhancement. (A, B) Measurement of the ECAR in control and ENO1-knockdown A431 and SCL-1 cells using a Seahorse XF96 analyser. ECAR curves obtained following sequential cell treatment with glucose, oligomycin, and 2-deoxyglucose (2-DG) are shown in the upper panels, with black arrows indicating treatment time points. The lower panels depict the calculated glycolysis levels, glycolytic capacity, and glycolytic reserve (n = 3). (C, D) Measurement of the OCR in control and ENO1-knockdown A431 and SCL-1 cells following sequential cell treatment with the indicated compounds (upper panels). The lower panels present quantified OXPHOS parameters, including basal and maximal respiration and the spare respiratory capacity (n = 3). Statistical significance is presented as follows: *p < 0.05, **p < 0.01, and ***p < 0.001. sh-ENO1:, ENO1 knockdown; sh-Control: control group; ECAR: extracellular acidification rate; OCR: oxygen consumption rate; OXPHOS: oxidative phosphorylation.
ENO1 knockdown induces ROS-mediated inhibition of Akt/mTOR signalling
The GSEA method was utilized to investigate the pathways associated with increased expression of ENO1. The results indicated significant enrichment in gene sets related to the mTORC1, G2M checkpoint, and PI3K/Akt/mTOR pathways (Fig. 6A). Increased oxidative phosphorylation is known to augment ROS production (17). Based on the results shown in Figs. 5 and 6A, we postulated that ENO1 knockdown inhibited cell viability by inducing ROS generation, which subsequently suppressed the Akt/mTOR pathway. Further analysis using flow cytometry confirmed that the intracellular ROS levels were elevated in A431 and SCL-1 cells following ENO1 knockdown (Fig. 6B). Notably, the introduction of an ROS scavenger, N-acetylcysteine (NAC), at a concentration of 5 mM effectively counteracted the inhibition of A431 and SCL-1 cell viability by ENO1 silencing (Fig. 6C). These data suggest that ROS accumulation is a crucial factor in the viability-suppressive effects of ENO1 knockdown on cSCC cells. To further test this hypothesis, A431 and SCL-1 cells were cultured with or without the addition of 5 mM NAC for 48 h. Western blotting showed that ENO1 knockdown reduced p-Akt and p-mTOR levels in A431 and SCL-1 cells, and that NAC treatment partially rescued this loss of phosphorylation (Fig. 6D and E). These findings suggested that ROS accumulation contributed to partial inactivation of the Akt/mTOR pathway.
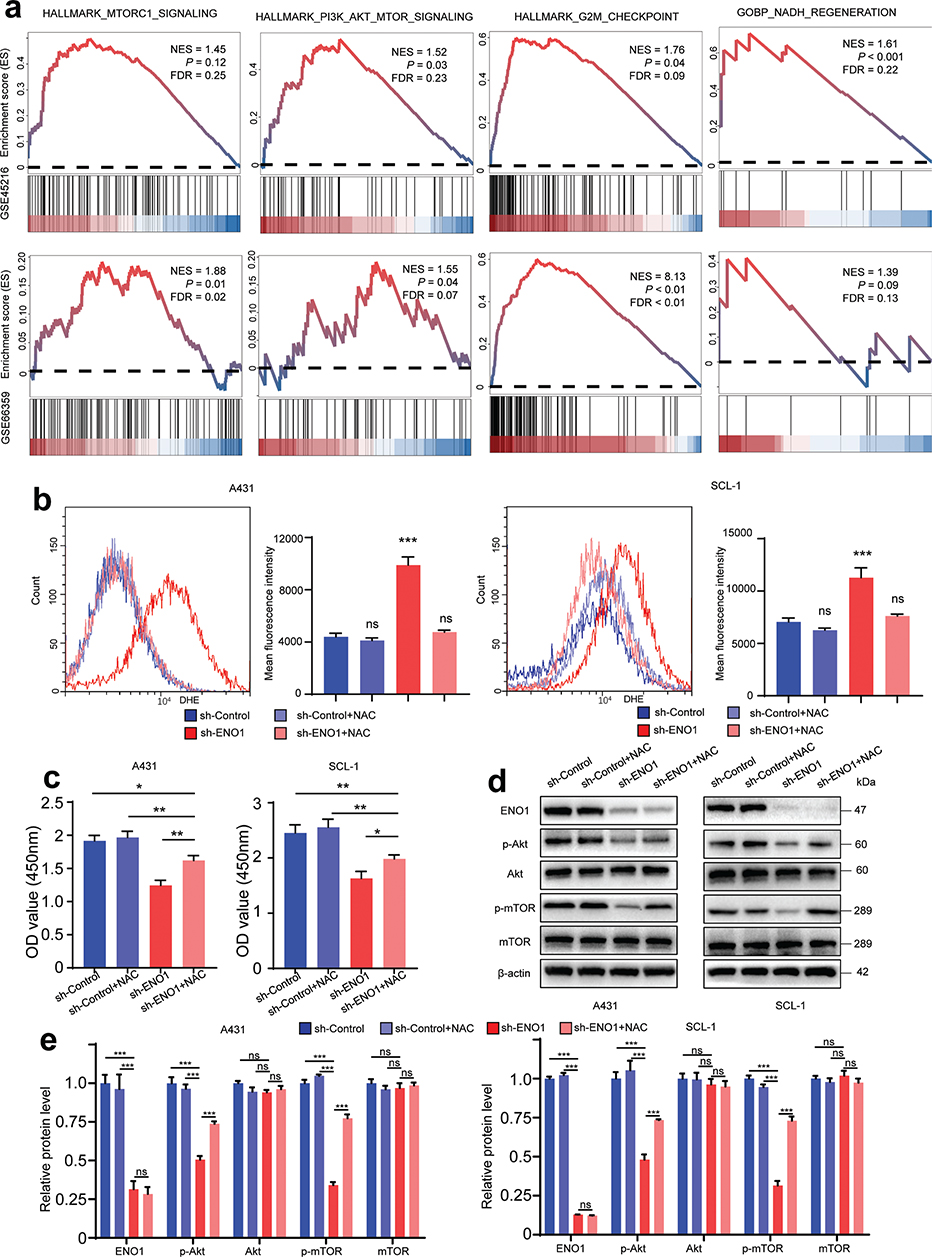
Fig. 6. ENO1 knockdown induces ROS-mediated inhibition of Akt/mTOR signalling. (A) GSEA revealed a positive correlation between ENO1 expression levels and cancer-related pathways. (B) Cells were initially treated with or without 5 mM NAC for 2 h, followed by a 1-h incubation with a DHE fluorescent probe. The results of subsequent flow cytometry analysis are shown in the left panels. The mean fluorescence intensity is shown in the right panels (n = 3). (C) Cells were treated with 5 mM NAC for 48 h, after which cell viability was assessed using the CCK-8 assay (n = 3). (D, E) Western blot evaluated the protein levels of Akt, p-Akt, mTOR, and p-mTOR after treatment with or without 5 mM NAC (n = 3). Statistical significance is presented as follows: ns: p ≥ 0.05; *p < 0.05, **p < 0.01, and ***p < 0.001. GSEA: gene set enrichment analysis; NES: normalized enrichment score; FDR: false discovery rate; NAC: N-acetylcysteine; sh-ENO1: ENO1 knockdown; sh-Control: control group.
DISCUSSION
In our research, we noted a marked increase in ENO1 expression in cSCC tissues relative to normal cutaneous tissue samples, which was consistently observed across publicly accessible databases and our own dataset. The overexpression of ENO1 and its significant oncogenic roles have been documented across multiple malignancies, including non-small cell lung carcinoma, colorectal cancer, and glioma (18–20). Our current evidence demonstrated positive correlations between ENO1 levels and those of markers of cellular proliferation, migration, and invasion, and a negative correlation between ENO1 levels and cell apoptosis. Furthermore, we observed that the knockdown of ENO1 impaired these malignant characteristics and induced apoptosis. Other academic studies have also outlined comparable regulatory impacts of ENO1. In both non-small cell lung cancer and bladder cancer, the observed upregulation of ENO1 was associated with elevated levels of β-catenin and the induction of its downstream targets, such as cyclin D1. This regulatory sequence promoted cellular growth and proliferation (19,21). Additionally, ENO1 expression is positively correlated with Ki-67 expression in pancreatic cancer (22). In glioma, cyclin D1 and cyclin E1 expression was significantly impaired when ENO1 was knocked down. Furthermore, reducing ENO1 expression decreased Snail, vimentin, and N-cadherin levels while simultaneously elevating E-cadherin expression (23).
A significant discovery from our study was the interaction between glycolysis and OXPHOS in cancer cells. We found that ENO1 knockdown inhibited glycolysis and increased OXPHOS activity. These observations challenged Otto Warburg’s well-known hypothesis, which proposed that cancer cells rely on aerobic glycolysis because of irreversible mitochondrial damage. However, this hypothesis faced skepticism, especially given emerging evidence showing the preservation of mitochondrial OXPHOS capabilities in cancers, such as diffuse large B-cell lymphoma, melanoma, and pancreatic cancer (24–26), despite active glycolysis. In line with these studies, we observed the persistence of OXPHOS capabilities in cSCC, particularly after ENO1 depletion.
When ENO1 was depleted, a metabolic shift from glycolysis to OXPHOS occurred to maintain bioenergetics and support biosynthesis. This shift was supported by findings suggesting that mitochondrial function in cSCC retained functional OXPHOS activity, necessary for the growth of cSCC cells (27). In pancreatic cancer cells, human cervical cancer cells, and human lung adenocarcinoma cells, suppression of glycolysis led cancer cells to upregulate mitochondrial function and rely on OXPHOS for ATP production to survive (6, 28). Regarding biosynthesis, the electron transport chain (ETC) is crucial for sustaining aspartate synthesis, a proteogenic amino acid that also acts as a precursor for purine and pyrimidine synthesis, thereby promoting cancer cell proliferation (29). The observed inhibition of glycolysis and the subsequent enhancement of OXPHOS in cSCC could potentially be generalized to other cancer types. This assertion was supported by accumulating evidence indicating similar metabolic reprogramming across various cancers, including colon cancer cells (30) and liver cancer cells (31). Additionally, the reactivation of OXPHOS following glycolysis inhibition was reported in breast cancer cells, where a shift from glycolysis to mitochondrial respiration was observed after radiation exposure (32).
Moreover, heightened OXPHOS activity may result in a propensity for increased ROS generation (33). ROS function as critical signalling molecules that occur naturally as byproducts of cellular metabolism. Excessive ROS accumulation has been associated with tumour growth suppression, with ROS serving as key mediators that induce apoptosis and arrest the cell cycle via various cellular pathways (34). Our findings indicated that ENO1 knockdown led to a significant increase in ROS accumulation and inhibition of cSCC cell viability; this inhibitory effect was partially reversed by concurrent treatment with the ROS scavenger NAC. Cells with inherent oxidative stress dependency are more vulnerable to additional oxidative stress (35), which potentially influences downstream pathways to induce cancer cell death.
Accumulating evidence has established a strong connection between the suppression of the Akt/mTOR cascade and the accumulation of ROS, indicating the involvement of the Akt/mTOR pathway in mediating ROS-induced tumour suppression (36). In this study, we demonstrated substantial repression of the Akt/mTOR pathway, which was effectively reversed by the treatment of ENO1-knockdown cSCC cells with NAC. This inhibition of the pathway was likely responsible for the observed attenuation of cSCC cell viability. The relationship between ROS and the mTOR pathway is intricate, as ROS play dual roles as both promoters and suppressors in signalling pathways (37). Recently, the inhibition of the Akt/mTOR axis was shown to be dependent on ROS in the context of Nexrutine®-mediated melanoma inhibition (38). Furthermore, the interplay between ferritinophagy and ROS generation has been linked to the suppression of EMT in gastric cancer cells, mainly through the Akt/mTOR axis (39). The ability of cancer cells to adapt to long-lasting oxidative stress can result in a stimulating effect. However, if the levels of ROS continue to increase, there is the potential for oxidative damage, inhibition of the Akt/mTOR pathway, and eventual impairment of cancer cell viability (35). The underlying metabolism-associated mechanisms require further investigation.
In conclusion, our findings highlight a critical role for ENO1 in cSCC. ENO1 knockdown inhibited cSCC cell viability, migration, and invasion, induced apoptosis in vitro, and slowed tumour growth in vivo. The Seahorse assay showed that ENO1 silencing suppressed glycolysis, promoted oxidative phosphorylation (OXPHOS), and boosted reactive oxygen species (ROS) production. Mechanistically, the resulting ROS partially impeded cSCC cell viability through repression of the Akt/mTOR pathway. These results provide a new potential approach to cancer therapy, suggesting that targeting ENO1 in combination with treatments that enhance oxidative stress, such as chemotherapy and radiation, could be promising.
ACKNOWLEDGEMENTS
The authors express their gratitude to Professor Yi Lv and his team at the National Local Joint Engineering Research Center for Precision Surgery and Regenerative Medicine, and the Shaanxi Province Center for Regenerative Medicine and Surgery Engineering Research, for their valuable advice and the provision of laboratory facilities.
This study received funding from the National Natural Science Foundation of China (Grant No. 82273541), with partial support from Shaanxi Province Science Foundation for Youths (Grant No. 2024JC-YBQN-0916), the Youth Fund of the National Natural Science Foundation of China (No. 82403902), as well as from the institutional foundation of the First Affiliated Hospital of Xi’an Jiaotong University (Grant No. QYJC06).
The data generated during the current study are available from the corresponding author upon reasonable request.
Prior to specimen collection, all patients and healthy volunteers provided written consent. The Institutional Ethics Committee of Xi’an Jiaotong University granted ethics approval for the study.
REFERENCES
- Quadri M, Marconi A, Sandhu SK, Kiss A, Efimova T, Palazzo E. Investigating cutaneous squamous cell carcinoma in vitro and in vivo: novel 3D tools and animal models. Front Med (Lausanne) 2022; 9: 875517. https://doi.org/10.3389/fmed.2022.875517
- Levine DE, Karia PS, Schmults CD. Outcomes of patients with multiple cutaneous squamous cell carcinomas: a 10-year single-institution cohort study. JAMA Dermatol 2015; 151: 1220–1225. https://doi.org/10.1001/jamadermatol.2015.1702
- Kang HJ, Jung SK, Kim SJ, Chung SJ. Structure of human alpha-enolase (hENO1), a multifunctional glycolytic enzyme. Acta Crystallogr D Biol Crystallogr 2008; 64: 651–657. https://doi.org/10.1107/S0907444908008561
- Jiang P, Du W, Wu M. Regulation of the pentose phosphate pathway in cancer. Protein Cell 2014; 5: 592–602. https://doi.org/10.1007/s13238-014-0082-8
- Sun L, Lu T, Tian K, Zhou D, Yuan J, Wang X, et al. Alpha-enolase promotes gastric cancer cell proliferation and metastasis via regulating AKT signaling pathway. Eur J Pharmacol 2019; 845: 8–15. https://doi.org/10.1016/j.ejphar.2018.12.035
- Capello M, Ferri-Borgogno S, Riganti C, Chattaragada MS, Principe M, Roux C, et al. Targeting the Warburg effect in cancer cells through ENO1 knockdown rescues oxidative phosphorylation and induces growth arrest. Oncotarget 2016; 7: 5598–5612. https://doi.org/10.18632/oncotarget.6798
- Dai J, Zhou Q, Chen J, Rexius-Hall ML, Rehman J, Zhou G. Alpha-enolase regulates the malignant phenotype of pulmonary artery smooth muscle cells via the AMPK-Akt pathway. Nat Commun 2018; 9: 3850. https://doi.org/10.1038/s41467-018-06376-x
- Zhan P, Zhao S, Yan H, Yin C, Xiao Y, Wang Y, et al. Alpha-enolase promotes tumorigenesis and metastasis via regulating AMPK/mTOR pathway in colorectal cancer. Mol Carcinog 2017; 56: 1427–1437. https://doi.org/10.1002/mc.22603
- White-Al Habeeb NM, Di Meo A, Scorilas A, Rotondo F, Masui O, Seivwright A, et al. Alpha-enolase is a potential prognostic marker in clear cell renal cell carcinoma. Clin Exp Metastasis 2015; 32: 531–541. https://doi.org/10.1007/s10585-015-9725-2
- Ejeskar K, Krona C, Caren H, Zaibak F, Li L, Martinsson T, et al. Introduction of in vitro transcribed ENO1 mRNA into neuroblastoma cells induces cell death. BMC Cancer 2005; 5: 161. https://doi.org/10.1186/1471-2407-5-161
- Garcia-Diez I, Hernandez-Munoz I, Hernandez-Ruiz E, Nonell L, Puigdecanet E, Bodalo-Torruella M, et al. Transcriptome and cytogenetic profiling analysis of matched in situ/invasive cutaneous squamous cell carcinomas from immunocompetent patients. Genes Chromosomes Cancer 2019; 58: 164–174. https://doi.org/10.1002/gcc.22712
- Farshchian M, Nissinen L, Siljamäki E, Riihilä P, Toriseva M, Kivisaari A, et al. EphB2 promotes progression of cutaneous squamous cell carcinoma. J Invest Dermatol 2015; 135: 1882–1892. https://doi.org/10.1038/jid.2015.104
- Lambert SR, Mladkova N, Gulati A, Hamoudi R, Purdie K, Cerio R, et al. Key differences identified between actinic keratosis and cutaneous squamous cell carcinoma by transcriptome profiling. Br J Cancer 2014; 110: 520–529. https://doi.org/10.1038/bjc.2013.760
- Wang S, Zhang X, Lei H, Song L, Huang Y, Kang T, et al. Proline-rich 11 (PRR11) promotes the progression of cutaneous squamous cell carcinoma by activating the EGFR signaling pathway. Mol Carcinog 2023; 62: 613–627. https://doi.org/10.1002/mc.23510
- Subramanian A, Tamayo P, Mootha VK, Mukherjee S, Ebert BL, Gillette MA, et al. Gene set enrichment analysis: a knowledge-based approach for interpreting genome-wide expression profiles. Proc Natl Acad Sci U S A 2005; 102: 15545–15550. https://doi.org/10.1073/pnas.0506580102
- Ma S, Wang N, Liu R, Zhang R, Dang H, Wang Y, et al. ZIP10 is a negative determinant for anti-tumor effect of mannose in thyroid cancer by activating phosphate mannose isomerase. J Exp Clin Cancer Res 2021; 40: 387. https://doi.org/10.1186/s13046-021-02195-z
- Nolfi-Donegan D, Braganza A, Shiva S. Mitochondrial electron transport chain: oxidative phosphorylation, oxidant production, and methods of measurement. Redox Biol 2020; 37: 101674. https://doi.org/10.1016/j.redox.2020.101674
- Chen S, Zhang Y, Wang H, Zeng YY, Li Z, Li ML, et al. WW domain-binding protein 2 acts as an oncogene by modulating the activity of the glycolytic enzyme ENO1 in glioma. Cell Death Dis 2018; 9: 347. https://doi.org/10.1038/s41419-018-0376-5
- Fu QF, Liu Y, Fan Y, Hua SN, Qu HY, Dong SW, et al. Alpha-enolase promotes cell glycolysis, growth, migration, and invasion in non-small cell lung cancer through FAK-mediated PI3K/AKT pathway. J Hematol Oncol 2015; 8: 22. https://doi.org/10.1186/s13045-015-0117-5
- Zhan P, Zhao S, Yan H, Yin C, Xiao Y, Wang Y, et al. α-enolase promotes tumorigenesis and metastasis via regulating AMPK/mTOR pathway in colorectal cancer. Mol Carcinog 2017; 56: 1427–1437. https://doi.org/10.1002/mc.22603
- Ji M, Wang Z, Chen J, Gu L, Chen M, Ding Y, et al. Up-regulated ENO1 promotes the bladder cancer cell growth and proliferation via regulating beta-catenin. Biosci Rep 2019; 39: BSR20190503. https://doi.org/10.1042/BSR20190503
- Li Y, Li Y, Luo J, Fu X, Liu P, Liu S, et al. FAM126A interacted with ENO1 mediates proliferation and metastasis in pancreatic cancer via PI3K/AKT signaling pathway. Cell Death Discov 2022; 8: 248. https://doi.org/10.1038/s41420-022-01047-9
- Song Y, Luo Q, Long H, Hu Z, Que T, Zhang X, et al. Alpha-enolase as a potential cancer prognostic marker promotes cell growth, migration, and invasion in glioma. Mol Cancer 2014; 13: 65. https://doi.org/10.1186/1476-4598-13-65
- Masoud R, Reyes-Castellanos G, Lac S, Garcia J, Dou S, Shintu L, et al. Targeting mitochondrial Complex I overcomes chemoresistance in high OXPHOS pancreatic cancer. Cell Rep Med 2020; 1: 100143. https://doi.org/10.1016/j.xcrm.2020.100143
- Noble RA, Thomas H, Zhao Y, Herendi L, Howarth R, Dragoni I, et al. Simultaneous targeting of glycolysis and oxidative phosphorylation as a therapeutic strategy to treat diffuse large B-cell lymphoma. Br J Cancer 2022; 127: 937–947. https://doi.org/10.1038/s41416-022-01848-w
- Kumar PR, Moore JA, Bowles KM, Rushworth SA, Moncrieff MD. Mitochondrial oxidative phosphorylation in cutaneous melanoma. Br J Cancer 2021; 124: 115–123. https://doi.org/10.1038/s41416-020-01159-y
- Wang Y, Ou L, Li X, Zheng T, Zhu WP, Li P, et al. The mitochondrial RNA polymerase POLRMT promotes skin squamous cell carcinoma cell growth. Cell Death Discov 2022; 8: 347. https://doi.org/10.1038/s41420-022-01148-5
- Shiratori R, Furuichi K, Yamaguchi M, Miyazaki N, Aoki H, Chibana H, et al. Glycolytic suppression dramatically changes the intracellular metabolic profile of multiple cancer cell lines in a mitochondrial metabolism-dependent manner. Sci Rep 2019; 9: 18699. https://doi.org/10.1038/s41598-019-55296-3
- Birsoy K, Wang T, Chen WW, Freinkman E, Abu-Remaileh M, Sabatini DM. An essential role of the mitochondrial electron transport chain in cell proliferation is to enable aspartate synthesis. Cell 2015; 162: 540–551. https://doi.org/10.1016/j.cell.2015.07.016
- Kuznetsov AV, Javadov S, Margreiter R, Grimm M, Hagenbuchner J, Ausserlechner MJ. Structural and functional remodeling of mitochondria as an adaptive response to energy deprivation. Biochim Biophys Acta Bioenerg 2021; 1862: 148393. https://doi.org/10.1016/j.bbabio.2021.148393
- Kuang Y, Han X, Xu M, Yang Q. Oxaloacetate induces apoptosis in HepG2 cells via inhibition of glycolysis. Cancer Med 2018; 7: 1416–1429. https://doi.org/10.1002/cam4.1410
- Lu CL, Qin L, Liu HC, Candas D, Fan M, Li JJ. Tumor cells switch to mitochondrial oxidative phosphorylation under radiation via mTOR-mediated hexokinase II inhibition: a Warburg-reversing effect. PLoS One 2015; 10: e0121046. https://doi.org/10.1371/journal.pone.0121046
- Cheung EC, Vousden KH. The role of ROS in tumour development and progression. Nat Rev Cancer 2022; 22: 280–297. https://doi.org/10.1038/s41568-021-00435-0
- Toshniwal AG, Gupta S, Mandal L, Mandal S. ROS inhibits cell growth by regulating 4EBP and S6K, independent of TOR, during development. Dev Cell 2019; 49: 473–489 e479. https://doi.org/10.1016/j.devcel.2019.04.008
- Zhao Y, Hu X, Liu Y, Dong S, Wen Z, He W, et al. ROS signaling under metabolic stress: cross-talk between AMPK and AKT pathway. Mol Cancer 2017; 16: 79. https://doi.org/10.1186/s12943-017-0648-1
- Liu Z, Huang M, Hong Y, Wang S, Xu Y, Zhong C, et al. Isovalerylspiramycin I suppresses non-small cell lung carcinoma growth through ROS-mediated inhibition of PI3K/AKT signaling pathway. Int J Biol Sci 2022; 18: 3714–3730. https://doi.org/10.7150/ijbs.69989
- Liang W, He X, Bi J, Hu T, Sun Y. Role of reactive oxygen species in tumors based on the ‘seed and soil’ theory: a complex interaction (Review). Oncol Rep 2021; 46. https://doi.org/10.3892/or.2021.8159
- Hambright HG, Meng P, Kumar AP, Ghosh R. Inhibition of PI3K/AKT/mTOR axis disrupts oxidative stress-mediated survival of melanoma cells. Oncotarget 2015; 6: 7195–7208. https://doi.org/10.18632/oncotarget.3131
- Xu Z, Feng J, Li Y, Guan D, Chen H, Zhai X, et al. The vicious cycle between ferritinophagy and ROS production triggered EMT inhibition of gastric cancer cells was through p53/AKT/mTor path-way. Chem Biol Interact 2020; 328: 109196. https://doi.org/10.1016/j.cbi.2020.109196