SHORT COMMUNICATION
High-frequency Ultrasound Reveals Epidermal-dermal Structural Alterations in an Experimental Model of Epidermolysis Bullosa
Karl WALLBLOM1,2  , Artur SCHMIDTCHEN1,2# and Manoj PUTHIA1#
1Division of Dermatology and Venereology, Department of Clinical Sciences Lund, Lund University, Lund, and 2Department of Dermatology, Skåne University Hospital, Lund, Sweden. E-mail: karl.wallblom@med.lu.se
#Equal contributions
Citation: Acta Derm Venereol 2026; 106: adv44438. DOI: https://doi.org/10.2340/actadv.v106.44438.
Copyright: © 2026 The Author(s). Published by MJS Publishing, on behalf of the Society for Publication of Acta Dermato-Venereologica. This is an Open Access article distributed under the terms of the Creative Commons Attribution 4.0 International License (https://creativecommons.org/licenses/by/4.0/).
Submitted: Aug 12, 2025. Accepted after revision: Jan 19, 2026. Published: Feb 17, 2026.
Competing interests and funding: AS is a founder of in2cure AB, the parent company of Xinnate AB, which provided partial funding for this study. The funders had no role in study design, data collection and analysis, decision to publish, or preparation of the manuscript. The other authors declare no competing interests.
INTRODUCTION
Epidermolysis bullosa (EB) comprises a group of rare genetic disorders characterized by painful blistering triggered by minimal mechanical trauma (1). Current diagnostic methods have limitations; histopathology is invasive and unsuitable for frequent monitoring, whereas clinical assessments may lack objectivity and sensitivity to detect subtle structural changes in the skin.
High-frequency ultrasound (HFUS) uses probes with frequencies above 15 MHz to visualize and quantify skin structures noninvasively. HFUS has demonstrated utility in monitoring various dermatological conditions, including inflammatory disorders, tumours, and scars (2). Notably, HFUS can visualize and quantify the subepidermal low-echogenic band (SLEB), with increased thickness correlating with heightened inflammatory activity in the skin (2–6).
To address the need for objective and noninvasive monitoring tools for EB, this study aimed to establish and validate an HFUS protocol to longitudinally monitor spontaneous, disease-driven EB-related skin changes in a junctional epidermolysis bullosa (JEB) murine model (LAMC2jeb) (7).
MATERIALS, METHODS and RESULTS
Animal experiments were performed in accordance with the Swedish Animal Welfare Act SFS 1988:534 and approved by the Animal Ethics Committee of Malmö/Lund, Sweden. The B6.129X1-LAMC2jeb/DcrJ mouse strain (Stock #025467, Jackson Laboratory), which models non-Herlitz JEB, was used (7). Homozygous mice develop progressive cutaneous fragility with spontaneous blistering and ulceration visible on the tail, ears, and paws from 13–14 weeks of age (7). For HFUS assessment, we focused on the tail, as ears and paws were unsuitable due to their very small and irregular shape, thin skin, and curvature.
A DermaScan HFUS unit (Cortex, Denmark) with a 20 MHz probe was used. A schematic is provided in Fig. 1A. All ultrasound images were acquired using a standardized gain profile (DermaScan preset gain profile 3, gain level 13). HFUS image quantification was performed using DermaScan analysis software (version 1.10.0.4, Cortex, Odense, Denmark). SLEB thickness was measured in A-scan mode by averaging 5 separate vertical measurements (peak-to-peak) from the epidermal entry echo to the first dermal peak (2). Two tail regions were defined: Region 1 at the tail base and Region 2, located approximately 3 cm from the base (Fig. 2A). Fig. 1B provides a schematic of the materials used and practical procedures.
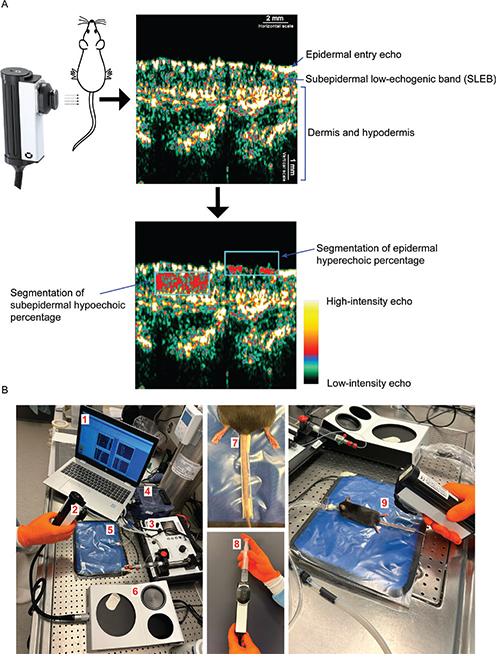
Fig. 1. Schematic of ultrasound analysis and imaging setup. (A) The epidermal entry echo was defined as the first hyperechoic region of the skin. The subepidermal low-echogenic band (SLEB) was defined as the hypoechoic area located beneath the epidermal entry echo, extending down to the more hyperechoic dermis. The schematic illustrates how the rectangular region of interest (ROI) was positioned for the segmentation of subepidermal hypoechoic percentage and epidermal hyperechoic percentage. For segmentation, intensity values of 0–30 were classified as hypoechoic and values of 150–255 as hyperechoic. (B) Setup and procedure for HFUS image acquisition. (1) Computer running the image acquisition and analysis software. (2) A 20 MHz ultrasound probe, enabling B-scans at 60 × 150 μm resolution and 13 mm penetration. (3) Isoflurane anaesthesia system. (4) Chamber for anesthetizing mice. (5) Heating pad to maintain stable body temperature. (6) DermaScan HFUS unit. (7) Disposable fixation rail, devised by cutting a 1 mL pipette tip in half, used to stabilize the mouse tail. (8) Fluid was added to the probe chamber before imaging, followed by the application of ultrasound gel to the probe slit. (9) Final image acquisition with the probe gently placed perpendicular to the dorsal tail surface.
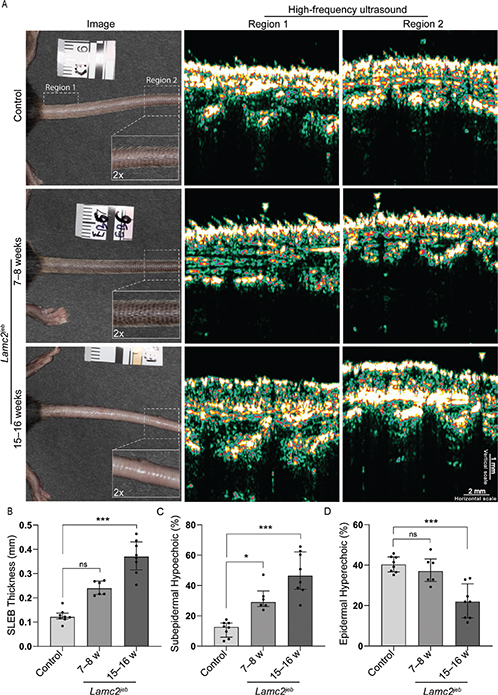
Fig. 2. Quantification of high-frequency ultrasound (HFUS) images. (A) Representative cases from each group, including photographs showing tail morphology and locations of Regions 1 and 2 used for HFUS imaging. HFUS images revealed a more pronounced subepidermal low-echogenic band (SLEB) and a less homogeneous epidermis in the 15–16-week LAMC2jeb group than in the age-matched wild-type controls and the 7–8-week LAMC2jeb group. (B–D) Scatter plots with bars show the median with interquartile range for SLEB thickness, subepidermal hypoechoic percentage, and epidermal hyperechoic percentage. For all analyses, each measured region was considered an independent sample (controls age-matched to the 15–16-week group, n = 8; 7–8-week LAMC2jeb group, n = 6; and 15–16-week LAMC2jeb group, n = 8). Statistical testing was performed using the Kruskal–Wallis test, with multiple comparisons between the controls and LAMC2jeb groups. Dunn’s test was used to correct for multiple comparisons. Significance levels: ns > 0.05, *p ≤ 0.05, **p ≤ 0.01, ***p ≤ 0.001. Statistical analyses were performed using GraphPad Prism version 10.4.1 (https://www.graphpad.com/).
B-scan mode using a rectangular region of interest (ROI; Preset shape 4 = area 1.51 mm²) was used for segmentation. Segmentation was repeated twice at different locations in the same image, with mean percentage reported. For subepidermal hypoechoic percentage, the ROI’s upper boundary was aligned with the epidermis, using threshold values of 0 and 30 (8). For epidermal hyperechoic percentage, the ROI was aligned with the lower boundary of the epidermal entry echo with threshold values of 150 and 255 (see Fig. 1A).
For animals imaged using HFUS, the proximal and distal tail regions corresponding to HFUS Regions 1 and 2 were excised and fixed in neutral-buffered formalin. H&E-stained slides were imaged using an AxioScope A.1 microscope (Zeiss, Oberkochen, Germany). Five non-overlapping representative areas were selected from each sample region at 50× magnification. Two independent assessors, blinded to image identity, scored epidermal detachment, immune cell infiltration, and epidermal architecture using a 0–3 scale: grade 0, no changes; grade 1, mild; grade 2, moderate; and grade 3, extensive (adapted from Wang et al. [9]). Scores were averaged per assessor and region.
Fig. 1 illustrates the ultrasound imaging and analysis setup. Two loops of 100 images were recorded per mouse in Regions 1 and 2 (Fig. 2A). The highest-quality frame from each loop, ensuring the epidermal entry echo remained as horizontal as possible, was selected for subsequent analysis.
Three LAMC2jeb mice aged 7–8 weeks with subtle JEB-related features (primarily on ears and not tail), 4 LAMC2jeb mice aged 15–16 weeks with a distinctive JEB phenotype (e.g., hair loss, mild ulceration, and blistering on the tail), and 4 wild-type C57BL/6 mice (15–16 weeks old, age-matched to the second JEB group) were imaged. Visual inspection of HFUS images (Fig. 2A) showed that wild-type mice typically exhibited a homogeneous epidermal entry echo and negligible SLEB, suggesting tight dermal-epidermal attachment. In contrast, 7–8-week LAMC2jeb mice displayed a similarly homogeneous epidermal entry echo but also consistently showed a discernible SLEB. These differences were more pronounced in the 15–16-week LAMC2jeb group, which generally exhibited a more irregular epidermal entry echo and a better defined and thicker SLEB with hypoechoic areas completely separating the dermis and epidermis.
Quantification of SLEB thickness (Fig. 2B) revealed a general increase in LAMC2jeb mice compared with wild-type controls, with the 15–16-week group exhibiting the highest values. The 7–8-week group had a non-significant increase in median SLEB thickness compared with the controls (0.239 vs 0.121 mm, p = 0.06), whereas the 15–16-week group exhibited a highly significant difference (0.370 vs 0.121 mm, p < 0.001). Quantification of the subepidermal hypoechoic percentage (Fig. 2C) yielded similar results: compared with controls, the 7–8-week group displayed a significant increase in median percentage (29.0 vs 16.6%, p = 0.04), and the 15–16-week group showed a highly significant increase (46.5 vs 16.6%, p < 0.001). Quantification of the epidermal hyperechoic percentage (Fig. 2D) showed no statistically significant difference between the controls and 7–8-week LAMC2jeb group (37.0 vs 40.3%, p = 0.78). However, the 15–16-week LAMC2jeb mice exhibited a highly significant reduction (30.8 vs 40.3%, p < 0.001) compared with the controls.
Two control mice and 2 LAMC2jeb mice (1 mouse with extensive hair loss and tail ulcerations and 1 mouse with no tail ulceration and less hair loss) (Fig. S1), all age-matched and 15–16 weeks old, were used for H&E histological assessment. HFUS and H&E images from matched regions exhibited visual structural correlations (Fig. S2). The average histology scores from each assessor, along with corresponding HFUS quantification, are presented in Table I. Higher epidermal detachment and immune cell infiltration generally coincided with increased SLEB thickness and hypoechoic areas, whereas greater epidermal architecture scores coincided with reduced hyperechoic percentages. Regional disparities were observed in the less severe LAMC2jeb specimens. Histopathology showed elevated epidermal detachment and immune infiltration in Region 2, whereas HFUS detected higher SLEB thickness and subepidermal fluid in Region 1.
DISCUSSION
The findings presented here indicate that HFUS assessment, including measurement of SLEB thickness, subepidermal hypoechoic percentage, and epidermal hyperechoic percentage, can monitor disease progression from early subclinical changes to significant structural disruptions in a murine model of JEB.
The corresponding pathological changes underlying the observed alterations in HFUS metrics are not fully understood but may be related to inflammation, a well-described feature of EB wounds and the surrounding skin (1, 10). Inflammation often results in tissue oedema, which may correspond to the increase in hypoechoic signals detected by HFUS, supported by previous reports showing a correlation between SLEB thickness and inflammatory activity in skin diseases (3–6). The basis for the more irregular epidermal entry echo and decreased epidermal echogenicity is unclear. Potential explanations include that an altered epidermal architecture due to hyperproliferation causes less echogenicity or that the differences observed are related to the hair loss observed in severe cases, as differentiation between the epidermis and such thin hair strands is challenging using 20 MHz resolution (11). Given these limitations, including the inability of histopathology to measure fluid content, targeted studies are needed to define the structural basis of HFUS alterations in EB. Future experimental studies in the LAMC2jeb model should also examine anatomical site-specific differences, for example by inducing controlled test lesions in shaved back skin and comparing their HFUS profiles with those of naturally blistering tail skin.
HFUS protocols could enable longitudinal monitoring of EB in preclinical and clinical settings, allowing simultaneous real-time assessment of multiple areas to evaluate disease severity and treatment results. Future research should focus on studying HFUS metrics and their correlation to clinical outcomes in diverse populations of EB patients.
ACKNOWLEDGEMENTS
The authors would like to acknowledge Elzbieta Eriksson for help with animal husbandry and Susanne Strömblad for histological preparations. This work was supported by grants from the Swedish Research Council (project 2020-02016, 2021-06388, and 2025-02401), Edvard Welanders Stiftelse and Finsenstiftelsen (Hudfonden), the Royal Physiographic Society, Österlund Foundation, Xinnate AB, and the Swedish Government Funds for Clinical Research (ALF).
Data availability statement: The raw data supporting the conclusions of this article will be made available by the authors without undue reservation.
REFERENCES
- Bardhan A, Bruckner-Tuderman L, Chapple ILC, Fine JD, Harper N, Has C, et al. Epidermolysis bullosa. Nat Rev Dis Primers 2020; 6: 78. https://doi.org/10.1038/s41572-020-0210-0
- Vergilio MM, Monteiro ESSA, Jales RM, Leonardi GR. High-frequency ultrasound as a scientific tool for skin imaging analysis. Exp Dermatol 2021; 30: 897–910. https://doi.org/10.1111/exd.14363
- Polanska A, Danczak-Pazdrowska A, Silny W, Wozniak A, Maksin K, Jenerowicz D, et al. Comparison between high-frequency ultrasonography (Dermascan C, version 3) and histopathology in atopic dermatitis. Skin Res Technol 2013; 19: 432–437. https://doi.org/10.1111/srt.12064
- Odrzywołek W, Deda A, Zdrada J, Wcisło-Dziadecka D, Lipka-Trawińska A, Błońska-Fajfrowska B, et al. Assessment of psoriatic skin features using non-invasive imaging technique. Processes 2022; 10: 985. https://doi.org/10.3390/pr10050985
- Polańska A, Silny W, Jenerowicz D, Knioła K, Molińska-Glura M, Dańczak-Pazdrowska A. Monitoring of therapy in atopic dermatitis: observations with the use of high-frequency ultrasonography. Skin Res Technol 2015; 21: 35–40. https://doi.org/10.1111/srt.12153
- Pazdrowski J, Danczak-Pazdrowska A, Polanska A, Kazmierska J, Barczak W, Szewczyk M, et al. An ultrasonographic monitoring of skin condition in patients receiving radiotherapy for head and neck cancers. Skin Res Technol 2019; 25: 857–861. https://doi.org/10.1111/srt.12745
- Bubier JA, Sproule TJ, Alley LM, Webb CM, Fine JD, Roopenian DC, et al. A mouse model of generalized non-Herlitz junctional epidermolysis bullosa. J Invest Dermatol 2010; 130: 1819–1828. https://doi.org/10.1038/jid.2010.46
- Phillips J, Reynolds KJ, Gordon SJ. Dermal thickness and echogenicity using DermaScan C high frequency ultrasound: methodology and reliability testing in people with and without primary lymphoedema. Skin Res Technol 2020; 26: 813–823. https://doi.org/10.1111/srt.12880
- Wang C, Yuan J, Wu HX, Chang Y, Wang QT, Wu YJ, et al. Total glucosides of paeony inhibit the inflammatory responses of mice with allergic contact dermatitis by restoring the balanced secretion of pro-/anti-inflammatory cytokines. Int Immunopharmacol 2015; 24: 325–334. https://doi.org/10.1016/j.intimp.2014.12.026
- Nystrom A, Bruckner-Tuderman L, Kiritsi D. Dystrophic epidermolysis bullosa: secondary disease mechanisms and disease modifiers. Front Genet 2021; 12: 737272. https://doi.org/10.3389/fgene.2021.737272
- Almuhanna N, Wortsman X, Wohlmuth-Wieser I, Kinoshita-Ise M, Alhusayen R. Overview of ultrasound imaging applications in dermatology. J Cutan Med Surg 2021; 25: 521–529. https://doi.org/10.1177/1203475421999326