ORIGINAL REPORT
Real-world Evidence of Self-reported Treatments, Signs, and Symptom Burden in Chronic Hand Eczema: Findings from the Multinational CHECK Study
Sonja MOLIN1,2  , Maria Concetta FARGNOLI3 , Marie Noelle CREPY4,5 , Ana Maria GIMÉNEZ-ARNAU6 , Lysel BRIGNOLI7 , Perrine LE CALVÉ7 , Michal KRUPKA8 , Jenny M. NORLIN8 , Christian APFELBACHER9 and Anthony BEWLEY10
1Department of Dermatology, Venerology and Allergy, Charité-Universitätsmedizin Berlin, Berlin, Germany, 2Division of Dermatology, Queen’s University, Kingston, Canada, 3San Gallicano Dermatological Institute, IRCCS, Rome, Italy, 4Department of Occupational and Environmental Diseases, University Hospital of Centre of Paris, Hotel-Dieu Hospital, Paris, France, 5Department of Dermatology, University Hospital of Centre of Paris, Cochin Hospital, AP-HP, Paris, France, 6Department of Dermatology, Hospital de Mar Research Institute, Universitat Pompeu Fabra, Barcelona, Spain, 7Oracle Life Sciences, Paris, France, 8LEO Pharma A/S, Ballerup, Denmark, 9Institute of Social Medicine and Health Systems Research, Otto-von-Guericke University Magdeburg, Magdeburg, Germany, and 10Barts Health NHS Trust & QMUL, London, UK
Chronic hand eczema is a multifactorial disease that can impact quality of life considerably. This observational questionnaire study aimed to investigate real-world treatments and patients’ experiences of disease burden across the broad severity spectrum represented by the general chronic hand eczema population. The study included 1,948 individuals from 6 countries (mean age 43.2 years; 64.5% females) with self-reported physician-diagnosed chronic hand eczema. Ongoing treatment was reported in 68.6%, which included systemics or phototherapy (with or without topicals; 10.7%), topical corticosteroids (with or without additional topicals; 36.0%) and other topical treatments (no topical corticosteroids; 21.8%). At survey time, 43.0% were in flare state. About half, 51.1%, reported moderate to severe disease signs (past week). Treatment with topical corticosteroids was suboptimal in 9.7% of those with moderate to severe disease. Experience of symptoms was common, particularly itch. Symptom burden differed significantly between groups with different treatments and severity levels; it was highest among those reporting systemics/ phototherapy and those for whom topical corticosteroids were suboptimal. The results indicate that, despite a high treatment rate, chronic hand eczema is associated with a considerable disease burden that varies significantly across the severity spectrum. A particularly high burden in treatment stages beyond topical corticosteroids indicates a need for more effective management of symptoms.
SIGNIFICANCE
This observational study aimed to better understand real-world treatment patterns and disease burden in the general chronic hand eczema population across 6 countries. Despite nearly 70% of participants being under treatment, over half reported moderate to severe disease and more than 40% were experiencing flares. Symptom burden varied significantly by disease severity and treatment type, being highest in patients receiving systemic treatments or phototherapy, and among those for whom topical corticosteroids were suboptimal. These findings highlight the need for more effective symptom management in treatment stages beyond topical corticosteroids.
Key words: hand dermatoses; eczema; observational study; signs and symptoms
Citation: Acta Derm Venereol 2026; 106: adv44493. DOI: https://doi.org/10.2340/actadv.v106.44493.
Copyright: © 2026 The Author(s). Published by MJS Publishing, on behalf of the Society for Publication of Acta Dermato-Venereologica. This is an Open Access article distributed under the terms of the Creative Commons Attribution-NonCommercial 4.0 International License (https://creativecommons.org/licenses/by-nc/4.0/).
Submitted: Aug 1, 2025. Accepted after revision: Nov 25, 2025. Published: Jan 15, 2026.
Corr: Sonja Molin, Department of Dermatology, Venerology and Allergy, Charité - Universitätsmedizin Berlin, Charitéplatz 1, DE-10117 Berlin, Germany. E-mail: sonja-christine.molin@charite.de
INTRODUCTION
Chronic hand eczema (CHE) is a common, inflammatory skin disease with an annual prevalence of around 5% (1). CHE is multifactorial (2, 3) and irritant exposure is a risk factor, both occupational and domestic (3–5). CHE can cause a range of visual signs and subjective symptoms. The clinical manifestations are dominated by erythema, scaling, fissures, vesicles, or hyperkeratosis; these often occur in flares and can vary considerably in severity (2). Moderate to severe CHE can cause distressing symptoms, including pruritus and pain, with negative impact on patients’ quality of life (6–10) and work productivity (6).
Treatment approaches in CHE vary depending on disease severity. Mild CHE can be managed with emollients and low-potency topical corticosteroids (TCS). Medium- to high-potency TCS are first-line treatment in moderate to severe CHE (4). These can reduce clinical manifestations effectively in the short term; however, long-term intensive use is commonly associated with adverse events, including skin atrophy or contact allergy (11–14).
For patients not benefiting from TCS, treatment alternatives are limited and may include phototherapy, the retinoid alitretinoin (approved for severe CHE), other conventional systemics (e.g., methotrexate, cyclosporine), or, for the atopic dermatitis subtype, biologic treatments or oral JAK inhibitors.
The patient perspective in CHE is not well investigated with regard to real-world routine care and how symptoms and signs are experienced across the broader severity spectrum. Understanding the disease burden of the general CHE population is important to enable informed clinical decision-making that can improve healthcare for individuals living with CHE. Previous studies assessing disease severity in the general CHE population have mainly assessed visual signs (15). It is also not clear which subgroups suffer a particularly severe disease burden. An interesting subgroup in this respect are those with moderate to severe CHE who may lack adequate treatment options due to suboptimal treatment response from TCS. Previous studies of these individuals are limited to patients in dermatology centres (16–18).
The study objective was to investigate self-reported treatments, disease signs, and symptoms of CHE in a large multinational sample representing the general CHE population and, through subgroup analyses, to understand how symptoms are experienced across different levels of disease severity and treatment stages. The study had a particular focus on first-line use of TCS for moderate to severe CHE, including to evaluate disease burden among those for whom TCS treatment was suboptimal.
MATERIALS & METHODS
Study design and subjects
CHECK (Chronic Hand Eczema epidemiology, Care, and Knowledge of real-life burden) is a multinational population-based survey study. The study recruited adults from the general population in Canada, France, Germany, Italy, Spain, and the UK via online panels during July–October 2023 (19) (see Supplementary data). Cases were identified in an initial screening questionnaire, according to the European Society of Contact Dermatitis’ definition (4), as has previously been reported in Apfelbacher et al. (1).
Details on data collection, data quotas, weighting, and quality enhancements have previously been reported (1). Identified cases, except those who reported “participated in clinical trials or been treated with investigational products during the last 12 months from survey initiation”, were invited to a longer questionnaire survey. In these analyses, additional exclusion criteria were employed:
- Did not complete the full questionnaire.
- Did not self-report a physician diagnosis.
Outcomes and variables
Sample characteristics. The following information was collected: country of residence, sex and current age, age at first signs, symptoms, and first diagnosis of CHE. Disease duration was calculated by subtracting age at diagnosis from current age.
Flare experience. A “flare” in the questionnaire was defined as times when the condition suddenly became worse, such as symptoms/signs worsened (itch, pain, redness, etc.), more of the hands or wrists were affected, need to step up or change treatment, or need to seek healthcare.
Flare frequency was reported as number of flares in the past 6 months; those with more than 1 flare also reported duration (days) of the most recent flare, localisation of flares (in the past 7 days and 6 months) and experience of flare-related signs/symptoms during the past 6 months including increased itch, pain, or redness, appearance of new lesions, and spreading of lesions.
To estimate the proportion of the year in flare state, we assumed that the duration of the last flare was representative of the average flare, and that the frequency of flares in the past 6 months was representative of 12 months. Time in flare per year was estimated as: number of flares times duration of flare times 2.
Severity of symptoms. Symptom severity of itch, pain, and sleep disturbance during the past 24 h was evaluated using a Visual Analogue Scale (VAS). The scale rates the severity from 0 (no itch/pain/impact on sleep) to 10 (worst imaginable impact on itch/pain/sleep).
TCS experience. Participants were asked if they had ever been treated with TCS for their CHE, when they last used TCS, reasons for stopping TCS, their experiences with TCS, or reasons for never using TCS.
Subgroup analyses
Treatment groups. Participants were asked if they were currently using any other medications to treat their CHE: “Yes, an injectable medication”, “Yes, phototherapy”, “Yes, an oral treatment (tablets, pills, capsules, etc)”, ”Yes, other medical creams, lotions, gels, mousses, or ointments (excluding topical corticosteroids)”, “ No, I am not using other medications”, or “ I do not know”. Multiple answers were possible; therefore, data were analysed by subgroups representing different stages of the CHE treatment ladder in general in line with treatment guidelines (4) based on a hierarchical approach. Injectables, oral systemics, and phototherapy (hereafter “systemics/phototherapy”) were pooled into 1 subgroup due to small sample sizes. The highest rank was assigned to this group, followed by TCS (excluding those with concomitant systemics or phototherapy) and other topicals (excluding those with concomitant TCS, systemics, or phototherapy). TCS used within the past month was considered current TCS treatment. TCS potency level was not reported.
“No current treatment” and “never treated” were also included as treatment groups. Participants who reported that they had never been treated for CHE or that they did not know if they had ever been treated were included in the group “never treated”.
Severity of disease signs. Severity of visual signs of CHE over the past week was self-assessed using a well-established photographic guide for hand eczema by Coenraads et al. (20) including 5 severity grades (clear, almost clear, moderate, severe, and very severe). In the analyses, these were grouped into 2 severity grades: “mild” (clear and almost clear) and “moderate to severe” (moderate, severe, and very severe).
TCS treatment suboptimal. A subgroup of responders for whom TCS was considered suboptimal (hereafter “TCS suboptimal”) was identified, which included participants reporting moderate to severe signs who meet at least 1 of the following criteria (illustrated in Fig. S1):
- Currently treated with TCS but reporting that their eczema did not get better or got worse.
- Discontinued treatment with TCS due to a physician’s decision or side effects and reporting that their eczema did not get better or got worse.
- Contraindicated to use TCS: “My doctor told me I could not use it for medical reasons”.
Statistical analysis
Continuous variables were summarised using descriptive statistics (n, mean, standard deviation [SD], median, interquartile range [IQR], minimum, and maximum). Categorical variables were summarized as frequencies and percentages (n, %). Statistical tests were applied on weighted data to evaluate difference between groups. A χ2 test with Rao and Scott’s second order-correction (adaptation of χ2 test for weighted data), was applied on categorical variables. For numerical variables, a Wilcoxon (for comparison between 2 groups) or a Kruskal–Wallis (for comparison between more than 2 groups) rank-sum test for complex survey samples was applied. For multiple group comparisons, the comparison was first conducted on all the groups together. For those cases showing a significant p-value (i.e., p < 0.05) in the overall test, two-by-two comparisons between the TCS treatment group and the other treatment groups were performed.
The analyses were conducted using the standard statistical analysis software product: Rstudio Version 2023.06.0+421 (R Foundation for Statistical Computing, Vienna, Austria).
RESULTS
Sample characteristics
In total, 3,484 participants self-reported CHE. After exclusion criteria, 2,046 participants with a complete questionnaire remained, resulting in 1,948 participants in the weighted sample (Fig. S2).
Just over half reported moderate to severe disease signs in the past week (Table I). Most participants, 68.6%, reported 1 or several current treatments including injectables (1.8%), orals (8.1%), phototherapy (1.7%), TCS (42.6%), or topicals excluding TCS (48.7%). In addition, 21.7% reported no current treatment, and 9.4% that they had never been treated for CHE. Six participants could not recall their treatment. Of those reporting moderate to severe CHE, TCS was considered suboptimal for 9.7% (n = 96).
| Item | Total | Milda | Moderate to severeb, e | TCS suboptimalc, f | Remaining moderate to severed |
| N, (%) | 1,948 (100%) | 953 (48.9%) | 994 (51.1%) | 96 (9.7%g) | 898 (90.3%g) |
| Female, n (%) | 1,256 (64.5%) | 639 (67.0%) | 617 (62.0%)* | 64 (66.3%) | 553 (61.5%) |
| Current age (years) | |||||
| Mean (SD) | 43.2 (12.6) | 43.2 (13.0) | 43.3 (12.2) | 43.8 (12.4) | 43.2 (12.2) |
| Median (IQR) | 43.0 (33.0, 53.0) | 43.0 (33.0, 54.0) | 43.0 (34.0, 53.0) | 44.0 (33.0, 54.0) | 43.0 (34.0, 53.0) |
| Age at first signs or symptoms of CHE (years) | |||||
| Mean (SD) | 23.7 (14.9) | 23.3 (14.8) | 24.1 (15.0) | 21.6 (14.4) | 24.4 (15.0) |
| Median (IQR) | 21.0 (12.0, 34.0) | 20.0 (12.0, 32.8) | 22.0 (13.0, 35.0) | 21.0 (10.0, 30.0) | 22.0 (13.0, 35.0) |
| Age at first diagnosis of CHEh (years) | |||||
| Mean (SD) | 26.2 (15.3) | 26.3 (15.1) | 26.1 (15.4) | 23.7 (15.1) | 26.4 (15.5) |
| Median (IQR) | 25.0 (15.0, 36.0) | 25.0 (16.0, 36.0) | 25.0 (15.0, 36.0) | 24.0 (10.0, 31.8) | 25.0 (15.0, 36.0) |
| Time between first signs/symptoms and diagnosish (years) | |||||
| Mean (SD) | 2.0 (5.7) | 2.3 (6.0) | 1.8 (5.4)* | 1.8 (6.1) | 1.8 (5.3) |
| Median (IQR) | 0.0 (0.0, 2.0) | 0.0 (0.0, 2.0) | 0.0 (0.0, 1.0) | 0.0 (0.0, 1.0) | 0.0 (0.0, 1.0) |
| Disease duration (years), h | |||||
| Mean (SD) | 17.0 (14.5) | 16.8 (14.6) | 17.2 (14.4) | 20.2 (16.3) | 16.9 (14.2) |
| Median (IQR) | 14.0 (4.0, 26.0) | 13.0 (4.0, 26.0) | 14.0 (5.0, 26.0) | 17.9 (5.0, 34.0) | 14.0 (4.0, 26.0) |
| Employed, n (%) | 1,486 (76.3%) | 692 (72.6%) | 793 (79.8%)*** | 82 (84.9%) | 711 (79.2%) |
| aMild represents the grades “clear” and “almost clear” according to the photographic guide in the past week. bModerate to severe represents the grades “moderate”, “severe”, and “very severe” according to the photographic guide in the past week. cRefers to participants in the subgroup “moderate to severe” for whom TCS treatment was suboptimal. The definition of this subgroup is illustrated in Fig. S1. dRefers to participants in the subgroup “moderate to severe” who remained after removing the subgroup “TCS suboptimal”. e, fStars indicate statistical significance where * = p < 0.05, ** = p < 0.01 and *** = p < 0.001. eThe subgroup “moderate to severe” was compared with the subgroup “mild”. fThe subgroup “TCS suboptimal” was compared with remaining participants in the subgroup “moderate to severe”. gPercentage of participants with moderate to severe disease signs (n = 994). hIncludes only 1,726 participants who could recall the age at first diagnosis. CHE: chronic hand eczema; IQR: interquartile range; SD: standard deviation; TCS: topical corticosteroids. |
|||||
Overall, mean age was 43.2 years, and the majority were female (Table I). Mean age at first signs or symptoms of CHE was 23.7 years and mean disease duration was 17.0 years. More than half, 56.5%, of had received a diagnosis less than 1 year after first signs/symptoms. The most common location of lesions (past 7 days) was finger(s)/between finger(s) (63.4%), followed by back of hand (32.1%), palm(s) (30.6%), wrist(s) (29.9%), knuckle(s) (28.8%), and fingertip(s) (14.4%) (data not shown). Characteristics by country are presented in Table SI.
Significant differences between subgroups included that those with moderate to severe signs showed a smaller proportion of females, shorter mean time between first signs/symptoms and diagnosis, and a larger proportion of employed participants compared with those with mild signs (see Table I).
Compared with the TCS group, lower mean age was reported by the subgroup “never treated” and shorter mean disease duration by both “never treated” and “systemics/phototherapy” groups. Also, moderate to severe signs were less common in the groups “never treated”, “no current treatment” and “topicals” compared with the TCS group (Table II).
| Item | Totalb | Current treatmenta | No current treatment | Never treated | ||
| Systemics/phototherapy | TCSc | Topicals (TCS excluded) | ||||
| N, (%) | 1,948 (100%) | 209 (10.7%) | 702 (36.0%) | 424 (21.8%) | 423 (21.7%) | 183 (9.4%) |
| Female, n (%) | 1,256 (64.5%) | 118 (56.2%) | 448 (63.9%) | 272 (64.1%) | 295 (69.8%)* | 119 (65.2%) |
| Current age (years) | ||||||
| Mean (SD) | 43.2 (12.6) | 42.8 (11.0) | 44.2 (12.9) | 42.7 (13.0) | 43.9 (12.0) | 40.1 (12.9)*** |
| Median (IQR) | 43.0 (33.0, 53.0) | 42.0 (35.0, 51.0) | 44.0 (34.0, 55.0) | 43.0 (31.0, 53.0) | 43.0 (34.0, 54.0) | 38.0 (30.0, 51.0) |
| Age at first signs or symptoms of CHE (years) | ||||||
| Mean (SD) | 23.7 (14.9) | 25.4 (14.0) | 23.9 (15.9) | 22.5 (14.5) | 23.4 (14.3) | 24.7 (14.1) |
| Median (IQR) | 21.0 (12.0, 34.0) | 25.0 (15.0, 34.3) | 21.0 (12.0, 35.0) | 20.0 (12.0, 30.0) | 20.0 (12.0, 35.0) | 21.2 (15.0, 33.9) |
| Age at first diagnosis of CHEd (years) | ||||||
| Mean (SD) | 26.2 (15.3) | 27.6 (14.6) | 26.7 (16.3) | 24.7 (15.1) | 25.9 (14.3) | 26.7 (14.3) |
| Median (IQR) | 25.0 (15.0, 36.0) | 28.0 (16.5, 36.0) | 25.0 (15.0, 39.0) | 22.2 (14.0, 35.0) | 25.0 (15.0, 36.0) | 25.0 (18.0, 35.0) |
| Time between first signs/symptoms and diagnosisd (years) | ||||||
| Mean (SD) | 2.0 (5.7) | 2.2 (6.5) | 2.2 (6.4) | 1.9 (5.2) | 1.8 (4.1) | 2.1 (6.0) |
| Median (IQR) | 0.0 (0.0, 2.0) | 0.0 (0.0, 1.0) | 0.0 (0.0, 1.0) | 0.0 (0.0, 2.0) | 0.0 (0.0, 2.0) | 0.0 (0.0, 2.0) |
| Disease durationd (years) | ||||||
| Mean (SD) | 17.0 (14.5) | 15.2 (13.8)* | 17.8 (15.0) | 17.8 (14.2) | 17.7 (14.7) | 12.8 (12.8)*** |
| Median (IQR) | 0.0 (0.0, 2.0) | 10.0 (4.0, 24.0) | 15.0 (5.0, 27.0) | 15.0 (6.0, 26.0) | 14.0 (5.0, 28.8) | 10.0 (2.6, 18.0) |
| Severity of disease signs based on photographic guide | ||||||
| Milde, n (%) | 953 (48.9%) | 75 (35.7%) | 279 (39.7%) | 214 (50.5%) | 272 (64.3%) | 110 (60.1%) |
| Moderate to severef, n (%) | 994 (51.1%) | 135 (64.3%) | 423 (60.3%) | 210 (49.5%)*** | 151 (35.7%)*** | 73 (39.9%)*** |
| Employed, n (%) | 1486 (76.3%) | 176 (84.2%)* | 545 (77.7%) | 325 (76.6%) | 304 (71.9%)* | 130 (70.8%) |
| aBecause 1 paticipant could have more than 1 treatment, treatment group was assigned based on the highest ranked treatment stage as described in Methods. bIncludes 6 participants who did not know their current treatment. cInclude participants reporting use of TCS within the last month. dIncludes only 1,726 participants who could recall their age at first diagnosis. eMild represents the grades “clear” and “almost clear” according to the photographic guide in the past week. fModerate to severe represents the grades “moderate”, “severe”, and “very severe” according to the photographic guide in the past week. *Asterisks indicate statistical significance compared with the TCS treatment group where *p < 0.05, **p < 0.01, and ***p < 0.001. CHE: chronic hand eczema; IQR: interquartile range; SD: standard deviation; TCS: topical corticosteroids. |
||||||
TCS use and experiences
No treatment for CHE ever was reported by 9.4% and no TCS ever by 9.0% (Fig. 1). The main reason for never using TCS was that doctors had never mentioned it followed by patients’ fear of the impact TCS may have on their skin. A relatively large proportion, 20.6%, did not know the reason. Most participants, 76.7%, had been treated with TCS at some point. The main reasons for discontinuing TCS treatment were: “own decision (not needed anymore)”, “doctor’s decision”, and “fear of using TCS”. Most participants who had used TCS reported that their CHE was gone or improved with the treatment, whereas 13.6% reported that it did not improve or got worse.
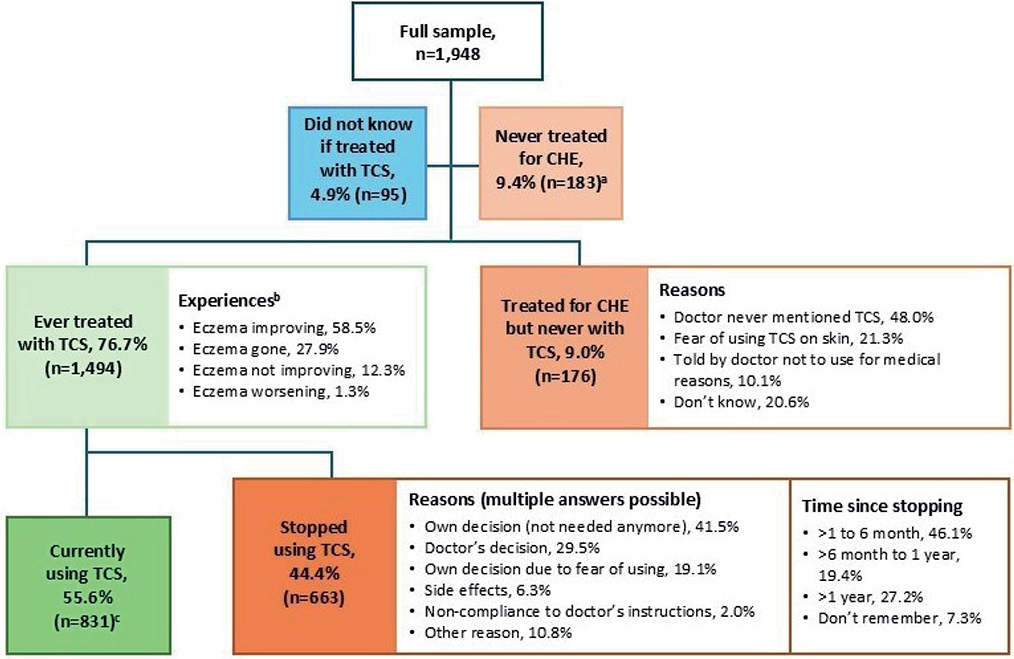
Fig. 1. Overview of topical corticosteroids (TCS) treatment experience among participants ever treated for TCS. aIncludes 25 participants who did not know if they had ever been treated for chronic hand eczema (CHE). bRefers to participants’ overall experience with TCS, which does not necessarily relate to their current experience. cIncludes those treated with TCS in combination with other treatments including systemics and phototherapy.
Flare experience
Overall, 43.0%, reported being in flare state at the time of the survey. Mean (SD) was 6.0 (9.4) for number of flares (past 6 months) and 7.4 (13.8) for duration of last flare in days. The mean (SD) time of the year in flare state was 61.9 (87.2) days. Symptoms worsening in certain seasons was reported by 78.6%. Winter and summer were the most common seasons for worsening as reported by 41.4% and 33.7%, respectively; spring and autumn were less common (19.1% and 16.4%, respectively).
The most common flare-related sign/symptom was increased itching (Fig. 2). All flare-related signs/symptoms were significantly more common in the group reporting moderate to severe signs compared with those with mild signs: increased pain was almost twice as common in the group with moderate to severe signs (22.1% vs 11.7%, p-value < 0.001) (Fig. 2A). In the TCS suboptimal subgroup, appearance of new lesions was more common compared with others with moderate to severe signs (51.6% vs 38.9%, p-value = 0.018) (Fig. 2B).
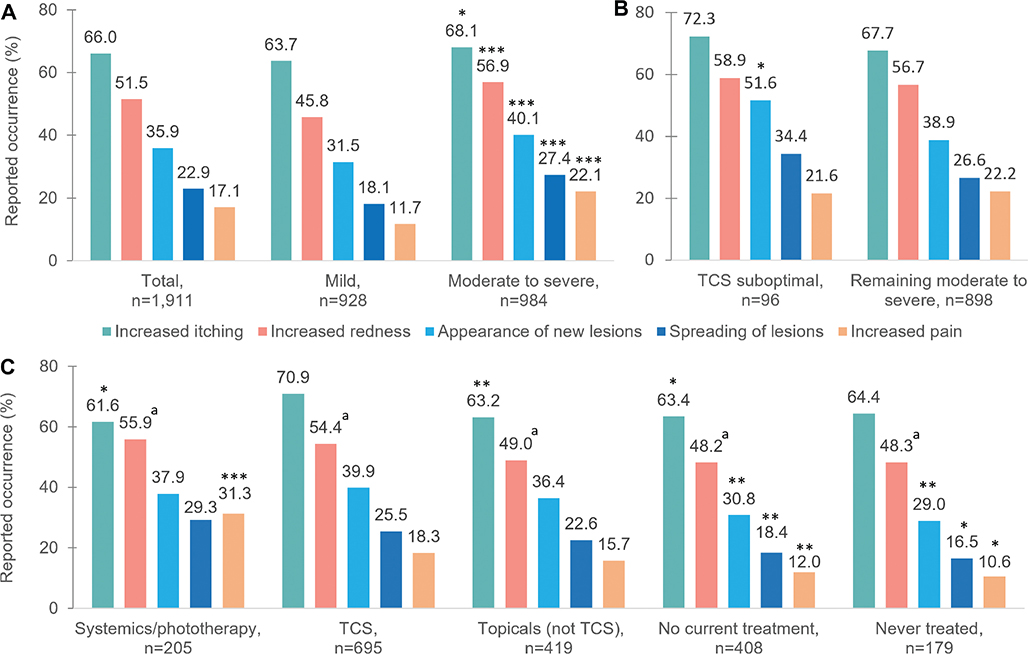
Fig. 2. Self-reported occurrence of flare-related signs/symptoms over the last 6 months, overall, and in subgroups. Flare experience is presented as the proportion of participants reporting a certain flare experience over the last 6 months for the following groups: (A) total sample and subgroups reporting mild and moderate to severe signs of disease severity in the past week, (B) participants with moderate to severe signs for whom topical corticosteroids (TCS) treatment was suboptimal (i.e., TCS suboptimal subgroup) as illustrated in Fig. S1, and remaining participants with moderate to severe signs, and (C) different treatment groups based on the highest ranked treatment stage as explained in Methods. Asterisks indicate statistical significance (*p < 0.05, **p < 0.01, and ***p < 0.001) for comparison of (A) groups with moderate to severe vs mild disease signs, (B) participants in the TCS suboptimal group vs the remaining participants with moderate to severe signs, and (C) individual treatment groups vs the TCS treatment group. aIncreased redness was not tested between TCS and other treatment groups on a two-by-two basis due to a lack of significance in the overall test of significance between groups. SD: standard deviation.
Across treatment stages, increased itching was most common in the TCS group. Moreover, appearance of new lesions, spreading of lesions, and increased pain were more common in the TCS group compared with the groups “no current treatment” and “never treated”. However, increased pain was less common in the TCS group compared with the systemics /phototherapy group (Fig. 2C).
Symptoms
Itch had the highest self-reported mean VAS score overall (Fig. 3). Mean VAS scores for all symptom categories were significantly higher among participants reporting moderate to severe signs compared with those with mild signs (Fig. 3A), and in the TCS suboptimal subgroup compared with others with moderate to severe signs (Fig. 3B).
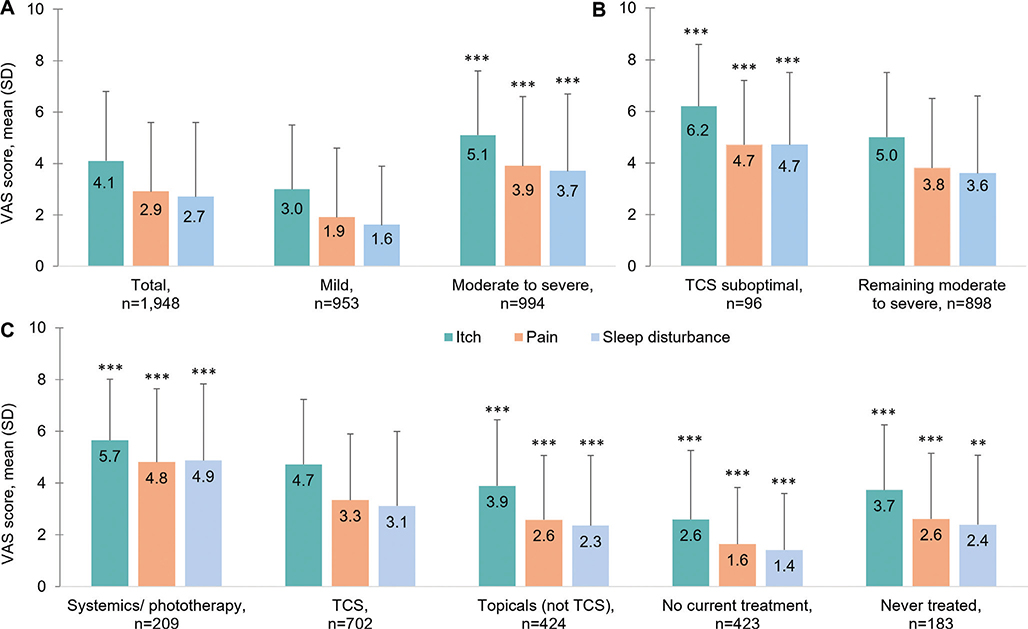
Fig. 3. Severity of symptoms over last 24, overall and in subgroups. Severity in last 24 h is presented as mean (standard deviation) visual analogue scale (VAS) scores for itch, pain, and sleep disturbance for the following groups: (A) total sample and subgroups reporting mild and moderate to severe signs of disease severity in the past week, (B) participants with moderate to severe signs for whom topical corticosteroids (TCS) treatment was suboptimal (i.e., TCS suboptimal subgroup) as illustrated in Fig. S1, and remaining participants with moderate to severe signs, and (C) different treatment groups based on the highest ranked treatment stage as explained in Methods. Asterisks indicate statistical significance (* = p < 0.05, ** = p < 0.01, and *** = p < 0.001) for comparison of (A) groups with moderate to severe vs mild disease signs, (B) participants in the TCS suboptimal group vs the remaining participants with moderate to severe signs, and (C) individual treatment groups vs the TCS treatment group.
Mean VAS scores increased with higher stages of the treatment ladder (Fig. 3C); the systemics/phototherapy group showed the highest severity. The TCS group had significantly higher mean scores for all symptom categories compared with the groups “topicals”, “no current treatment”, and “never treated”, but lower compared with “systemics/phototherapy”.
Compared with participants reporting mild disease signs, those with moderate to severe signs had larger proportions reporting any level (i.e., ≥ 1 point on VAS scale) of itch (92.4 % vs 78.5%, p-value < 0.001) and pain (85.2% vs 60.1%, p-value < 0.001). In the TCS suboptimal subgroup, 96.0% and 96.3% had experienced itch and pain, respectively, in the past 24 h (data not shown).
DISCUSSION
This large observational study of the general CHE population in 6 countries adds new real-world data on the patient experience of living with CHE, with a particular focus on TCS. Although nearly 70% of participants reported being currently treated, disease severity was high overall; over half reported moderate to severe disease signs in the past week and more than 40% were in flare state at the time of the survey.
Due to the fluctuating nature of CHE, it can be difficult to assess severity in clinical practice. Patients are often seen when undergoing treatment, and assessment at 1 time point might not reflect the true disease severity. To capture different severity aspects, we used 2 severity indicators: self-reported severity of disease signs and treatment groups representing the CHE treatment stages overall in line with treatment guidelines (e.g. Thyssen et al. [4]).
Our results show a significantly higher occurrence of symptoms among participants reporting moderate to severe signs compared with those with mild signs. Moreover, self-reported severity of both signs and symptoms (itch, pain, and sleep disturbance), and the occurrence of flare-related signs/symptoms, increased with higher treatment stages. Between treatment groups, the highest severity, as observed by signs, symptom severity, and flare experiences, was represented by participants in the systemics/phototherapy group. In this group, pain during flares was common. The mechanism of pain in CHE is not clearly understood but may relate to the occurrence of fissures (4, 21).
Overall, a large proportion, 86.4%, of those ever treated with TCS experienced that the eczema improved or was gone with treatment. Nonetheless, a relatively high symptom severity was reported in the TCS treatment group, particularly for itch. Noteworthy was that the 10% never treated for CHE reported higher symptom severity than those with no current treatment, indicating possible undertreatment.
A particularly high disease burden was reported by participants in the small subgroup “TCS suboptimal” who rated symptom severity significantly higher than the remaining 90% with moderate to severe signs, and at levels comparable to those on systemics/phototherapy.
The evaluation of TCS treatment experiences showed that a considerable proportion never started/discontinued TCS treatment due to fear of TCS. In line with this, findings from the Danish skin cohort have shown that phobia against TCS is common and can impair treatment compliance (22).
Disease severity based on proportions reporting moderate to severe signs was higher in our study (51%) compared with a Dutch study of hand eczema in the general population (36.5%; past year) (15), but lower compared with studies of CHE in the Danish skin cohort (80%; current) (22). Discrepancies between studies may be explained by differences in demographics of the study populations, and time periods for evaluation. The Danish study was limited to patients diagnosed by dermatologists, indicating more severe CHE.
Moreover, our study showed a higher flare frequency, but shorter flare duration, compared with a multinational study by Borg et al. (23) (mean [SD)] number of flares 3.2 [1.7] and month duration 2 [1.7] over 12 months). Flare frequency was also higher compared with a German study based on the CARPE registry, which included patients enrolled at dermatology practices or hospital clinics with an inadequate response to TCS (18). Differences may depend on study design; our study was based on self-reported data whereas the other studies used physician-reported data of more severe cases.
Strenght and limitation
A strength of this study was the self-reported data that reflect real-world routine care. The sample captures the general CHE population in 6 countries, both overall and across subgroups representing different aspects of CHE severity. The representativeness was further enhanced by quotas and weighting.
A major limitation was the exclusion of 900 participants who reported participation in a clinical trial, or treatment with a new drug in development (see Fig. S2). A potential misinterpretation of the question may have resulted in excluding participants using new products on the market and caused a selection bias favouring those with milder disease and a lower disease burden. Furthermore, using online panels and self-reported data may have introduced biases (e.g., selection, coverage, non-response, inaccurate recall, or false reporting bias). Quality checks were performed to avoid data inconsistencies.
Another limitation was the cross-sectional study design, which limited the possibility to evaluate disease severity in relation to treatment effectiveness. The large variation in severity between treatment groups may partly reflect proportions in flare state at the time of the survey. Moreover, distinguishing between types of topical treatments (e.g., topical calcineurin inhibitors), TCS potency level, and types of systemic treatments, which was not considered feasible in a general population survey, would have provided a more comprehensive understanding of treatments. Nonetheless, the results suggest insufficient management of CHE across treatment groups.
Noteworthy is that our survey, and the other studies mentioned, were performed before the approval of the new topical pan-JAK inhibitor delgocitinib cream approved by the European Medicines Agency for treatment of adults with moderate to severe CHE for whom TCS treatment is inadequate or inappropriate (24–26). Future research should investigate sign/symptom burden in the future landscape of treatments, including the real-world effectiveness of delgocitinib cream, and other non-steroidal treatment options.
Conclusion
The results indicate that, despite a high treatment rate, the general CHE population experiences a high disease burden that differs significantly across the severity spectrum and treatment stages. A particularly high burden was observed among individuals at the highest treatment stages (i.e., systemics/phototherapy), and those not benefiting from TCS, suggesting a need for more effective treatment alternatives in these subgroups.
ACKNOWLEDGEMENTS
The authors wish to thank the survey participants. The CHECK study was funded by LEO Pharma A/S, Ballerup, Denmark. The authors who are employees of the funder had no role in the data collection; however, they were involved in the data analysis, interpretation, writing of the manuscript, and the decision to submit. Medical writing support, including assisting authors with the development of the manuscript drafts and incorporation of comments, was provided by Karin Wahlberg at the Swedish Institute for Health Economics, Lund Sweden, supported by LEO Pharma A/S, Ballerup, Denmark according to Good Publication Practice Guidelines (https://www.ismpp.org/gpp-2022). The authors received no honoraria related to the development of this publication.
Ethical approval and patient consent: Informed consent was obtained from all study participants, and the study was conducted in accordance with the clinical study protocol, Good Pharmacoepidemiology Practices (GPP), and local applicable regulatory requirements. Ethical approval was granted by Cerner Enviza Institutional Review Board (IRB).
Data availability: The data underlying this article will be shared on reasonable request to the corresponding author.
Disclosure statements: SM has been an investigator and/or has received honoraria as consultant/adviser or speaker and/or grants from AbbVie, Almirall, Alumis, Aralez, Arcutis, Basilea, Bausch and Lomb, Bristol Myer Squibb, Boehringer Ingelheim, Evidera, Galderma, GSK, Incyte, Jamp Biopharma, Janssen, LEO Pharma A/S, Lilly, Moonlake, Novartis, Pfizer, Sanofi, Sun Pharma, and UCB. MCF has served on advisory boards, received honoraria for lectures and/or research grants from AMGEN, Almirall, AbbVie, Boehringer-Ingelheim, BMS, Galderma, Incyte, LEO Pharma, Pierre Fabre, UCB, Lilly, Pfizer, Janssen, MSD, Novartis, Sanofi, Regeneron, and Sun Pharma. MNC has been a consultant, advisory board member, investigator, and/or speaker for AbbVie, LEO Pharma, Pfizer, and Sanofi Genzyme. AMGA has received research or advisory funding from Almirall, Amgen, AstraZeneca, Avene, Blue-Print, Celldex, Celltrion, Escient Pharmaceuticals, Genentech, GSK, Harmonic Bio, Incyte, Instituto Carlos III-FEDER, Jaspers, Leo Pharma, Menarini, Mitsubishi Tanabe Pharma, Noucor, Novartis, Sanofi-Regeneron, Septerna, Servier, Thermo Fisher Scientific, and Uriach Pharma. LB and PLC are employees of and shareholders in Oracle Life Sciences. Oracle Life Science received funding from Leo Pharma to carry out this study. MK and JMN are employed by and shareholders in LEO Pharma A/S. CA has received honoraria for consultancy work from Dr Wolff GmbH Bionorica, Sanofi, LEO Pharma, Incyte, Pfizer, Rheacell, and IVDK, and institutional funding from Dr Wolff GmbH and Bionorica. AB has had ad hoc consultancy/travel/lecturing agreements with AbbVie, Almirall, BMS, Galderma, Janssen Pharmaceuticals, LEO Pharma, Lilly, MSD, Novartis, Pfizer, Sanofi, and UCB.
REFERENCES
- Apfelbacher C, Bewley A, Molin S, Fargnoli MC, Giménez-Arnau AM, Brignoli L, et al. Prevalence of chronic hand eczema in adults: a cross-sectional survey of over 60 000 respondents from the general population of Canada, France, Germany, Italy, Spain and the UK. Br J Dermatol 2025; 192: 1047–1054. https://doi.org/10.1093/bjd/ljaf020
- Agner T, Elsner P. Hand eczema: epidemiology, prognosis and prevention. J Eur Acad Dermatol Venereol 2020; 34: 4–12. https://doi.org/10.1111/jdv.16061
- Karagounis TK, Cohen DE. Occupational hand dermatitis. Curr Allergy Asthma Rep 2023; 23: 201–212. https://doi.org/10.1007/s11882-023-01070-5
- Thyssen JP, Schuttelaar MLA, Alfonso JH, Andersen KE, Angelova-Fischer I, Arents BWM, et al. Guidelines for diagnosis, prevention, and treatment of hand eczema. Contact Dermatitis 2022; 86: 357–378. https://doi.org/10.1111/cod.14035
- Meding B, Lindahl G, Alderling M, Wrangsjö K, Anveden Berglind I. Is skin exposure to water mainly occupational or nonoccupational? A population-based study. Br J Dermatol 2013; 168: 1281–1286. https://doi.org/10.1111/bjd.12275
- Cazzaniga S, Ballmer-Weber BK, Gräni N, Spring P, Bircher A, Anliker M, et al. Medical, psychological and socio-economic implications of chronic hand eczema: a cross-sectional study. J Eur Acad Dermatol Venereol 2016; 30: 628–637. https://doi.org/10.1111/jdv.13479
- Quaade AS, Alinaghi F, Dietz JB, Erichsen CY, Johansen JD. Chronic hand eczema: a prevalent disease in the general population associated with reduced quality of life and poor overall health measures. Contact Dermatitis 2023; 89: 453–463. https://doi.org/10.1111/cod.14407
- Maden S, Ozbagcivan O, Onur Aysevener BE, Aktan S. Quality of life, anxiety, depression, social anxiety and avoidance in patients with chronic hand eczema. Ital J Dermatol Venerol 2021; 156: 562–569. https://doi.org/10.23736/S2784-8671.21.06645-1
- Kouris A, Armyra K, Christodoulou C, Katoulis A, Potouridou I, Tsatovidou R, et al. Quality of life, anxiety, depression and obsessive-compulsive tendencies in patients with chronic hand eczema. Contact Dermatitis 2015; 72: 367–370. https://doi.org/10.1111/cod.12366
- Zalewski A, Krajewski PK, Szepietowski JC. Prevalence and characteristics of itch and pain in patients suffering from chronic hand eczema. J Clin Med 2023; 12: 4198. https://doi.org/10.3390/jcm12134198
- Egeberg A, Schlapbach C, Haugaard JH, Nymand L, Thein D, Thomsen SF, et al. Adverse events from topical corticosteroid use in chronic hand eczema: findings from the Danish Skin Cohort. JAAD International 2024; 14: 77–83. https://doi.org/10.1016/j.jdin.2023.11.004
- Silvestre Salvador JF, Heras Mendaza F, Hervella Garcés M, Palacios-Martínez D, Sánchez Camacho R, Senan Sanz R, et al. Guidelines for the diagnosis, treatment, and prevention of hand eczema. Actas Dermosifiliogr (Engl ed.) 2020; 111: 26–40. https://doi.org/10.1016/j.ad.2019.04.005
- Svendsen SV, Bach RO, Mortz CG. Prevalence of contact allergy to corticosteroids in a Danish patient population. Contact Dermatitis 2022; 87: 273–279. https://doi.org/10.1111/cod.14135
- Tancredi V, Buononato D, Caccavale S, Di Brizzi EV, Di Caprio R, Argenziano G, et al. New perspectives in the management of chronic hand eczema: lessons from pathogenesis. Int J Mol Sci 2023; 25: 362. https://doi.org/10.3390/ijms25010362
- Voorberg AN, Loman L, Schuttelaar MLA. Prevalence and severity of hand eczema in the Dutch general population: a cross-sectional, questionnaire study within the Lifelines cohort study. Acta Derm Venereol 2022; 102: adv00626. https://doi.org/10.2340/actadv.v101.432
- Ruppert L, Apfelbacher C, Molin S, Bauer A, Mahler V, Schmitt J, et al. Itching in patients with chronic hand eczema: data from the CARPE registry. Dermatology 2014; 229: 146–153. https://doi.org/10.1159/000362901
- Apfelbacher C, Molin S, Weisshaar E, Bauer A, Elsner P, Mahler V, et al. Characteristics and provision of care in patients with chronic hand eczema: updated data from the CARPE registry. Acta Derm Venereol 2014; 94: 163–167. https://doi.org/10.2340/00015555-1632
- Apfelbacher CJ, Ofenloch RF, Weisshaar E, Molin S, Bauer A, Mahler V, et al. Chronic hand eczema in Germany: 5-year follow-up data from the CARPE registry. Contact Dermatitis 2019; 80: 45–53. https://doi.org/10.1111/cod.13113
- ALL GLOBAL [Internet]. Global Reach [cited 04 Nov 2025]. Available from: https://www.allglobal.com/#reach
- Coenraads PJ, Van Der Walle H, Thestrup-Pedersen K, Ruzicka T, Dreno B, De La Loge C, et al. Construction and validation of a photographic guide for assessing severity of chronic hand dermatitis. Br J Dermatol 2005; 152: 296–301. https://doi.org/10.1111/j.1365-2133.2004.06270.x
- Pesqué D, Silvestre-Salvador JF, Figueiredo AC, Pujol RM, Gonçalo M, Giménez-Arnau AM. A review of hand eczema subtypes: clinical features, biomarkers and treatment strategies. Contact Dermatitis 2025; 92: 421–435. https://doi.org/10.1111/cod.14775
- Christensen MO, Sieborg J, Nymand LK, Guttman-Yassky E, Ezzedine K, Schlapbach C, et al. Prevalence and clinical impact of topical corticosteroid phobia among patients with chronic hand eczema: findings from the Danish Skin Cohort. J Am Acad Dermatol 2024; 91: 1094–1103. https://doi.org/10.1016/j.jaad.2024.07.1503
- Borg E, Munro D, Thoning H. The management of Chronic Hand Eczema: A retrospective patient record review. Contact Dermatitis 2024; 90: 365-371. https://doi.org/10.1111/cod.14477
- Bissonnette R, Warren RB, Pinter A, Agner T, Gooderham M, Schuttelaar MLA, et al. Efficacy and safety of delgocitinib cream in adults with moderate to severe chronic hand eczema (DELTA 1 and DELTA 2): results from multicentre, randomised, controlled, double-blind, phase 3 trials. Lancet 2024; 404: 461–473. https://doi.org/10.1016/S0140-6736(24)01027-4
- European Medicines Agency (EMA). Anzupgo (delgocitinib)-EPAR. EMA/355342/2024; EMEA/H/C/006109. Available from: https://www.ema.europa.eu/en/medicines/human/EPAR/anzupgo
- Giménez-Arnau AM, Pinter A, Sondermann W, Reguiai Z, Woolf R, Lynde C, et al. Efficacy and safety of topical delgocitinib cream versus oral alitretinoin capsules in adults with severe chronic hand eczema (DELTA FORCE): a 24-week, randomised, head-to-head, phase 3 trial. Lancet 2025; 405: 1676–1688. https://doi.org/10.1016/S0140-6736(25)00001-7