ORIGINAL REPORT
Predicting Melanoma Impact on the Swedish Healthcare System from the Adult Population Using Machine Learning on Registry Data
Martin GILLSTEDT1,2#  , Lena STEMPFLE3# , John PAOLI1,2 , Fredrik D. JOHANSSON3 and Sam POLESIE1,2,4
1Department of Dermatology and Venereology, Institute of Clinical Sciences, Sahlgrenska Academy, University of Gothenburg, Gothenburg, 2Department of Dermatology and Venereology, Sahlgrenska University Hospital, Gothenburg, Region Västra Götaland, 3Department of Computer Science and Engineering, Chalmers University of Technology and University of Gothenburg, Gothenburg, and 4Center for Digital Health, Sahlgrenska University Hospital, Gothenburg, Region Västra Götaland, Sweden
#Joint first authors.
Melanoma incidence has increased in Western countries over the past 50 years, leading to significant healthcare costs. In Sweden, comprehensive healthcare registries enable large-scale prediction studies using machine learning. Several machine learning models were evaluated to predict melanoma diagnoses using Swedish registry data, assessing the added value of diagnostic and medication data beyond demographics. The study included all adults in Sweden with continuous residency for 9.5 years (n = 6,036,186). The outcome was a melanoma diagnosis, including melanoma in situ, recorded within 5 years after the index date (31 December 2014). Predictors included age, sex, income, education, marital status, region of birth, diagnoses, and dispensed drugs. Models tested were logistic regression, gradient boosting, random forests, and a neural network. A total of 38,582 individuals (0.64%) developed melanoma. The gradient boosting model using all predictors performed best, with an area under the receiving operating characteristics curve (AUC) of 0.735 (95% confidence interval [CI], 0.725–0.746). When diagnosis and medication data were excluded, AUC dropped to 0.681 (95% CI: 0.670–0.691). The findings highlight that including healthcare codes improves predictive performance, and demonstrate the utility of Swedish registries for computational phenotyping. This approach may support early detection of melanoma and targeted follow-up.
SIGNIFICANCE
Melanoma is a serious form of skin cancer, and early detection saves lives. In this study, we used data from the entire Swedish population to explore whether computers can help identify people at higher risk before they develop melanoma. Unlike previous studies that used images or focused only on advanced cases, we looked at everyday healthcare records – such as age, past diagnoses, and medicines. This approach could help health systems better target screening and prevention, making early diagnosis more likely and reducing the burden on both patients and society.
Key words: melanoma; machine learning; dermatology; healthcare register; prediction.
Citation: Acta Derm Venereol 2026; 106: adv44610. DOI: https://doi.org/10.2340/actadv.v106.44610.
Copyright: © 2026 The Author(s). Published by MJS Publishing, on behalf of the Society for Publication of Acta Dermato-Venereologica. This is an Open Access article distributed under the terms of the Creative Commons Attribution 4.0 International License (https://creativecommons.org/licenses/by/4.0/).
Submitted: Aug 13, 2025. Accepted after revision: Mar 9, 2026. Published: Apr 8, 2026.
Corr: Martin Gillstedt, Department of Dermatology and Venereology, University of Gothenburg, Gröna stråket 16, SE-413 45 Gothenburg, Sweden. E-mail: martin.gillstedt@gu.se
Competing interests and funding: The authors have no conflicts of interest to declare.
The Swedish state under agreement between the Swedish Government and the county councils; the ALF-agreement (ALFGBG-965546), the Gothenburg Society of Medicine (grant number: 973007), and HudFonden (Reference: 3205/2021:1). Fredrik D. Johansson and Lena Stempfle were supported in part by the Wallenberg AI, Autonomous Systems and Software Program funded by the Knut and Alice Wallenberg Foundation. The funders of the study had no role in the study design, data collection, data analysis, data interpretation, or writing of the report.
INTRODUCTION
Melanoma incidence continues to rise in Western countries, posing a growing public health challenge (1–5). In the United States in 2022, invasive melanoma represented 6% of new cancer cases in men and 5% in women – making it the fifth most common cancer in both sexes (4). This rising burden increases healthcare costs (3), underscoring the importance of early detection.
Nordic countries, with universal healthcare and rich national registries (6, 7), offer unique opportunities to develop machine-learning-based screening strategies using large-scale tabular data (diagnoses, treatments, and demographics). Such computational phenotyping can support precision medicine (8). Despite promising results in healthcare, machine learning has not yet been integrated into melanoma screening programmes like those in Germany (9) and the USA (10), where it could improve identification of high-risk individuals.
Objectives
The primary objective was to evaluate machine learning methods in predicting future melanoma (including in situ) occurrences using an extensive dataset that uniquely covers the entire adult population of Sweden with over 9.5 years of registry data. Specifically, the study aimed to predict melanoma cases documented in the Swedish cancer registry within 5 years after a uniform index date assigned to all individuals (Fig. 1). Furthermore, the study aimed to estimate the hypothetical utility of targeted screening or follow-up of high-risk individuals.
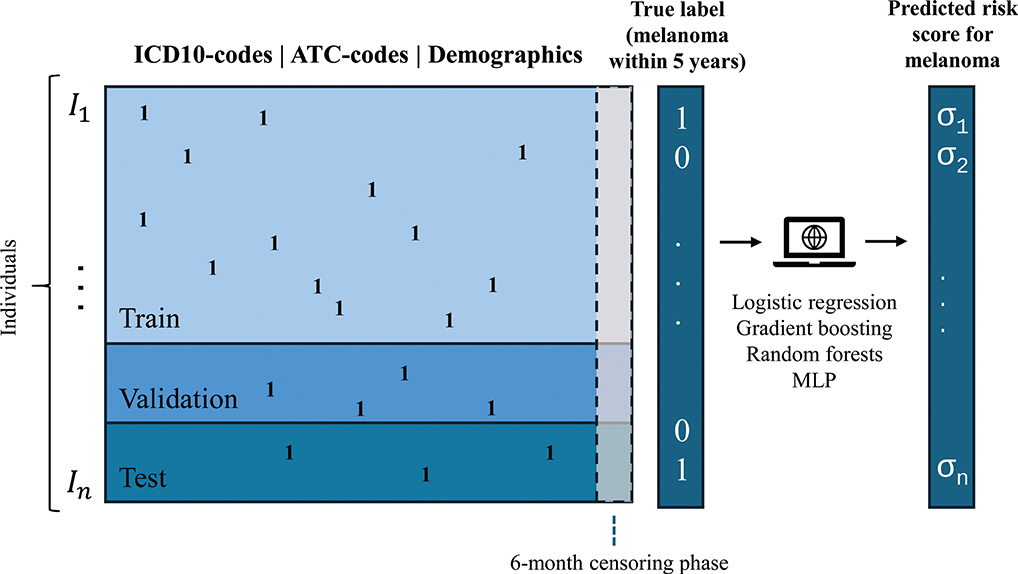
Fig. 1. Schematic graph of prediction data and outcome. MLP: Multilayer perceptron (a simple neural network model). Ones (1) represent the occurrence of codes. σi = risk scores (real number in [0, 1]) for melanoma outcome.
MATERIALS AND METHODS
Data and sample size
The study included the entire adult Swedish population (≥ 18 years) alive and residing in Sweden as of 31 December 2014 (the index date), without migration events between 4 July 2005 and the index date. (Details of all included variables are provided in Table SIII).
The dataset comprised 6,036,186 individuals, randomly divided into a training set (32,582 with melanoma, including melanoma in situ) and 5,064,900 negative cases (i.e., without melanoma), a hold-out validation set, and a test set, each containing 3,000 melanoma cases and 466,352 negative cases (Fig. 2). Individuals with migration events before the index date were excluded to simplify the analysis and avoid issues with missing data. The entire adult population of Sweden was included, ensuring maximally trained models.
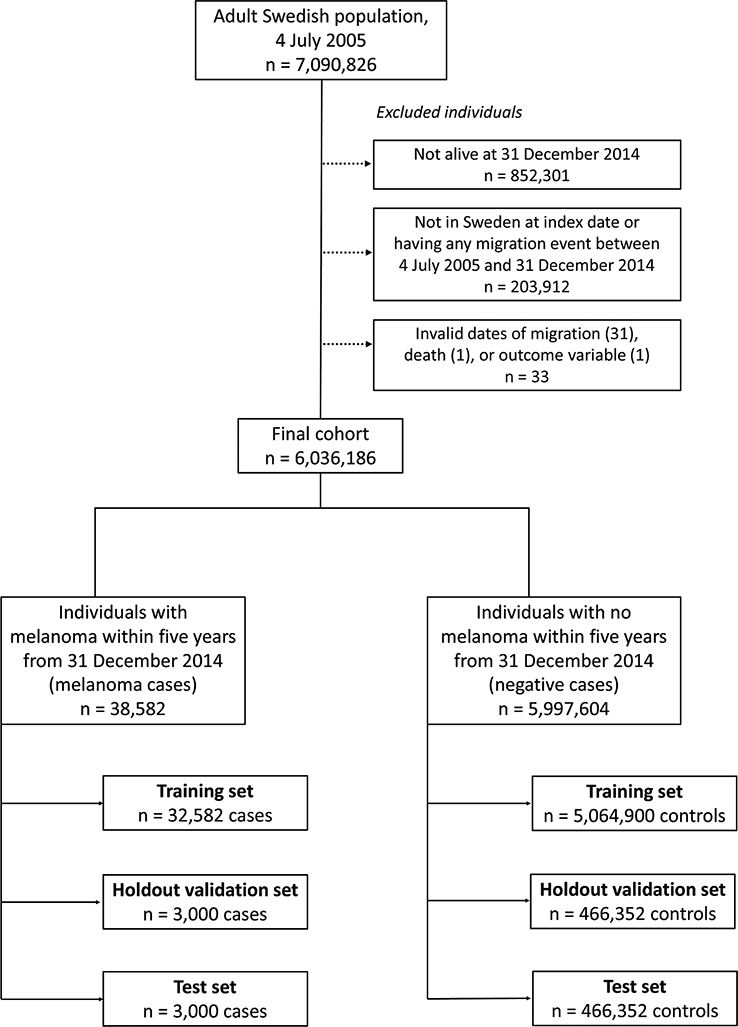
Fig. 2. Flowchart with details on exclusions of individuals.
Outcome
The outcome was defined as the occurrence of at least 1 melanoma case – including melanoma in situ – recorded in the Swedish cancer registry between 1 January 2015, and 31 December 2019. This time frame was chosen to exclude the COVID-19 pandemic era, aiming to reflect pre-pandemic healthcare patterns. The outcome captures melanomas burdening the Swedish healthcare system; individuals who are only diagnosed abroad or die without a melanoma diagnosis are considered negative cases.
Predictors
To ensure that no predictors inadvertently contained definitive information concerning the outcome, such as a melanoma recorded in the cancer registry after a potential time lag, a 6-month censoring period prior to the index date was applied to all predictors in the analysis. The predictors included demographic and socioeconomic variables such as sex, age group, education level, region of birth, whether the individual’s parents were born in Sweden, civil status, and disposable income. Additionally, medical and clinical predictors were used, including: 379 full ICD-O-10 codes, 3,454 ICD-10 codes (first 3 characters), 1,930 full ATC codes, and 28 anatomical site and morphology basal cell carcinoma codes.
Data preparation
Age was divided into 12 intervals: (27, 35), (35, 40) … (80, 85), > 85 years. All variables were transformed into a binary matrix format using one-hot encoding, where each entry indicates the presence (True) or absence (False) of a registry-specific ICD(-O)-10 or ATC code during the predictor period.
Missing data
Any data cells from predictor data with invalid or missing dates were discarded from the analysis. Invalid dates related to migration, death, or melanoma outcomes were found in 33 individuals, leading to their exclusion from all analyses (see Fig. 2). Some variables in the dataset had “missing” as a designated category, while true missing data such as empty cells or invalid entries were also present and categorized separately to maintain data integrity. For instance, individuals in the national patient registries had only empty string(s) as an ICD-10 code in 40.9% of cases. An empty string was treated as a separate code, indicating a patient visit. Variables with missing data included education level (0.83% missing, 0.018% invalid), region of birth (0.0011% missing, 0.0013% invalid), foreign or Swedish background (0.000017% invalid), and disposable income (0.018% missing).
Subgroup analyses
We used the full cohort in the main analysis and conducted subgroup analyses for 6 subcohorts. The subcohorts were designed to assess different risk factors for melanoma, including the prevalence of melanoma and skin colour. To define these subcohorts, combinations of 2 key criteria were used: the occurrence of melanoma in the cancer registry prior to the index date (including before 4 July 2005) and whether the individual was born in Sweden with both parents also born in Sweden (see Table II).
Balanced training set and model settings
A training set with balanced true labels was created by including all melanoma cases from the original training set and randomly selecting an equal number of negative cases. This reduced set was used for model-setting optimization, facilitating faster training. After identifying the optimal model setting, a model was trained on the entire training set using these parameters, except for a simple neural network model (multilayer perceptron; MLP), due to time constraints. To address class imbalance in the full training set, melanoma cases were oversampled to match the number of negative cases, reducing training bias towards the majority class.
Machine learning models and evaluation
In predicting melanoma, we tested 4 model types; logistic regression, random forests (11), gradient boosting (12), and MLP models. We adjusted each model’s settings using a validation set and assessed final performance on a separate test set. Details of all model settings are provided in Table SI. Our main performance measure was the AUC, which is unaffected by the imbalance between melanoma and non-melanoma cases. We also plotted receiver operating characteristic (ROC) curves. To understand practical usefulness, we estimated the positive predictive value (PPV) for individuals whose predicted risk exceeded a given threshold. We defined a utility ratio to represent the hypothetical benefit of screening someone who will develop melanoma within 5 years, relative to the cost of screening any individual. The utility for a threshold is the profit from screening those with risk scores above that threshold. It is calculated as the number screened times the utility ratio and PPV, minus the total number screened, in units of screening cost per individual.
Statistical analysis
Data preprocessing and machine learning models were implemented in Python 3.9.13 (Python Software Foundation, Wilmington, DE, USA) using the pandas and scikit-learn libraries. ROC comparisons for different models were performed in R 3.5.3 (R Foundation for Statistical Computing, Vienna, Austria) using De Long’s paired test (13). To estimate PPV and utility at various thresholds on the test set, bootstrapping was used for confidence intervals, and the p-values in Table SIII were adjusted for multiple comparisons with the Benjamini–Yekutieli method (14). All tests were two-sided, with p < 0.05 considered significant. No power calculation was conducted, as the goal was to assess model performance rather than test hypotheses.
Fairness
The Swedish registries do not include ethnicity, religion, or race. To ensure complete predictor data, we excluded individuals who migrated during the prediction period (see Fig. 2). We also performed subgroup analyses for people born in Sweden with 2 Swedish-born parents and for everyone else. Minority groups may be underrepresented in registries due to differences in healthcare access and health literacy (15–17), which can lead to biased models. Subgroup analyses were therefore used to assess data diversity and potential disparities.
RESULTS
Participants
The median age (interquartile range) was 65 (51–73) years for melanoma cases and 54 (42–68) years for negative cases (see Table I). Differences in birth region were noted: 94.0% of melanoma cases were born in Sweden vs 86.4% of negative cases. A previous melanoma diagnosis was observed in 9.1% of melanoma cases vs 0.9% of negative cases. The prevalence of basal cell carcinoma was 11.7% in melanoma cases and 2.7% in negative cases.
Model performance
The 4 methods (logistic regression, random forests, gradient boosting, and MLP) demonstrated similar performance on the test set, with AUC values of 0.726 (95% CI, 0.715–0.736), 0.720 (95% CI, 0.710–0.731), 0.735 (95% CI, 0.725–0.746), and 0.727 (95% CI, 0.716–0.737), respectively. The gradient boosting model achieved a significantly higher AUC compared with the other 3 models (p < 0.0001). Restricting the training of the gradient boosting model to age group and sex only provides a simple baseline for model performance, yielding an AUC of 0.644 (95%CI, 0.633–0.655). Training the gradient boosting model on data excluding ICD(-O)-10 codes, ATC codes, and basal cell carcinoma registry codes resulted in an AUC of 0.681 (95%CI, 0.670–0.691) (see Table II). ROC curves for the gradient boosting model are presented in Fig. 3.
| Outcome measure (95% CI) | Dataset used for evaluation | ||||||
| Main analysis | Subanalyses | ||||||
| Entire cohort | Naive for melanoma | Not naive for melanoma | Individual and both parents born in Sweden | Both naive for melanoma and individual and both parents born in Sweden | Individual or at least 1 parent not born in Sweden | Both naive for melanoma and individual or at least 1 parent not born in Sweden | |
| Logistic regression | |||||||
| AUC | 0.726 (0.715–0.736) | 0.708 (0.697–0.719) | 0.617 (0.582–0.652) | 0.709 (0.698–0.720) | 0.690 (0.678–0.702) | 0.758 (0.729–0.788) | 0.742 (0.711–0.774) |
| AUC (model trained only on age group and sex) | 0.644 (0.634–0.655) | 0.639 (0.628–0.651) | 0.535 (0.500–0.569) | 0.633 (0.622–0.645) | 0.629 (0.617–0.641) | 0.664 (0.633–0.696) | 0.655 (0.622–0.688) |
| AUC (model trained only on demographic data1) | 0.680 (0.670–0.691) | 0.676 (0.664–0.687) | 0.549 (0.514–0.583) | 0.657 (0.645–0.668) | 0.653 (0.641–0.665) | 0.733 (0.702–0.763) | 0.724 (0.693–0.756) |
| Balanced accuracy2 | 0.661 (0.643–0.678) | 0.650 (0.632–0.668) | 0.569 (0.510–0.625) | 0.651 (0.633–0.669) | 0.637 (0.617–0.656) | 0.698 (0.647–0.746) | 0.690 (0.637–0.740) |
| Random forests | |||||||
| AUC | 0.720 (0.710–0.731) | 0.703 (0.692–0.714) | 0.592 (0.558–0.627) | 0.704 (0.693–0.715) | 0.687 (0.675–0.699) | 0.752 (0.722–0.781) | 0.734 (0.703–0.765) |
| AUC (model trained only on age group and sex) | 0.649 (0.638–0.660) | 0.644 (0.633–0.656) | 0.543 (0.509–0.578) | 0.639 (0.628–0.651) | 0.635 (0.623–0.647) | 0.661 (0.630–0.693) | 0.652 (0.619–0.685) |
| AUC (model trained only on demographic data1) | 0.684 (0.673–0.694) | 0.680 (0.669–0.691) | 0.553 (0.518–0.588) | 0.661 (0.649–0.672) | 0.658 (0.646–0.670) | 0.733 (0.703–0.763) | 0.724 (0.693–0.756) |
| Balanced accuracy2 | 0.654 (0.637–0.671) | 0.641 (0.622–0.659) | 0.565 (0.507–0.622) | 0.642 (0.624–0.661) | 0.629 (0.609–0.648) | 0.687 (0.635–0.735) | 0.675 (0.621–0.726) |
| Gradient boosting | |||||||
| AUC | 0.735 (0.725–0.746) | 0.718 (0.707–0.729) | 0.618 (0.583–0.653) | 0.720 (0.708–0.731) | 0.701 (0.690–0.713) | 0.767 (0.738–0.796) | 0.751 (0.720–0.782) |
| AUC (model trained only on age group and sex) | 0.644 (0.633–0.655) | 0.639 (0.628–0.651) | 0.535 (0.500–0.569) | 0.633 (0.622–0.645) | 0.629 (0.617–0.641) | 0.664 (0.633–0.696) | 0.655 (0.622–0.688) |
| AUC (model trained only on demographic data1) | 0.681 (0.670–0.691) | 0.676 (0.665–0.687) | 0.549 (0.514–0.584) | 0.657 (0.646–0.668) | 0.653 (0.641–0.665) | 0.733 (0.703–0.763) | 0.725 (0.693–0.756) |
| Balanced accuracy2 | 0.668 (0.650–0.685) | 0.656 (0.637–0.674) | 0.582 (0.523–0.638) | 0.656 (0.638–0.674) | 0.647 (0.627–0.666) | 0.704 (0.653–0.751) | 0.690 (0.637–0.740) |
| MLP3 | |||||||
| AUC | 0.727 (0.716–0.737) | 0.709 (0.698–0.720) | 0.617 (0.582–0.651) | 0.711 (0.699–0.722) | 0.693 (0.681–0.704) | 0.750 (0.720–0.779) | 0.733 (0.702–0.765) |
| AUC (model trained only on age group and sex) | 0.651 (0.640–0.662) | 0.646 (0.635–0.658) | 0.545 (0.510–0.579) | 0.641 (0.630–0.653) | 0.637 (0.625–0.649) | 0.663 (0.632–0.695) | 0.654 (0.622–0.687) |
| AUC (model trained only on demographic data1) | 0.685 (0.675–0.696) | 0.680 (0.669–0.692) | 0.557 (0.522–0.591) | 0.661 (0.650–0.673) | 0.658 (0.646–0.670) | 0.735 (0.704–0.765) | 0.725 (0.694–0.757) |
| Balanced accuracy2 | 0.661 (0.644–0.678) | 0.649 (0.630–0.667) | 0.558 (0.500–0.616) | 0.653 (0.635–0.671) | 0.640 (0.620–0.659) | 0.689 (0.638–0.738) | 0.681 (0.627–0.732) |
| The model performance for logistic regression, random forests, gradient boosting, and MLP classifiers are included. The evaluation is conducted on the entire test set as well as six distinct subsets to provide a more comprehensive analysis. Bold entries denote the model with the highest AUC. 1Includes all variables except for all ICD(-O)-10 codes from the national cancer registry and national patient registries, ATC codes from the national prescribed drug registry and data from the national basal cell carcinoma registry. 2Balanced accuracy is defined as the accuracy for the threshold where sensitivity = specificity. 3Due to time constraints, the MLP models were not trained on the whole cohort, but only on the reduced dataset. |
|||||||
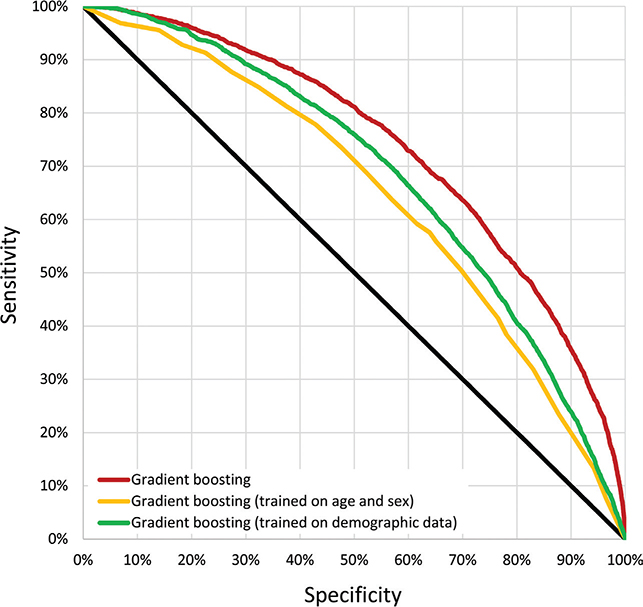
Fig. 3. Receiver operating characteristic curves (ROC). ROC curves are shown for gradient boosting (the best performing model). The performance of this model, also trained only on age and sex or demographic data, is also shown. The latter excludes ICD(-O)-10 codes, ATC codes, and data from the cancer and basal cell carcinoma registries.
In the subgroup analyses, the trained gradient boosting model on individuals naive for melanoma and those born in Sweden with both parents born in Sweden yielded AUCs of 0.718 (95% CI, 0.707–0.729) and 0.720 (95% CI, 0.708–0.731), respectively. Individuals not naive for melanoma, due to higher homogeneity, were considerably more unpredictable when assessing the risk for a new melanoma with an AUC of 0.618 (95% CI, 0.583–0.653) (Table II).
For the gradient boosting model, PPV estimates for various thresholds versus the number of individuals with a latent risk score larger than that threshold were computed (Fig. S1). The utility calculations for individuals naive for melanoma (Figs S2–S8) indicated that in order to achieve a positive utility (meaning a 95% CI not crossing zero), a utility ratio (R) of at least 21 (rounded off to an integer) was sufficient. A curve for the PPV vs risk-score intervals evaluated on the test set for the trained gradient boosting model can be found in Fig. S9.
For individuals naive for melanoma, born in Sweden, and with both parents born in Sweden, the predictors (Table III) most positively associated with a melanoma outcome, controlling for age and sex, included diagnoses of melanocytic nevi (OR = 3.9, 95% CI, 3.6–4.2), invasive melanoma (OR = 5.2, 95% CI, 2.9–9.3), melanoma in situ (OR = 5.4, 95% CI, 2.3–13), and basal cell carcinoma or squamous cell carcinoma (OR = 2.9, 95% CI, 2.7–3.2) in the national outpatient registry. Note that the patient registries have preliminary diagnoses and not pathologically verified diagnoses as in the national cancer registry. The predictors most negatively associated with the melanoma outcome included medicines associated with acute alcohol withdrawal, sedation, and anxiety relief (clomethiazole; OR = 0.33, 95% CI, 0.23–0.47) and Alzheimer’s disease (memantine; OR = 0.27, 95% CI, 0.19–0.39) and inpatient diagnoses associated with dementia and various drug addictions.
DISCUSSION
Overview of results
Our results demonstrated that models incorporating demographic data as well as historical dispensation of drugs and diagnoses substantially outperformed models based solely on demographic data (gradient boosting; AUC = 0.735 vs AUC = 0.681). This improvement in prediction highlights the potential for early identification of melanoma. As for the PPV estimates, when high risk was defined as being among the 301–400 individuals with the highest risk score (0.0066%), the PPV estimate was 33% (95% CI, 17–53). For individuals naive for melanoma, those among the top 1,001–1,100 risk scores (0.028%) had a PPV estimate of 6.8% (95% CI, 2.3–13), demonstrating the model’s ability to identify subgroups with a substantially higher risk than the baseline melanoma risk of 0.64% in the entire cohort.
The predictors most positively associated with a melanoma outcome, controlling for age and sex, were – expectedly – diagnoses of prevalent skin cancers (see Table III). The predictors most negatively associated with melanoma were medicines associated with dementia, drug addictions, alcoholism, sedation, and anxiety relief. A possible explanation for these negative associations could be that they are associated with a higher risk of death, which will lead to a rarer melanoma outcome as defined in this study. Another possible explanation is that these groups might have lower sun exposure.
Potential for future screening process
By identifying people with higher predicted risk, clinicians could prioritize follow-up and invite these individuals – via mail or digital outreach – for screening appointments. Although Sweden has universal healthcare, not all residents engage with the system equally. Registry-based risk stratification could help close these gaps for high-risk individuals. However, expanding screening carries a risk of overdiagnosis, mostly of basal cell carcinomas, leading to unnecessary costs. Complementary strategies – such as education on self-examination – may help balance early detection with practical benefit.
Context to related works
Machine learning has been widely used to predict survival and mortality in cancer and critical illness. Wang et al.(18) used medical data and registries to train a deep learning model that predicts non-melanoma skin cancer, yielding AUC 0.89. However, no external test-set was used, which may have lead to overfitting. Gillstedt et al. (19) conducted a similar analysis predicting melanoma, but age- and sex-matched melanoma cases and controls, giving AUC 0.59. Philonenko et al. predicted any cancer from health records (2019–2022) with AUC 0.85 (20), while Li et al. used light-GBM to predict 5-year survival in oral tongue squamous cell carcinoma with AUC 0.86 (21). Baltzer et al. analysed cervical-cancer screening data from 125,476 women, achieving AUC 0.71 and identifying high-risk groups (22). Early-death prediction in lung cancer with bone metastases reached AUC 0.82 in the 19,887-patient cohort of Cui et al. (23), and Tang et al. predicted 90-day mortality in intracerebral haemorrhage with AUC 0.76 (24).
Limitations
The data for this study were derived from Swedish registry records, limiting the generalizability of our findings to other countries. However, other Nordic countries, having comparable populations and registries (25), should be able to produce similar results. In the cancer registry both ICD-O-10 topography coding and SNOMED-based histopathological codes were available. In this study, the less granular ICD-O-10 codes were employed in order to reduce data size, memory usage, and training times. The models employed in this study all use time-independent occurrences of variables. Future studies could utilize time-dependent models. The outcome in this study is defined as the presence of a melanoma diagnosis burdening the Swedish healthcare system, and not whether an individual actually gets a melanoma, for example when abroad, potentially limiting comparability to other studies. Changes in data collection processes, such as the transition from ICD-10 to ICD-11 codes, may limit future model prediction ability. Additionally, evolving health-seeking behaviours, diagnostic criteria, more granular coding, and immigration trends may influence the models’ predictive performance over time. Utilizing the increased digitization of healthcare and personalized medicine, more innovative approaches incorporating image data and self-reported surveys could provide a more comprehensive view of melanoma risk. To improve our predictive approach, incorporating fairness constraints for all skin photo types (26) and additional calibration to reduce false negatives could help dermatologists prioritize patient care.
ACKNOWLEDGEMENTS
IRB approval status: The study was reviewed and approved by the Swedish Ethical Review Authority (registration number 2020-06761), the Ethics Review Appeals Board (registration number Ö14-2021/3.1), and amendment (2022-03535-02). This study followed the TRIPOD+AI guidelines (see Table SII).
REFERENCES
- Claeson M, Gillstedt M, Whiteman DC, Paoli J. Lethal melanomas: a population-based registry study in Western Sweden from 1990 to 2014. Acta Derm Venereol 2017; 97: 1206–1211. https://doi.org/10.2340/00015555-2758
- Godar DE. Worldwide increasing incidences of cutaneous malignant melanoma. J Skin Cancer 2011; 2011: 858425. https://doi.org/10.1155/2011/858425
- Guy GP Jr, Thomas CC, Thompson T, Watson M, Massetti GM, Richardson LC, et al. Vital signs: melanoma incidence and mortality trends and projections – United States, 1982–2030. MMWR Morb Mortal Wkly Rep 2015; 64: 591–596.
- Siegel RL, Miller KD, Fuchs HE, Jemal A. Cancer statistics, 2022. CA Cancer J Clin 2022; 72: 7–33. https://doi.org/10.3322/caac.21708
- Whiteman DC, Green AC, Olsen CM. The growing burden of invasive melanoma: projections of incidence rates and numbers of new cases in six susceptible populations through 2031. J Invest Dermatol 2016; 136: 1161–1171. https://doi.org/10.1016/j.jid.2016.01.035
- Pukkala E, Engholm G, Højsgaard Schmidt LK, Storm H, Khan S, Lambe M, et al. Nordic Cancer Registries: an overview of their procedures and data comparability. Acta Oncol 2018; 57: 440–455. https://doi.org/10.1080/0284186X.2017.1407039
- Laugesen K, Ludvigsson JF, Schmidt M, Gissler M, Valdimarsdottir UA, Lunde A, et al. Nordic health registry-based research: a review of health care systems and key registries. Clin Epidemiol 2021; 13: 533–554. https://doi.org/10.2147/CLEP.S314959
- Seedahmed MI, Mogilnicka I, Zeng S, Luo G, Whooley MA, McCulloch CE, et al. Performance of a computational phenotyping algorithm for sarcoidosis using diagnostic codes in electronic medical records: case validation study from 2 veterans Affairs Medical Centers. JMIR Form Res 2022; 6: e31615. https://doi.org/10.2196/31615
- Katalinic A, Eisemann N, Waldmann A. Skin cancer screening in Germany: documenting melanoma incidence and mortality from 2008 to 2013. Dtsch Arztebl Int 2015; 112: 629–634. https://doi.org/10.3238/arztebl.2015.0629
- Matsumoto M, Wack S, Weinstock MA, Geller A, Wang H, Solano FX, et al. Five-year outcomes of a melanoma screening initiative in a large health care system. JAMA Dermatol 2022; 158: 504–512. https://doi.org/10.1001/jamadermatol.2022.0253
- Breiman L. Random forests. Machine Learning 2001; 45: 5–32. https://doi.org/10.1023/A:1010933404324
- Mason L, Baxter J, Bartlett P, Frean M. Boosting algorithms as gradient descent. Advances in neural information processing systems, 1999; 12. https://papers.nips.cc/paper_files/paper/1999/file/96a93ba89a5b5c6c226e49b88973f46e-Paper.pdf
- DeLong ER, DeLong DM, Clarke-Pearson DL. Comparing the areas under two or more correlated receiver operating characteristic curves: a nonparametric approach. Biometrics 1988; 44: 837–845. https://doi.org/10.2307/2531595
- Benjamini Y, Yekutieli D. The control of the false discovery rate in multiple testing under dependency. Ann Statist 2001; 29: 1165–1188. https://doi.org/10.1214/aos/1013699998
- Chauhan A, Walton M, Manias E, Walpola RL, Seale H, Latanik M, et al. The safety of health care for ethnic minority patients: a systematic review. Int J Equity Health 2020; 19: 118. https://doi.org/10.1186/s12939-020-01223-2
- Hadziabdic E, Heikkila K, Albin B, Hjelm K. Problems and consequences in the use of professional interpreters: qualitative analysis of incidents from primary healthcare. Nurs Inq 2011; 18: 253–261. https://doi.org/10.1111/j.1440-1800.2011.00542.x
- Ezenwa E, Buster K. Health disparities and skin cancer in people of color. Pract Dermatol 2019: 38–42.
- Wang HH, Wang YH, Liang CW, Li YC. Assessment of deep learning using nonimaging information and sequential medical records to develop a prediction model for nonmelanoma skin cancer. JAMA Dermatol 2019; 155: 1277–1283. https://doi.org/10.1001/jamadermatol.2019.2335
- Gillstedt M, Polesie S. Ability to predict melanoma within 5 years using registry data and a convolutional neural network: a proof of concept study. Acta Derm Venereol 2022; 102: adv00750. https://doi.org/10.2340/actadv.v102.2028
- Philonenko P, Kokh V, Blinov P. Combining survival analysis and machine learning for mass cancer risk prediction using EHR data. arXiv preprint arXiv:230915039, 2023. https://doi.org/10.21203/rs.3.rs-3611680/v1
- Li L, Pu C, Jin N, Zhu L, Hu Y, Cascone P, et al. Prediction of 5-year overall survival of tongue cancer based machine learning. BMC Oral Health 2023; 23: 567. https://doi.org/10.1186/s12903-023-03255-w
- Baltzer N, Sundstrom K, Nygard JF, Dillner J, Komorowski J. Risk stratification in cervical cancer screening by complete screening history: applying bioinformatics to a general screening population. Int J Cancer 2017; 141: 200–209. https://doi.org/10.1002/ijc.30725
- Cui Y, Shi X, Wang S, Qin Y, Wang B, Che X, et al. Machine learning approaches for prediction of early death among lung cancer patients with bone metastases using routine clinical characteristics: an analysis of 19,887 patients. Front Public Health 2022; 10: 1019168. https://doi.org/10.3389/fpubh.2022.1019168
- Tang J, Wang X, Wan H, Lin C, Shao Z, Chang Y, et al. Joint modeling strategy for using electronic medical records data to build machine learning models: an example of intracerebral hemorrhage. BMC Med Inform Decis Mak 2022; 22: 278. https://doi.org/10.1186/s12911-022-02018-x
- Liljendahl MS, Ibler K, Vestergaard C, Skov L, Jain P, Rudolfsen JH, et al. Identifying mild-to-moderate atopic dermatitis using a generic machine learning approach: a Danish National Health Register Study. Acta Derm Venereol 2025; 105: adv42250. https://doi.org/10.2340/actadv.v105.42250
- Dullerud N, Roth K, Hamidieh K, Papernot N, Ghassemi M. Is fairness only metric deep? evaluating and addressing subgroup gaps in deep metric learning. arXiv preprint arXiv:220312748, 2022.