ORIGINAL REPORT
Economic Burden of Generalized Pustular Psoriasis: A Population-based Register Study in Finland
Xavier TEITSMA1, Laura HUILAJA2, Mirkka KOIVUSALO3, Juha MEHTÄLÄ3, Aino VESIKANSA3, Bregt KAPPELHOFF1, Maria GRÖNMAN4, Jarmo KAUKUA4, Pauliina NUUTINEN5 and Rafael PASTERNACK6
1Boehringer Ingelheim B.V., Amsterdam, the Netherlands, 2Research Unit of Clinical Medicine, University of Oulu and Medical Research Center, Oulu University Hospital, Oulu, 3MedEngine Oy, Helsinki, 4Boehringer Ingelheim Ky, Helsinki, 5Helsinki University Hospital, Helsinki, and 6Tampere University Hospital and Faculty of Medicine and Health Technology, Tampere University, Tampere, Finland
Generalized pustular psoriasis is an inflammatory disease characterized by potentially life-threatening flares. This study assessed the economic burden of generalized pustular psoriasis in Finland by comparing healthcare resource utilization and both direct and indirect costs to population-based and psoriasis vulgaris control groups and between generalized pustular psoriasis patients with and without flares. Patients with ≥ 2 generalized pustular psoriasis diagnoses (ICD-10: L40.1) at a dermatology clinic in secondary healthcare and matched controls were identified during 1996–2019 from national registers. Direct costs were based on primary and secondary healthcare resource utilization and medications, and indirect costs on productivity loss due to sick leaves, disability pensions, and rehabilitation periods. All-cause annual direct costs were 3-fold higher in generalized pustular psoriasis (mean: €10,323) compared with population-based (€3,345; p < 0.001), and psoriasis vulgaris controls (€3,569; p < 0.001). Having flares was associated with 2.7-fold higher direct costs compared with no flares (cost ratio 2.7; 95% CI, 2.1–3.5; p < 0.001), driven by higher hospitalization rates of patients with flares. Flares were also associated with 2.5-fold higher indirect costs (cost ratio 2.5; 95% CI, 1.6–4.0; p < 0.001) compared with no flares. This first comprehensive economic evaluation of generalized pustular psoriasis highlights the substantial economic impact, in particular in patients with flares, and emphasizes costs due to work disability.
SIGNIFICANCE
Generalized pustular psoriasis is a rare, chronic skin condition distinct from psoriasis, with some patients experiencing sudden, painful, and potentially life-threatening flares. This study evaluated the economic burden of generalized pustular psoriasis patients compared with the general population and psoriasis patients. Direct medical costs were 3 times higher in generalized pustular psoriasis than controls, mainly due to high hospitalization rate of generalized pustular psoriasis flare patients. Indirect costs, driven by disability pensions, were almost 3 times higher in patients with flares vs without. Our results demonstrate the substantial economic burden of generalized pustular psoriasis and underscore the significant effect of generalized pustular psoriasis on healthcare use and work productivity.
Key words: direct cost; flares; generalized pustular psoriasis; indirect cost; work productivity.
Citation: Acta Derm Venereol 2026; 106: adv44671. DOI: https://doi.org/10.2340/actadv.v106.44671.
Copyright: © 2026 The Author(s). Published by MJS Publishing, on behalf of the Society for Publication of Acta Dermato-Venereologica. This is an Open Access article distributed under the terms of the Creative Commons Attribution-NonCommercial 4.0 International License (https://creativecommons.org/licenses/by-nc/4.0/).
Submitted: Aug 22, 2025. Accepted after revision: Jan 19, 2026. Published: Feb 10, 2026.
Corr: Xavier Teitsma, Boehringer Ingelheim B.V., Amsterdam, the Netherlands. E-mail: xavier.teitsma@boehringer-ingelheim.com
Competing interests and funding: XT, BK, MG, BK, and JK are employees at Boehringer Ingelheim. LH has received educational grants from Takeda, CSL Behring, Janssen-Cilag, Novartis, and AbbVie; honoraria from Sanofi Genzyme, Amgen, Novartis, AbbVie, Boehringer Ingelheim, and Orion Pharma for consulting and/or speaking; and is an investigator for AbbVie and Amgen. MK, JM, and AV are employees at MedEngine Oy. RP has received an educational grant from AbbVie; honoraria from AbbVie, Amgen, BMS, Boehringer Ingelheim, Janssen, Eli Lilly, Leo Pharma, Novartis, Orion Pharma, Pfizer, and UCB for consulting and/or speaking; and participated in clinical studies sponsored by AbbVie, Amgen, BMS, Boehringer Ingelheim, GSK, and Pfizer. PN has received educational grants from AbbVie, Novartis, Medac, and Sanofi; and honoraria from AbbVie, Amgen, Boehringer Ingelheim, Janssen-Cilag, Leo Pharma, Eli Lilly, Mylan, Orion, and UCB Pharma for consulting and/or speaking
This study was supported and funded by Boehringer Ingelheim Finland Ky (Helsinki, Finland).
INTRODUCTION
Generalized pustular psoriasis (GPP) is a chronic, systemic, neutrophilic inflammatory disease, characterized by a variable clinical course and periods of flaring, which can be life-threatening (2–6). GPP is a relatively rare disease with prevalence estimates of 0.18–18 per 100,000 individuals (1, 7–11). GPP patients have a shorter life expectancy than matched population and psoriasis vulgaris (PV) controls (10, 12).
Pathogenesis of GPP and PV is driven by distinct interleukin (IL) pathways. PV is primarily driven by the IL-17/23 pathway, whereas GPP is largely mediated by IL-36 (13, 14). Until recently, the treatment of GPP has been based on controlling symptoms with conventional antipsoriatics, which may not effectively prevent chronic symptoms (1, 15). Recently, an IL-36 receptor antagonist, spesolimab, has been approved in the USA, EU, and UK for continuous treatment of adults with GPP, and additional treatments targeting IL-36 are under development (14, 16–19).
Despite its rarity, GPP imposes a considerable economic burden on healthcare. Higher overall healthcare resource utilization (HCRU) and direct medical costs of GPP compared with population-based and PV controls have been described in the USA, Canada, Europe, and Japan (10, 20–23). Among different HCRU types, hospitalization rates and costs can be up to twice as high, hospital stays up to 5 times longer and medication costs approximately double, in GPP compared with PV (11, 21–23). The direct costs of GPP are intensified by flares, as 50–90% of patients require hospitalization due to flares (3, 4, 8, 10, 24).
In addition to substantial direct costs, the economic burden of GPP extends beyond healthcare in the form of lost productivity due to sick leave and work disability. In Sweden, patients with GPP were reported to experience more long sick leaves compared with control groups (25). In the USA, GPP was associated with higher sick leave rates and related indirect costs compared with the general population, but not compared with PV (26).
There is currently a lack of research on the long-term work disability and overall indirect costs associated with GPP. Moreover, while HCRU rates have been compared in patients with and without flares (10, 27), studies comparing both direct and indirect costs between these groups remain limited.
Thorough understanding of the total burden of disease is even more important with the introduction of new treatments and in evaluating their cost efficiency. The Finnish health and social care registers provide comprehensive data at the population level for detailed assessment of HCRU and the economic burden of GPP. We characterized the primary and secondary HCRU, and direct medical and indirect costs of GPP patients and matched controls in Finland. Additionally, we compared the direct and indirect costs between GPP patients with and without flares, to further understand the socioeconomic burden of GPP.
MATERIALS AND METHODS
Design
This was a nationwide, non-interventional, retrospective study utilizing data from Finnish national health and social care registers.
Study populations and follow-up
The study population included all patients with >2 GPP (ICD-10: L40.1) diagnoses recorded at a dermatology clinic in secondary care during 1996–2019 in the Care Register for Health Care (the Finnish Institute for Health and Welfare). The follow-up started at the date of the first GPP diagnosis (index date). The study period was 1996–2021 to allow a minimum of a 2-year follow-up. The follow-up finished at the end of the study period, or death. Subgroup analyses for costs were performed for working age (18–64 years) individuals, for whom follow-up finished at the end of the study period, or 65 years of age.
Two subgroups of GPP patients were formed: patients with ≥1 flare and patients without flares, during the follow-up. Flares were defined by a primary diagnosis of GPP recorded during a hospitalization.
Each GPP patient at index date was matched by age and sex with 10 PV (ICD-10: L40.0) and 10 population-based controls. The PV population without a GPP diagnosis was identified from the Care Register for Health Care, and the population-based control group without GPP/PV diagnoses was identified by combining data from the Digital and Population Data Services Agency and the Care Register for Health Care. The follow-up started from the matched date and finished at the end of the study period, or death.
Data sources
Health and social care data were collected from the nationwide registers by the Finnish Institute for Health and Welfare (primary and secondary care ICD-10 diagnoses, HCRU), the Social Insurance Institution (pharmacy dispensations of reimbursed prescription medications, sick leaves >10 days, rehabilitation periods, disability pensions), and Statistics Finland (dates of death).
Study outcomes
HCRU. HCRU rates per patient per year (PPPY) were reported as total number of all, primary, and secondary contacts, and as number by contact type in secondary care: follow-up contacts, emergency room (ER) visits, intensive care unit (ICU) visits, and hospitalizations (rate and length of stay). All-cause contacts were defined as any healthcare contact, and GPP-related contacts as those with GPP as a primary or secondary diagnosis.
Direct costs. Direct medical all-cause and GPP-related costs (€) per person per year (PPPY) consisted of primary and secondary healthcare and prescribed medication costs (Table SI). HCRU costs were calculated by using the HCRU rates and the standard unit cost report by the Finnish Institute for Health and Welfare (2017, most recent version) (28). Costs were adjusted to 2017 price levels using the public sector health and social care price index. Medication costs were directly available from the Social Insurance Institution and were adjusted to 2017 prices using a fixed 3% interest rate.
Social benefits and indirect costs. The proportions of patients with all-cause sick leaves (long sick leaves of >10 days reimbursed by the Social Insurance Institution), rehabilitation periods, and disability pensions, and the period lengths PPPY for those with ≥1 event were reported for total and working-age populations. To cover the non-deductible period before the payment of sickness allowance, 10 working days were added to the sick leaves. Indirect costs (€) were calculated as total, and per individual cost components in both the total and working-age populations. The Human Capital Approach (HCA) (29) was used for calculating the cost of the productivity loss by multiplying the number of days lost by median gross wages in 2019 (as available from the public statistical database of Statistics Finland) per sex and age in Finland (30).
Total costs. Total costs, consisting of all-cause direct medical and indirect costs PPPY, were reported for total and working-age populations.
Statistical analyses
The primary and secondary HCRU, direct medical costs, and social benefits and indirect costs were presented by mean with standard deviation (SD), and median with quartiles (Q1 and Q3). All outcome analyses were annualized over the follow-up period (the costs divided by the follow-up time in years). In matched comparisons, conditional logistic regression was used (31). GPP patients with and without flares were compared using t-tests or χ2 tests.
For age- and sex-adjusted modelling of direct medical and indirect costs in patients with and without flares, negative binomial, inverse Gaussian, gamma, and Gaussian with log-link models were compared. The negative model was selected as it was the best fit according to the Akaike information criterion. Regression modelling results were reported by estimated coefficients (cost ratio, CR), 95% confidence intervals (CI), and p-values.
RESULTS
GPP population
A total of 286 patients with ≥2 GPP diagnoses in secondary healthcare were identified during 1996–2019, 59.1% were female, and the mean age at index date was 56.0 (SD, 17.9) years. Overall, 123 patients (43.0%) experienced ≥1 flare during a mean follow-up time of 11.1 (SD, 6.8) years, and 50.4% had more than 1 flare. Among these patients, the mean (SD) flare rate was 0.74 (3.0) per patient-year, and 76.4% experienced their first flare at index date. Additional relevant information has been previously published by Koivusalo et al. (32).
Primary and secondary HCRU
In GPP, the mean total number of all-cause healthcare contacts was 2-fold higher (1.7 PPPY; SD, 3.8) compared with population-based (0.8; SD, 2.1; p < 0.001) and PV controls (0.8; SD, 1.6; p < 0.001) (Table I). In GPP, 41.2% of all healthcare contacts were GPP-related (0.7; SD, 2.8) (Table SII). Of the different contact types, the differences between the groups were largest for hospitalizations, with 3-fold higher mean rate in GPP (1.2; SD 3.2) than in both control groups (0.4; SD, 1.1–1.3; p < 0.001) (see Table I). Also, the hospital stays were 2.6 and 3.2 times longer for GPP (11.9 days; SD, 35.1) compared with population-based (4.5; SD, 19.1; p < 0.001) and PV controls (3.6; SD, 11.9; p < 0.001), respectively. The proportion of GPP patients with primary care contacts was lower (87.1%) than in population-based (92.4%, p < 0.01) and PV controls (94.5%, p < 0.001).
| GPP | Matched controls | ||||
| Without flares(n = 163) | ≥ 1 flare(n = 123) | All(n = 286) | Population control (n = 2,844) | PV control(n = 2,752) | |
| Total number of all Contacts | |||||
| Mean (SD) | 1.2 (2.5)## | 2.4 (4.9)## | 1.7 (3.8) | 0.8 (2.1)*** | 0.8 (1.6)*** |
| Median (Q1, Q3) | 0.6 (0.4, 1.1)## | 1.3 (0.6, 2.2)## | 0.8 (0.4, 1.6) | 0.5 (0.3, 0.8)*** | 0.5 (0.3, 0.9)*** |
| Primary HCRU | |||||
| Total primary care contacts | |||||
| n (%) | 151 (92.6%)## | 98 (79.7%)## | 249 (87.1%) | 2,628 (92.4%)** | 2,602 (94.5%)*** |
| Mean (SD) | 0.3 (0.7) | 0.2 (0.3) | 0.3 (0.6) | 0.2 (0.8) | 0.2 (0.2)*** |
| Median (Q1, Q3) | 0.2 (0.1, 0.3) | 0.2 (0.05, 0.3) | 0.2 (0.1, 0.3) | 0.2 (0.10, 0.27) | 0.2 (0.1, 0.3)*** |
| Secondary HCRU | |||||
| Total secondary care contacts | |||||
| n (%) | 163 (100%) | 123 (100%) | 286 (100%) | 2,596 (91.3%) | 2,752 (100%) |
| Mean (SD) | 0.9 (2.0)## | 2.2 (5.0)## | 1.5 (3.6) | 0.6 (1.7)*** | 0.6 (1.6)*** |
| Median (Q1, Q3) | 0.4 (0.2, 0.8)## | 1.0 (0.4, 1.9)## | 0.6 (0.3, 1.2) | 0.3 (0.1, 0.6)*** | 0.4 (0.2, 0.6)*** |
| Secondary care follow-up contacts | |||||
| n (%) | 106 (65.0%)## | 57 (46.3%)## | 163 (57.0%) | 1,356 (47.7%)** | 1,713 (62.2%) |
| Mean (SD) | 0.1 (0.2) | 0.09 (0.2) | 0.09 (0.2) | 0.06 (0.1)*** | 0.07 (0.1)** |
| Median (Q1, Q3) | 0.06 (0.0, 0.1) | 0.0 (0.0, 0.1) | 0.05 (0.0, 0.1) | 0.0 (0.0, 0.1)*** | 0.05 (0.0, 0.1)** |
| Secondary care hospitalizations | |||||
| n (%) | 122 (74.8%) | 123 (100%) | 245 (85.7%) | 1,871 (65.8%)** | 2,127 (77.3%)*** |
| Mean (SD) | 0.6 (1.5)### | 1.9 (4.5)### | 1.2 (3.4) | 0.4 (1.1)*** | 0.4 (1.3)*** |
| Median (Q1, Q3) | 0.5 (0.02, 0.5)### | 0.7 (0.3, 1.5)### | 0.3 (0.1, 1.0) | 0.1 (0.0, 0.4)*** | 0.2 (0.05, 0.4)*** |
| Secondary care hospitalization days (length of stay) | |||||
| Mean (SD) | 4.7 (14.3)### | 21.5 (49.5)### | 11.9 (35.1) | 4.5 (19.1)*** | 3.6 (11.9)*** |
| Median (Q1, Q3) | 0.2 (0.0, 2.6)### | 3.3 (1.1, 16.5)### | 1.2 (0.2, 7.8) | 0.2 (0.0, 1.6)*** | 0.4 (0.0, 1.9)*** |
| Secondary care ER visits | |||||
| n (%) | 54 (33.1%)# | 26 (21.1%)# | 80 (28.0%) | 847 (29.8%) | 966 (35.1%) |
| Mean (SD) | 0.06 (0.2) | 0.04 (0.1) | 0.06 (0.1) | 0.05 (0.1) | 0.05 (0.1) |
| Median (Q1, Q3) | 0.0 (0.0, 0.07) | 0.0 (0.0, 0.0) | 0.0 (0.0, 0.05) | 0.0 (0.0, 0.05) | 0.0 (0.0, 0.06) |
| ICU admissions1 | |||||
| n (%) | 10 (6.1%) | 11 (8.9%) | 21 (7.3%) | 93 (3.3%)** | 108 (3.9%)* |
| Mean (SD) | 0.01 (0.1) | 0.02 (0.1) | 0.02 (0.1) | 0.01 (0.1) | 0.02 (0.5) |
| Median (Q1, Q3) | 0.0 (0.0, 0.0) | 0.0 (0.0, 0.0) | 0.0 (0.0, 0.0) | 0.0 (0., 0.00) | 0.0 (0.0, 0.0) |
| ICU days (length of stay)1 | |||||
| Mean (SD) | 0.03 (0.2) | 0.2 (1.0) | 0.1 (0.7) | 0.03 (0.4)* | 0.03 (0.3)* |
| Median (Q1, Q3) | 0.0 (0.0, 0.0) | 0.0 (0.0, 0.0) | 0.00 (0.0, 0.0) | 0.0 (0.0, 0.0)* | 0.0 (0.0, 0.0)* |
| All values are per patient per year. 1Low coverage, as ICU recordings in the Care Register of Health Care started in 2019. #p < 0.05, ##p < 0.01, ###p < 0.001 between the groups “without GPP flares” and “> 1 GPP flare”. *p < 0.05, **p < 0.01, ***p < 0.001 between GPP and the population-based/PV control group. ER: emergency room; GPP: generalized pustular psoriasis; HCRU: healthcare resource utilization; ICU: intensive care unit; PV: psoriasis vulgaris; Q: quartile; SD: standard deviation. |
|||||
For GPP patients with flares the mean total number of all-cause healthcare contacts was 2-fold higher (2.4; SD, 4.9) than for those without flares (1.2; SD, 2.5; p < 0.01). Again, the difference between the groups was most prominent for hospitalizations, with 3.2-fold higher mean rate in patients with flares (1.9; SD 4.5) vs without (0.6; SD, 1.5; p < 0.001).
Direct medical costs
The mean total all-cause direct costs of GPP patients were €10,323 PPPY (SD, €20,440), i.e., 3-fold higher compared with the population-based (€3,345; SD, €9,630; p < 0.001) and PV controls (€3,569; SD, €10,134; p < 0.001) (Fig. 1A, Table SIII). One-third (33.7%) of the total direct costs were GPP-related (€3,474; SD, €13,128) (Table SIV). Among the cost components, hospitalization costs dominated, being 3-fold higher in GPP (€7,011; SD, €19,567) compared with both population-based (€2,431; SD, €9,489; p < 0.001) and PV controls (€2,275; SD, €9,489; p < 0.001) (Fig. 1B). The mean costs for selected medications in GPP were 4.6-fold higher (€2,550; SD, €3,293) than in population-based controls (€554; SD, €1,175; p < 0.001), and 2.9-fold higher than in PV (€875; SD, €1,622; p < 0.001) (Fig. 1A).
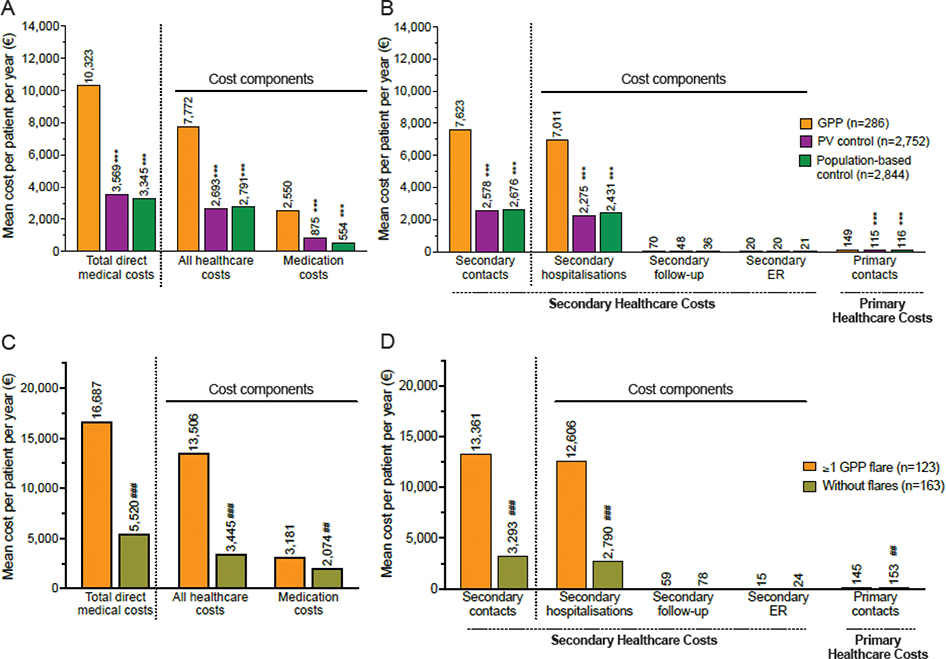
Fig. 1. All-cause direct medical costs (primary and secondary healthcare and medications1) of generalized pustular psoriasis (GPP) over the different cost components during follow-up. Mean direct costs of GPP patients and comparison with population-based and psoriasis vulgaris (PV) control groups for: (A) the total costs and main cost components, and (B) the healthcare contact types. Mean direct costs of GPP patients with and without flares for: (C) the total costs and main cost components, and (D) the healthcare contact types. All costs are per patient per year. ***p < 0.001 between GPP and the population-based/PV control group. ##p < 0.01, ###p < 0.001 between the groups “without GPP flares” and “>1 GPP flare”. 1Medications listed in Table SI were included. ER: emergency room.
Among GPP patients with flares, the mean total all-cause direct costs were 3-fold higher (€16,687 PPPY; SD, €28,580) than among patients without flares (€5,520; SD, €8,120; p < 0.001) (Fig. 1C, Table SIII). Also, the assessment of association between flares and direct costs by the age- and sex-adjusted negative binomial model indicated that flares were associated with 2.7-fold higher costs (CR, 2.7; 95% CI, 2.1–3.5; p < 0.001) compared with without flares (Fig. 2A). Again, the most substantial difference in cost types between the groups was in hospitalizations, which were 4.5-fold higher in patients with flares (€12,606; SD, €27,910) than in those without (€2,790; SD, €6,726; p < 0.001) (Fig. 1D). Also, the proportion of hospitalizations of the total direct costs was higher in patients with flares (75.6%) than in patients without (50.5%). The selected medication costs were 1.5-fold higher in patients with flares (€3,181; SD, €3,509) vs without (€2,074; SD, €3,045; p < 0.01) (see Fig. 1C).
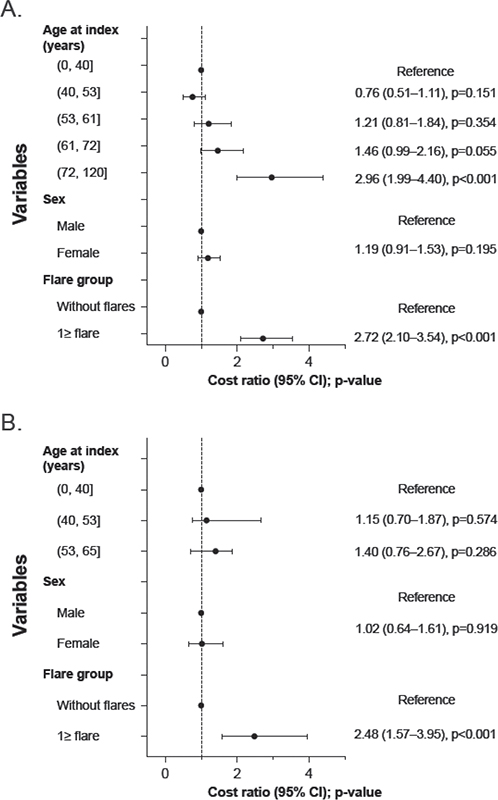
Fig. 2. Association, including cost ratios (CRs) and 95% confidence intervals (CIs), of generalized pustular psoriasis (GPP) flares, sex, and age for: (A) direct costs, and (B) indirect costs. Both were estimated using a negative binomial model and are shown for the total population.
Social benefits and indirect costs
The proportion of individuals with social benefits was higher in GPP (37.1%) compared with population-based controls (30.4%, p < 0.01), but not with PV (40.2%) (Table II). The proportion of patients with disability pensions, however, was significantly higher in GPP (6.3%) compared with both population-based (2.3%, p < 0.001) and PV controls (3.9%, p < 0.05). Also, the mean length of rehabilitation periods in GPP was 4.3-fold higher (11.7 days PPPY; SD, 32.5) compared with PV (2.7; SD, 8.2; p < 0.05), even though in the working-age population the difference was not statistically significant (Table SV). The mean length of sick leaves was higher in GPP (19.5; SD, 17.7) than in population-based controls (15.6; SD, 17.8; p < 0.05) but not PV (18.3; SD, 23.8).
| GPP1 | Matched controls | ||||
| Without flares (n = 163) | ≥ 1 flare (n = 123) | All (n = 286) | Population control (n = 2,844) | PV control (n = 2,752) | |
| Total recipients, n (%) | 61 (37.4%) | 45 (36.6%) | 106 (37.1%) | 865 (30.4%)** | 1,107 (40.2%) |
| Disability pension | |||||
| n (%) | < 51 | < 51 | 18 (6.3%) | 64 (2.3%)*** | 106 (3.9%)* |
| Number of days, mean (SD)2 | < 5 | < 5 | 140.8 (100.8) | 109.4 (77.5) | 121.9 (88.5) |
| Number of days, median (Q1, Q3)2 | < 5 | < 5 | 150.8 (43.8, 195.1) | 96.9 (51.0, 145.4) | 107.6 (54.4, 152.0) |
| Rehabilitation periods | |||||
| n (%) | 8 (4.9%) | 11 (8.9%) | 19 (6.6%) | 164 (5.8%) | 257 (9.3%) |
| Number of days, mean (SD)2 | 18.4 (49.2) | 6.8 (11.9) | 11.7 (32.5) | 2.9 (11.8) | 2.7 (8.2)* |
| Number of days, median (Q1, Q3)2 | 0.6 (0.4, 2.5) | 1.78 (1.4, 2.5) | 1.5 (0.6, 2.6) | 1.0 (0.5, 1.7) | 1.1 (0.5, 2.0)* |
| Long sick leaves (> 10 days) | |||||
| n (%) | 58 (35.6%) | 40 (32.5%) | 98 (34.3%) | 821 (28.9%)* | 1,068 (38.8%) |
| Number of days, mean (SD)2 | 18.6 (17.2) | 205 (18.48) | 19.5 (17.7) | 15.6 (17.8)* | 18.3 (23.8) |
| Number of days, median (Q1, Q3)2 | 13.4 (6.0, 26.4) | 15.8 (7.2, 31.9) | 13.4 (6.9, 27.4) | 8.4 (3.3, 22.6)* | 10.9 (3.6, 25.1) |
| All values are per patient per year. #p < 0.05, ##p < 0.01, ###p < 0.001 between the groups “without GPP flares” and “> 1 GPP flare”. *p < 0.05, **p < 0.01, ***p < 0.001 between GPP and the population-based/PV control group. 1Data cannot be shown due to data masking rules if either “yes” or “no” for any given variable is < 5, or if n < 5 in one of the groups being compared. 2Presented for individuals with ≥ 1 event. GPP: generalized pustular psoriasis; PV: psoriasis vulgaris; Q: quartile; SD: standard deviation. |
|||||
The mean total indirect costs for GPP were €1,526 PPPY (SD, €4,332), being 2.1-fold higher than in population-based controls (€697; SD, €2,443; p < 0.001), but not significantly different from PV (€1,204; SD, €3,688) (Fig. 3A, Table SVI). Among the cost components, disability pensions were the main driver of the higher indirect costs, as they were 3.4-fold higher in GPP (€796; SD, €3,839) vs the population-based controls (€234; SD, €1,931; p < 0.001). Disability pensions also comprised a higher proportion of the total indirect costs in GPP (52.2%) vs population-based (33.6%) and PV controls (38.5%).
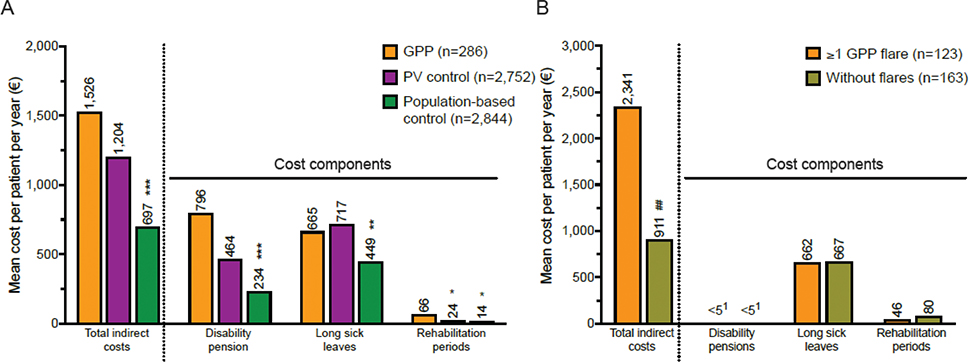
Fig. 3. All-cause indirect costs of generalized pustular psoriasis (GPP) over the different cost components during the follow-up. Mean indirect costs for: (A) GPP patients and comparison with population-based and psoriasis vulgaris (PV) control groups, and (B) GPP patients with and without flares1. All costs are per patient per year. *p<0.05, **p< 0.01, ***p<0.001 between GPP and the population-based/PV control group. ##p<0.01 between the groups “without GPP flares” and “≥ 1 GPP flare”. 1Data for disability pensions cannot be shown for either group due to data masking rules.
GPP patients with flares had 2.6-fold higher mean total indirect costs (€2,341 PPPY; SD, €5,954) than patients without flares (€911; SD, €2,332; p < 0.01) (Fig. 3B, Table SVI). The age- and sex-adjusted cost modelling also indicated that having flares was associated with 2.5-fold higher indirect costs compared with no flares (CR, 2.5; 95% CI, 1.6–4.0; p < 0.001) (see Fig. 2B).
The observed differences between the groups were similar in working-age populations (Fig. S1, Table SVII).
Total all-cause costs
The mean total costs (direct medical and indirect costs) in GPP were 3-fold higher (€11,849 PPPY; SD, €20,562) than in population-based controls (€4,042; SD, €9,956; p < 0.001) and 2.5-fold higher than in PV (€4,773; SD, €10,842; p < 0.001) (Fig. 4A). Indirect costs constituted 12.8% of the total costs in GPP, 25.2% in PV and 17.2% in population-based controls. In the working-age population, the proportion of the indirect costs approximately doubled to 26.1% in GPP, 42.0% in PV, and 39.7% in population-based controls (Fig. 4B).
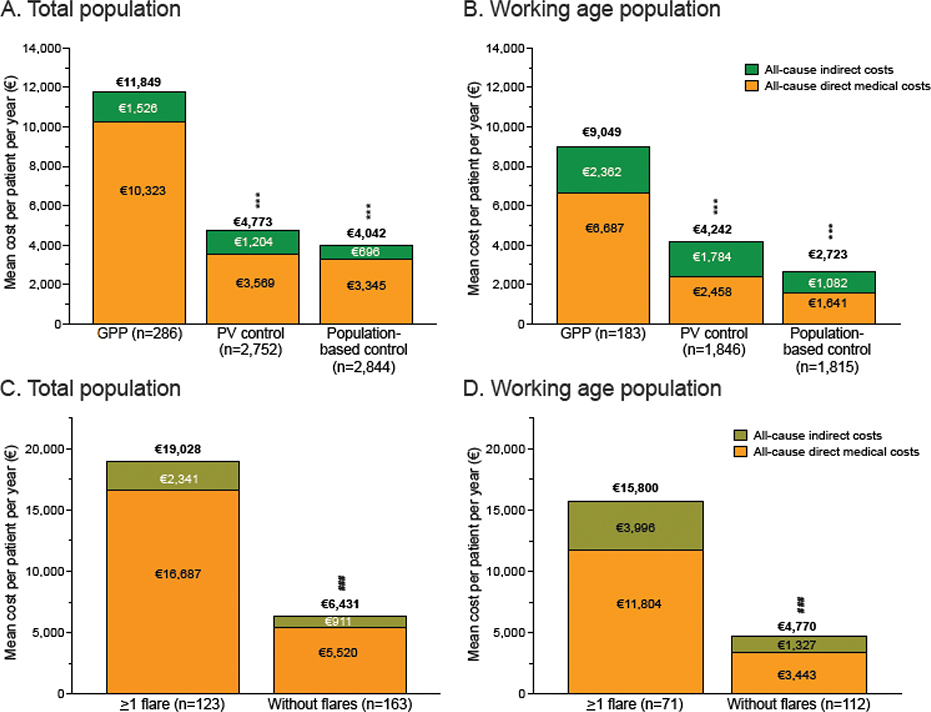
Fig. 4. Total costs (all-cause direct medical + indirect costs) of generalized pustular psoriasis (GPP). Mean total costs of GPP patients and comparison with population-based and psoriasis vulgaris (PV) control groups for: (A) the total population, and (B) the working age (<65 years) population. Mean total costs of GPP patients with and without flares for: (C) total population, and (D) the working age (<65 years) population. All costs are per patient per year. ***p<0.001 between GPP and the population-based/PV control group. ###p<0.01 between the groups “without GPP flares” and “>1 GPP flare”.
In GPP, the mean total costs of patients with flares (€19,028; SD, €28,352) were 3-fold higher compared with patients without flares (€6,431; SD, €8,354; p < 0.001) (Fig. 4C). The contribution of indirect costs to total costs was similar in patients with (12.3%) and without (14.2%) flares. The proportion of indirect costs approximately doubled in the working-age population (25.3% in patients with flares, 27.8% without) (Fig. 4D).
DISCUSSION
This Finnish population-based register study represents the first comprehensive evaluation of both direct medical and indirect costs of GPP, including patients with and without flares. The results indicated significantly higher total costs in GPP (€11,849 PPPY) compared with the general population (€4,042) and PV (€4,773). Among direct costs the hospitalizations and among indirect costs the disability pensions were the main cost drivers. After adjusting for age and sex, having flares was associated with 2.7-fold and 2.5-fold higher direct and indirect costs, respectively. Considering the chronic, relapsing nature of the disease, the findings underline the substantial economic impact of GPP, driven by the progressive accumulation of costs over time.
We found that GPP patients had twice the mean HCRU rates and 3 times higher total direct medical costs compared with both control groups, primarily driven by substantially higher (3-fold) hospitalization rates. Others have reported 1.1–1.7 times higher secondary care outpatient visit rates, 1.1–2 times higher hospitalization rates and 1.5–5 times longer stays for GPP vs PV (10, 22, 23, 33). In addition, 1.2–1.9 times higher total direct costs, and 1.1–1.8-fold higher hospitalization costs were reported in GPP vs PV (20, 22, 23, 33). Also, medication costs in Finland were 2.9 times higher in GPP than PV, compared with 2.2-fold differences in Sweden and Japan (22, 23). A plausible explanation for the somewhat higher HCRU rates and direct medical costs observed here is that the stricter case criteria used may result in selection of more severe GPP cases with higher HCRU rates and costs. Furthermore, varying recording practices between countries impede direct comparisons, and medications evaluated vary between the studies. The proportion of GPP patients with primary care contacts was lower than PV, showing that PV treatment mostly occurs within primary care, whereas GPP is treated in hospitals.
In addition to direct medical costs, it is crucial to include indirect costs in analysing the economic burden to capture the broader impact (34, 35). Total indirect costs were twice as high in GPP as in population-based controls, but not significantly different from PV. This is explained by longer sick leaves (>10 days) in GPP compared with population-based controls, but not PV. In contrast, a Swedish report showed that a higher proportion of GPP patients had sick leaves (>14 days) during the year of the first diagnosis and the leaves were longer in GPP than in PV (25). As our analysis covered the entire follow-up, potential timing effects of GPP diagnosis on sick-leave patterns would be undetected. Notably, disability pensions were the main driver of indirect costs of GPP. They were over 3 times higher than in population-based controls and appeared higher than in PV. This is of particular importance, as returning to work after temporary disability pension has been reported to be rare, and long-term disability can lead to significant cumulative costs (36).
Evidence comparing HCRU rates in GPP patients with and without flare remains limited, and no prior reports compare direct and indirect costs. In Finland, healthcare contacts were twice as frequent in patients with flares. As most patients with flares are hospitalized (3, 4, 8,10, 24), a higher healthcare burden is expected. In the United States, hospitalizations were 3 times more common, and ER visits 2 times more common, in patients with flares; in the UK both outpatient and ER visit rates increased with flares (10, 27). Importantly, we observed flares were associated with 2.7 times higher direct costs and 2.5 times higher indirect costs, indicating a significant impact on work ability. Given the episodic nature of GPP (4, 24), it is consistent that the indirect costs peak during flare episodes.
The higher total economic burden of GPP (€11,849 PPPY) compared with controls (PV, €4,773; population-based, $4,402) likely reflects the greater disease severity, flare episodes (here affecting 43.0% of cases), and the need for long-term management (2, 4, 8, 10, 15, 27, 37). The high overall costs of GPP, and the cost peaks during GPP flares (€19,028), suggest that both appropriate maintenance treatment and flare prevention through effective treatment strategies may reduce overall costs. At the time of the study, no GPP-specific reimbursed medications were available in Finland, and future research should explore the long-term economic impact of newer therapies.
The main strengths of this study are the population-based cohort, matched controls, and analysis of both direct and indirect costs allowing a comprehensive economic analysis of GPP. Limitations include validity of ICD-10 codes in identification of GPP patients (mitigated by requiring >2 GPP diagnoses at a dermatology clinic). Also, not all medications used were covered and short sick leaves (<10 days) were missing. Including all patients regardless of follow-up length may have led to an overestimation of mean values caused by persons with a high initial frequency of healthcare contacts.
In conclusion, this first evaluation of GPP’s economic burden in Finland highlights the substantial direct and indirect costs, particularly those linked to flares. These findings emphasize the need for early diagnosis and effective management to reduce the frequency and severity of flares, as well as the chronic manifestations of GPP, thereby alleviating the cost burden on the healthcare system and the total societal burden.
ACKNOWLEDGEMENTS
Harlan Barker (MedEngine Oy) is acknowledged for language review and Mónica Ferreira (MedEngine Oy) for medical writing support.
IRB approval status: This study was approved by the Finnish Social and Health Data Permit Authority, Findata, with the approval number THL/1425/14.02.00/2022. Informed consent or review and/or approval by an ethics committee was not required because according to Finnish legislation (Act on the Secondary Use of Health and Social Data (552/2019) by the Ministry of Social Affairs and Health), the patients included in the study cohort were not contacted, and the study did not affect the treatment of the patients. The study was conducted in accordance with the Helsinki Declaration of 1975, Good Pharmacoepidemiology Practices, and Data Protection Directive.
REFERENCES
- Boehner A, Navarini AA, Eyerich K. Generalized pustular psoriasis: a model disease for specific targeted immunotherapy, systematic review. Exp Dermatol 2018; 27: 1067–1077. https://doi.org/10.1111/exd.13699
- Takeichi T, Akiyama M. Generalized pustular psoriasis: clinical management and update on autoinflammatory aspects. Am J Clin Dermatol 2020; 21: 227–236. https://doi.org/10.1007/s40257-019-00492-0
- Choon SE, Lai NM, Mohammad NA, Nanu NM, Tey KE, Chew SF. Clinical profile, morbidity, and outcome of adult-onset generalized pustular psoriasis: analysis of 102 cases seen in a tertiary hospital in Johor, Malaysia. Int J Dermatol 2014; 53: 676–684. https://doi.org/10.1111/ijd.12070
- Choon SE, Navarini AA, Pinter A. Clinical course and characteristics of generalized pustular psoriasis. Am J Clin Dermatol 2022; 23: 21–29. https://doi.org/10.1007/s40257-021-00654-z
- Kharawala S, Golembesky AK, Bohn RL, Esser D. The clinical, humanistic, and economic burden of palmoplantar pustulosis: a structured review. Expert Rev Clin Immunol 2020; 16: 253–266. https://doi.org/10.1080/1744666X.2019.1708194
- Miyachi H, Konishi T, Kumazawa R, Matsui H, Shimizu S, Fushimi K, et al. Treatments and outcomes of generalized pustular psoriasis: a cohort of 1516 patients in a nationwide inpatient database in Japan. J Am Acad Dermatol 2022; 86: 1266–1274. https://doi.org/10.1016/j.jaad.2021.06.008
- Löfvendahl S, Norlin JM, Schmitt-Egenolf M. Prevalence and incidence of generalized pustular psoriasis in Sweden: a population-based register study. Br J Dermatol 2022; 186: 970–976. https://doi.org/10.1111/bjd.20966
- Viguier M, Bentayeb M, Azzi J, de Pouvourville G, Gloede T, Langellier B, et al. Generalized pustular psoriasis: a nationwide population-based study using the National Health Data System in France. J Eur Acad Dermatol Venereol 2024; 38: 1131–1119. https://doi.org/10.1111/jdv.19901
- Haugaard JH, Thein D, Egeberg A. Prevalence and incidence of patients with generalized pustular psoriasis in Denmark: a nationwide registry-based study. JEADV Clinical Practice 2023; 2: 893–900. https://doi.org/10.1002/jvc2.233
- Frysz M, Patel S, Li M, Griffiths C, Warren R, Ashcroft D. Prevalence, incidence, mortality and healthcare resource use for generalized pustular psoriasis, palmoplantar pustulosis and plaque psoriasis in England: a population-based cohort study. Br J Dermatol 2024; 191: 529–538. https://doi.org/10.1093/bjd/ljae217
- Prinz JC, Choon SE, Griffiths CEM, Merola JF, Morita A, Ashcroft DM, et al. Prevalence, comorbidities and mortality of generalized pustular psoriasis: a literature review. J Eur Acad Dermatol Venereol 2023; 37: 256–273. https://doi.org/10.1111/jdv.18720
- Ericson O, Löfvendahl S, Norlin JM, Gyllensvärd H, Schmitt-Egenolf M. Mortality in generalized pustular psoriasis: a population-based national register study. J Am Acad Dermatol 2023; 89: 616–629. https://doi.org/10.1016/j.jaad.2023.04.066
- Sugiura K, Takemoto A, Yamaguchi M, Takahashi H, Shoda Y, Mitsuma T, et al. The majority of generalized pustular psoriasis without psoriasis vulgaris is caused by deficiency of interleukin-36 receptor antagonist. J Invest Dermatol 2013; 133: 2514–2521. https://doi.org/10.1038/jid.2013.230
- Bachelez H, Choon SE, Marrakchi S, Burden AD, Tsai TF, Morita A, et al. Trial of spesolimab for generalized pustular psoriasis. N Engl J Med 2021; 385: 2431–2440. https://doi.org/10.1056/NEJMoa2111563
- Krueger J, Puig L, Thaçi D. Treatment options and goals for patients with generalized pustular psoriasis. Am J Clin Dermatol 2022; 23: 51–64. https://doi.org/10.1007/s40257-021-00658-9
- Navarini AA, Prinz JC, Morita A, Tsai TF, Viguier MA, Li L, et al. Spesolimab improves patient-reported outcomes in patients with generalized pustular psoriasis: results from the Effisayil 1 study. J Eur Acad Dermatol Venereol 2023; 37: 730–736. https://doi.org/10.1111/jdv.18820
- Elewski BE, Lebwohl MG, Anadkat MJ, Barker J, Ghoreschi K, Imafuku S, et al. Rapid and sustained improvements in Generalized Pustular Psoriasis Physician Global Assessment scores with spesolimab for treatment of generalized pustular psoriasis flares in the randomized, placebo-controlled Effisayil 1 study. J Am Acad Dermatol 2023; 89: 36–44. https://doi.org/10.1016/j.jaad.2023.02.040
- Morita A, Strober B, Burden AD, Choon SE, Anadkat MJ, Marrakchi S, et al. Efficacy and safety of subcutaneous spesolimab for the prevention of generalised pustular psoriasis flares (Effisayil 2): an international, multicentre, randomised, placebo-controlled trial. Lancet 2023; 402: 1541–1551. https://doi.org/10.1016/S0140-6736(23)01378-8
- Warren RB, Reich A, Kaszuba A, Placek W, Griffiths CEM, Zhou J, et al. Imsidolimab, an anti-interleukin-36 receptor monoclonal antibody, for the treatment of generalized pustular psoriasis: results from the phase II GALLOP trial. Br J Dermatol 2023; 189: 161–169. https://doi.org/10.1093/bjd/ljad083
- Hanna ML, Singer D, Valdecantos WC. Economic burden of generalized pustular psoriasis and palmoplantar pustulosis in the United States. Curr Med Res Opin 2021; 37: 735–742. https://doi.org/10.1080/03007995.2021.1894108
- Tarride JE, Prajapati VH, Lynde C, Blackhouse G. The burden of palmoplantar pustulosis: aa Canadian population-based study of inpatient care, emergency departments, and outpatient clinics. JAAD Int 2023; 12: 151–159. https://doi.org/10.1016/j.jdin.2023.04.002
- Morita A, Kotowsky N, Gao R, Shimizu R, Okubo Y. Patient characteristics and burden of disease in Japanese patients with generalized pustular psoriasis: results from the Medical Data Vision claims database. J Dermatol 2021; 48: 1463–1473. https://doi.org/10.1111/1346-8138.16022
- Löfvendahl S, Norlin JM, Schmitt-Egenolf M. Economic burden of generalized pustular psoriasis in Sweden: a population-based register study. Psoriasis 2022; 12: 89–98. https://doi.org/10.2147/PTT.S359011
- Wolf P, Ceovic R, Conrad C, Falkensteiner K, Graier T, Kołt-Kamińska M, et al. Characteristics and management of generalized pustular psoriasis (GPP): experience from the Central and Eastern Europe (CEE) GPP Expert Network. J Eur Acad Dermatol Venereol 2024; 38: 1531–1542. https://doi.org/10.1111/jdv.19808
- Löfvendahl S, Norlin JM, Ericson O, Hanno M, Schmitt-Egenolf M. Prolonged sick leave before and after diagnosis of generalized pustular psoriasis: a Swedish population-based register study. Acta Derm Venereol 2023; 103: adv6497. https://doi.org/10.2340/actadv.v103.6497
- Hanna M, Singer D, Tang W, Zhou J, Macaulay D, Valdecantos WC, et al. PRO41 indirect burden of illness in patients with generalized pustular psoriasis in the United States. Value in Health 2020; 23: S696–697. https://doi.org/10.1016/j.jval.2020.08.1777
- Zema CL, Valdecantos WC, Weiss J, Krebs B, Menter AM. Understanding flares in patients with generalized pustular psoriasis documented in US Electronic Health Records. JAMA Dermatol 2022; 158: 1142–1148. https://doi.org/10.1001/jamadermatol.2022.3142
- Kapiainen S, Väisänen A, Haula T. Terveyden-ja sosiaalihuollon yksikkökustannukset Suomessa vuonna 2011 [Internet] 2014. Available from: http://urn.fi/URN: ISBN: 978-952-302-079-5
- Hanly P, Timmons A, Walsh PM, Sharp L. Breast and prostate cancer productivity costs: a comparison of the human capital approach and the friction cost approach. Value in Health 2012; 15: 429–436. https://doi.org/10.1016/j.jval.2011.12.012
- Tilastokeskus. Tulorekisterin palkat ja palkkiotulot kuukausittain sukupuolen ja ikäryhmän mukaan muuttujina Kuukausi, Sukupuoli, Tulonsaajaryhmä, Ikäluokka, Tuloluokka, Tuloerä ja Tiedot [Internet]. PxWeb [cited 2024 Jan 15]. Available from: https://pxdata.stat.fi:443/PxWebPxWeb/pxweb/fi/Kokeelliset_tilastot/Kokeelliset_tilastot__trek/koeti_trek_pxt_131w_fi.px/
- Kuo CL, Duan Y, Grady J. Unconditional or conditional logistic regression model for age-matched case-control data? Front Public Health 2018; 6: 57. https://doi.org/10.3389/fpubh.2018.00057
- Koivusalo M, Teitsma X, Mehtälä J, Vesikansa A, Capion SC, Airaksinen L, et al. Epidemiology, clinical characteristics, flares and mortality of generalized pustular psoriasis: a nationwide register study in Finland. Skin Health and Disease 2025; 5: 432–442. https://doi.org/10.1093/skinhd/vzaf076
- Tarride JE, Prajapati VH, Lynde C, Blackhouse G. The burden associated with generalized pustular psoriasis: a Canadian population-based study of inpatient care, emergency departments, and hospital- or community-based outpatient clinics. JAAD Int 2023; 12: 90–98. https://doi.org/10.1016/j.jdin.2023.03.012
- Jo C. Cost-of-illness studies: concepts, scopes, and methods. Clin Mol Hepatol 2014; 20: 327. https://doi.org/10.3350/cmh.2014.20.4.327
- Yang G, Cintina I, Pariser A, Oehrlein E, Sullivan J, Kennedy A. The national economic burden of rare disease in the United States in 2019. Orphanet J Rare Dis 2022; 17: 163. https://doi.org/10.1186/s13023-022-02299-5
- Laaksonen M, Gould R. Return to work after temporary disability pension in Finland. J Occup Rehabil 2015; 25: 471–480. https://doi.org/10.1007/s10926-014-9554-1
- Fujita H, Gooderham M, Romiti R. Diagnosis of generalized pustular psoriasis. Am J Clin Dermatol 2022; 23: 31–38. https://doi.org/10.1007/s40257-021-00652-1