ORIGINAL REPORT
Efficacy and Safety of Xeligekimab Compared to Other IL-17A Inhibitors for Chinese Patients with Moderate-to-severe Plaque Psoriasis: A Matching-adjusted Indirect Comparisons
Yangfeng DING1 and Weida LIU2*![]()
1Shanghai Skin Disease Hospital, Tongji University School of Medicine, 1278 Baode Road, Shanghai, China, and 2Peking Union Medical College Hospital, Beijing, China
Corr: Weida Liu, Peking Union Medical College Hospital, State Key Laboratory for Complex Severe and Rare Diseases, Institute of Clinical Medicine, Chinese Academy of Medical Sciences, 100730, Beijing, China. *Email: liuweidal123456@163.com
Key words: Xeligekimab; IL-17Ainhibitors; matching-adjusted indirect comparison; Chinese population; plaque psoriasis; long-term efficacy.
Citation: Acta Derm Venereol 2026; 106: adv-2025-0183. DOI: https://doi.org/10.2340/actadv.v106.adv-2025-0183.
Copyright: © 2026 The Author(s). Published by MJS Publishing, on behalf of the Society for Publication of Acta Dermato-Venereologica. This is an Open Access article distributed under the terms of the Creative Commons Attribution-NonCommercial 4.0 International License (https://creativecommons.org/licenses/by-nc/4.0/).
Submitted: Nov 14, 2025. Accepted after revision: Mar 24, 2026.
Published: Apr 16, 2026.
Competing interests and funding: The authors have no conflicts of interest to declare.
No funding was received for this study.
The individual patient data from the Xeligekimab trial used in this analysis are available from the corresponding author upon reasonable request. Aggregate data from comparator trials (Secukinumab and Ixekizumab) were extracted from published literature as cited. The R code for MAIC analyses is available upon request to ensure reproducibility.
This analysis is based on previously conducted studies and does not contain data from new studies with human participants; therefore, ethical approval was not required.
Direct comparative evidence between IL-17A inhibitors for plaque psoriasis in Chinese populations remains limited. This study evaluated the comparative effectiveness of Xeligekimab vs Secukinumab and Ixekizumab through matching-adjusted indirect comparisons (MAICs). Individual patient data from the Xeligekimab trial (N=281) were weighted to match baseline characteristics from Chinese trials of Secukinumab (N=221) and Ixekizumab (N=176/92). Matching variables were determined following NICE and EUnetHTA MAIC guidelines, incorporating prognostic factors identified through multivariate regression. Primary endpoints included PASI 75/90/100 achievement at weeks 12, 52 and 60. At week 12, Secukinumab showed numerically higher PASI 75 (97.7% vs 93.0%, p=0.052) without statistical significance, while other endpoints were comparable (all p>0.05). At week 52, Xeligekimab showed significantly higher PASI 100 achievement (57.8% vs 42.1%, p=0.005) and DLQI 0/1 (68.8% vs 47.5%, p<0.001) vs Secukinumab. At week 60, Xeligekimab maintained significantly higher PASI 75 vs Ixekizumab (92.6% vs 76.1%, p<0.001) with lower infection rates during induction period (7.9% vs 34.7%, p<0.001) and maintenance period (22.4% vs 56.5%, p<0.001). This MAIC provides hypothesis-generating evidence that Xeligekimab may offer advantages in specific long-term efficacy endpoints and safety outcomes, requiring confirmation in direct randomized controlled trials.
Significance
IL-17A inhibitors have demonstrated robust efficacy in plaque psoriasis, but comparative evidence among these agents is lacking in Chinese populations, particularly for the recently approved Xeligekimab, limiting evidence-based treatment selection.
Addressing this gap through matching-adjusted indirect comparison in Chinese patients, this study reveals differential temporal patterns. While 12-week responses were comparable (with Secukinumab showing numerically higher PASI 75 without significance), Xeligekimab showed statistically significant advantages in specific endpoints at weeks 52–60 vs Secukinumab (PASI 100 : 57.8 % vs 42.1%, p=0.005) and Ixekizumab (PASI 75 : 92.6 % vs 76.1%, p<0.001) at weeks 52–60. Xeligekimab demonstrated notably lower infection rates, particularly relevant for tuberculosis-endemic China, alongside sustained quality-of-life benefits.
Plaque psoriasis affects over 6 million Chinese individuals with distinct clinical characteristics including lower mean body weight compared to Western populations, higher scalp involvement and pronounced psychosocial burden with employment discrimination affecting 32.3 % of patients (1, 2). Maintaining long-term efficacy remains challenging, with 50–90% requiring systemic retreatment within 12 months of treatment withdrawal (3, 4). Consequently, rather than relying predominantly on Western trial data, optimized therapeutic strategies tailored to Chinese patients are essential and required considering this substantial disease burden, combined with frequent relapse patterns.
Given that the IL-17A pathway represents a central therapeutic target, IL-17A inhibitors have been applied extensively with superior efficacy demonstrated compared to conventional biologics (5). Four IL-17A inhibitors, i.e., Secukinumab and Ixekizumab (2019) (6), followed by domestically developed Xeligekimab (2024) (7) and Vunakizumab (2024) (8), have gained approval in China. Among these, Secukinumab and Ixekizumab represent the most established agents with published long-term Chinese population-specific trial data. While these biologics have revealed robust short-term efficacy in individual pivotal trials, with week 12 Psoriasis Area and Severity Index (PASI) 75 rates ranging from 87–97%, the primary reason for the discontinuation of these agents is the loss of efficacy over time (68.5%), and evidence-based treatment selection is largely restricted owing to the lack of head-to-head comparisons (9).
Matching-adjusted indirect comparison (MAIC) represents a validated methodology to provide comparative effectiveness evidence when direct trials are unavailable (10). This study employed MAIC to compare Xeligekimab with established IL-17A inhibitors using individual patient data (IPD) from the Xeligekimab phase 3 trial and published aggregate data (AGD) from comparator trials.
MATERIALS AND METHODS
Patients population
All trials were conducted exclusively in Chinese populations to ensure ethnic homogeneity and enhance clinical relevance for Chinese practice.
The IPD was obtained from a Chinese phase 3 randomized controlled trial of Xeligekimab (N=281) that enrolled Chinese adults with PASI≥12, Physician’s Global Assessment (PGA)≥3 and body surface area (BSA) involvement≥10% (11). IPD access was granted through collaboration with the trial sponsor (Chongqing Genrix Biopharmaceutical Co., Ltd.) under a data-sharing agreement. Patient-level data included baseline demographics, disease characteristics, efficacy outcomes and safety events.
The AGD was systematically identified from pivotal phase 3 trials conducted in Chinese populations with comparable eligibility criteria. The details for the comparator trials from China were described as follows: Secukinumab CAIN457F2310 trial (300 mg cohort, n=221) (12), and Ixekizumab UNCOVER-1 trial [160 mg for starting dose and 80 mg every 2 weeks (Q2W) induction, n=176; Q4W 80 mg every 4 weeks (Q4W/Q4W) maintenance, n=92] (13). (Fig. 1).
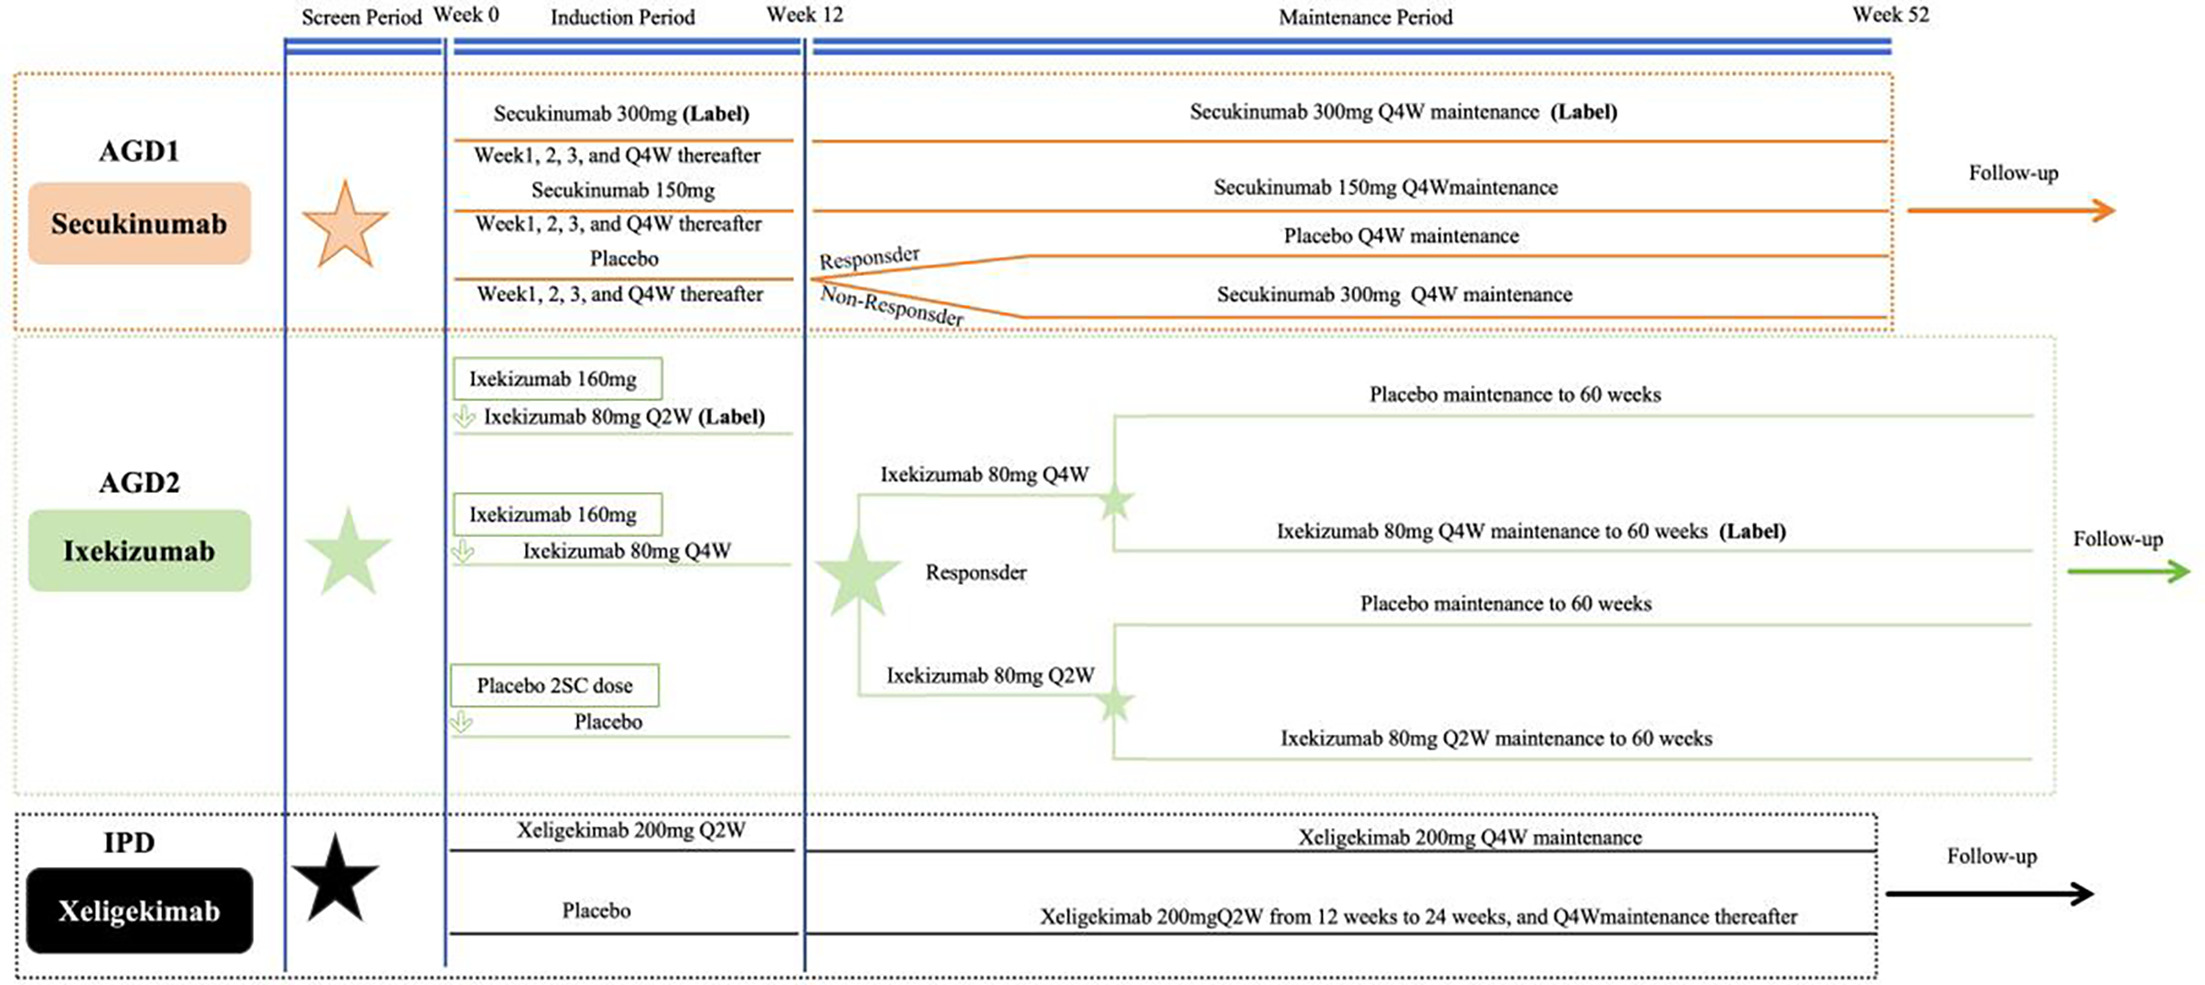
Fig. 1. Study design schematic and patient flow of the included randomized controlled trials in the MAIC. AGD = aggregate data; IPD = individual patient data; Q2W = every 2 weeks; Q4W = every 4 weeks; and ⋆ Randomization. The maintenance period efficacy comparisons between Xeligekimab and Ixekizumab were evaluated at 60 weeks.
All AGD were extracted from peer-reviewed publications available in the public domain, including baseline characteristics, efficacy endpoints (PASI 75/90/100, PGA 0/1, DLQI) and safety outcomes. Supplementary materials and trial registries were consulted to verify data completeness and consistency.
According to the regulatory labeling for moderate-to-severe psoriasis in China, the approved 300 mg dosing regimen was determined for Secukinumab (14). For Ixekizumab, the Q2W induction regimen and the Q4W/Q4W maintenance regimen were used for week 12 comparisons and week 60 comparisons, respectively (15) (Fig. 1).
To ensure reproducibility, all statistical code and weighting algorithms are available from the corresponding author upon reasonable request. AGD sources are fully referenced and publicly accessible.
Identification of prognostic factors
Following NICE Decision Support Unit Technical Support Document 18 and European Network for Health Technology Assessment (EUnetHTA) guidelines for population-adjusted indirect comparisons (16, 17), a systematic approach integrating clinical expertise and empirical analysis was used to determine the baseline characteristics for matching. Six candidate variables known to influence treatment response in plaque psoriasis were evaluated, including age, sex, body weight, baseline PASI score, baseline BSA involvement and PGA score of 4 proportion. Using week 12 PASI 75 achievement as the outcome in Xeligekimab-treated patients, univariate and multivariate logistic regression analyses were performed to identify prognostic factors (Table SI). The matching process involved variables demonstrating statistical significance (p<0.05) or recognized clinical importance based on expert consultation.
Based on data availability in published reports, the final set of matching variables differed across comparators. For secukinumab: variables of age, sex, body weight, baseline PASI, PASI>20 proportion, baseline BSA and PGA score of 4 proportion. For Ixekizumab: variables of age, sex, body weight, baseline PASI and baseline BSA, with separate matching performed for cohorts during induction and maintenance cohorts.
MAIC analysis
Maximum entropy optimization was employed in our study to derive patient-level weights that balanced the Xeligekimab population against each comparator. This approach enables maximization of the entropy of the weight distribution while ensuring that weighted means of the selected baseline characteristics match those reported in the aggregate data. Weights were calculated through exponential tilting, where log-weights were expressed as linear combinations of matching variables. The Broyden–Fletcher–Goldfarb–Shanno (BFGS) algorithm was utilized for optimization, with automatic fallback to the Nelder–Mead simplex method if convergence was not achieved. Convergence was assessed using relative tolerance criteria of 1e-8, with maximum iterations set at 500 for BFGS and 1,000 for Nelder–Mead.
Weights were truncated at the 99th percentile and subsequently rescaled to maintain a mean weight of unity, to prevent individual patients from exerting excessive influence on the results. Meanwhile, to quantify the reduction in precision resulting from weighting, the effective sample size (ESS) was calculated as the square of the sum of weights divided by the sum of squared weights. An ESS retention of >40 % was considered acceptable for maintaining adequate statistical power.
Assessment of balance
Post-weighting covariate balance was evaluated using standardized mean differences (SMD). For continuous variables, SMD was calculated as the absolute difference in means divided by the pooled standard deviation; while for binary variables, it was measured as the absolute difference in proportions divided by the pooled standard deviation of the proportions. Pre- and postweighting distributions are presented in Figs S1-3.
Outcomes comparisons
Primary endpoints included the proportion of patients with PASI 75/90/100 achievement at weeks 12, 52 and 60. Secondary endpoints comprised static PGA (sPGA) 0/1 achievement and Dermatology Life Quality Index (DLQI) 0/1 response rates for Secukinumab comparison, or DLQI change from baseline for Ixekizumab comparison (as DLQI 0/1 data were unavailable in published reports). Treatment differences were expressed as weighted risk differences with 95 % confidence intervals (CI) calculated using the method of normal approximation. Standard errors incorporated weighting-related reduction in precision. Statistical significance was assessed at the two-sided α=0.05 level.
Safety endpoints included treatment-emergent adverse events (TEAE), serious adverse events (SAE), upper respiratory tract infections, injection site reactions, hyperuricaemia, tinea pedis, cough, eczema, infection and ALT elevation. Adverse event definitions were verified for consistency across trials based on published protocols and Common Terminology Criteria for Adverse Events (CTCAE) standards. Analyses using the same MAIC weights applied for efficacy analyses. Inter-treatment risk differences were calculated, with negative values indicating a favourable safety profile for Xeligekimab.
Sensitivity analyses
Comprehensive sensitivity analyses were employed to evaluate the robustness of results. Weight truncation thresholds were varied at the 90th, 95th and 99th percentiles, as well as no truncation, to assess the impact on effective sample size and efficacy estimates. Identical optimization parameters and convergence criteria were maintained as the primary analysis to ensure comparability.
Software and reporting
All statistical analyses were conducted in R 4.3.0 (Vienna, Austria). For the MAIC analysis, we used the following key packages: dplyr and tidyr for data manipulation and preparation; weights for weighted mean and variance calculations; the optim function from base R stats package for entropy maximization in weight optimization; sandwich and lmtest for calculating robust standard errors in weighted regression models; and boot for bootstrap confidence interval estimation. This analysis followed the National Institute for Health and Care Excellence Decision Support Unit Technical Support Document 18 and European Network for Health Technology Assessment guidelines for population-adjusted indirect comparisons.
Ethical approval
This analysis is based on previously conducted studies and does not contain data from new studies with human participants; therefore, ethical approval was not required.
RESULTS
Study population and baseline matching
MAIC analyses compared Xeligekimab (N=281) with Secukinumab (N=221) and Ixekizumab [N=176 (Q2W induction)/92 (Q4W maintenance)]. After weighting, effective sample sizes were 132.0 (47.0% retention), 213.2 (75.9%) and 198.7 (70.7%), respectively. Postmatching standardized mean differences were <0.2 for most variables, indicating adequate covariate balance (Tables I and II; Figs S1-3). Before matching, the Secukinumab cohort had higher baseline disease severity (mean PASI: 27.3 vs 22.2; PASI >20 : 69.7 % vs 50.2 %; BSA: 46.5 % vs 33.8%). After MAIC, most baseline characteristics achieved balance (SMD<0.2), as demonstrated by overlapping density distributions in Figs S1-3.
Table I. Baseline demographic and clinical characteristics of the Xeligekimab population before and after matching to the Secukinumab population
| Variable | Xeligekimab | Secukinumab 300 mg (N=221) | SMD after | |
|---|---|---|---|---|
| Unadjusted (N=281) | Adjusted (ESS=132.0) | |||
| Age [years], mean | 40.9 | 39.1 | 39.0 | 0.007 |
| Male, (%) | 76.2 | 91.0 | 80.1 | 0.313 |
| Body weight [kg], mean | 73.5 | 73.2 | 73.3 | 0.004 |
| Baseline PASI score, mean | 22.2 | 27.2 | 27.3 | 0.007 |
| Baseline PASI>20, (%) | 50.2 | 83.7 | 69.7 | 0.335 |
| PGA=4 | 27.0 | 42.4 | 41.8 | 0.010 |
| Baseline BSA, (%) | 33.8 | 46.3 | 46.5 | 0.012 |
|
Data are presented as mean or n (%) unless otherwise specified. BSA:body surface area; ESS:effective sample size after MAIC weighting; PASI:Psoriasis Area and Severity Index. |
||||
Table II. Baseline characteristics before and after MAIC adjustment for comparisons with Ixekizumab Q2W and Q4W dosing regimens
| Variable | Xeligekimab | SMD after | IXE Q2W (N=176) | Xeligekimab | IXE Q4W/Q4W (N=92) | SMD after | ||
|---|---|---|---|---|---|---|---|---|
| Unadjusted (N=281) | Adjusted (ESS=213.2) | Unadjusted (N=281) | Adjusted (ESS=198.7) | |||||
| Age (years), mean | 40.9 | 39.3 | 0.005 | 39.2 | 40.9 | 41.7 | 41.7 | 0.000 |
| Male, (%) | 76.2 | 76.5 | 0.103 | 80.7 | 76.2 | 68.8 | 70.7 | 0.034 |
| Body weight (kg), mean | 73.5 | 74.2 | 0.002 | 74.2 | 73.5 | 69.2 | 69.2 | 0.003 |
| Baseline PASI score, mean | 22.2 | 26.2 | 0.007 | 26.3 | 22.2 | 26.2 | 26.2 | 0.001 |
| Baseline BSA (%), mean | 33.8 | 43.2 | 0.009 | 43.4 | 33.8 | 42.3 | 42.4 | 0.003 |
|
All continuous variables presented as mean values. BSA:body surface area; ESS:effective sample size; IXE:Ixekizumab; PASI:Psoriasis Area and Severity Index; Q2W:every 2 weeks; Q4W:every 4 weeks maintenance dosing after induction. |
||||||||
Efficacy outcomes
At week 12, PASI response rates were comparable between groups: PASI 75 (93.0% vs 97.7%, p=0.052), PASI 90 (78.1% vs 81.0%, p=0.513) and PASI 100 (31.4% vs 32.9%, p=0.764) (Table II, Fig. 2A). At week 52, while PASI 75 and PASI 90 rates remained similar, Xeligekimab demonstrated significantly higher PASI 100 achievement (57.8% vs 42.1%, p=0.005) (Table III, Figs 2B and 3A-C). During the 12-week induction period, PASI response rates showed no significant differences: PASI 75 (91.5% vs 93.8%, p=0.390), PASI 90 (75.2% vs 82.4%, p=0.082) and PASI 100 (30.2% vs 33.0%, p=0.560) (Table IV, Fig. 2C). At week 60 maintenance phase, Xeligekimab achieved significantly higher PASI 75 rates (92.6% vs 76.1%, p<0.001), while PASI 90 (74.3% vs 71.7%, p=0.652) and PASI 100 (49.6% vs 56.5%, p=0.275) rates were comparable (Table IV, Figs 2D and 3D-F).
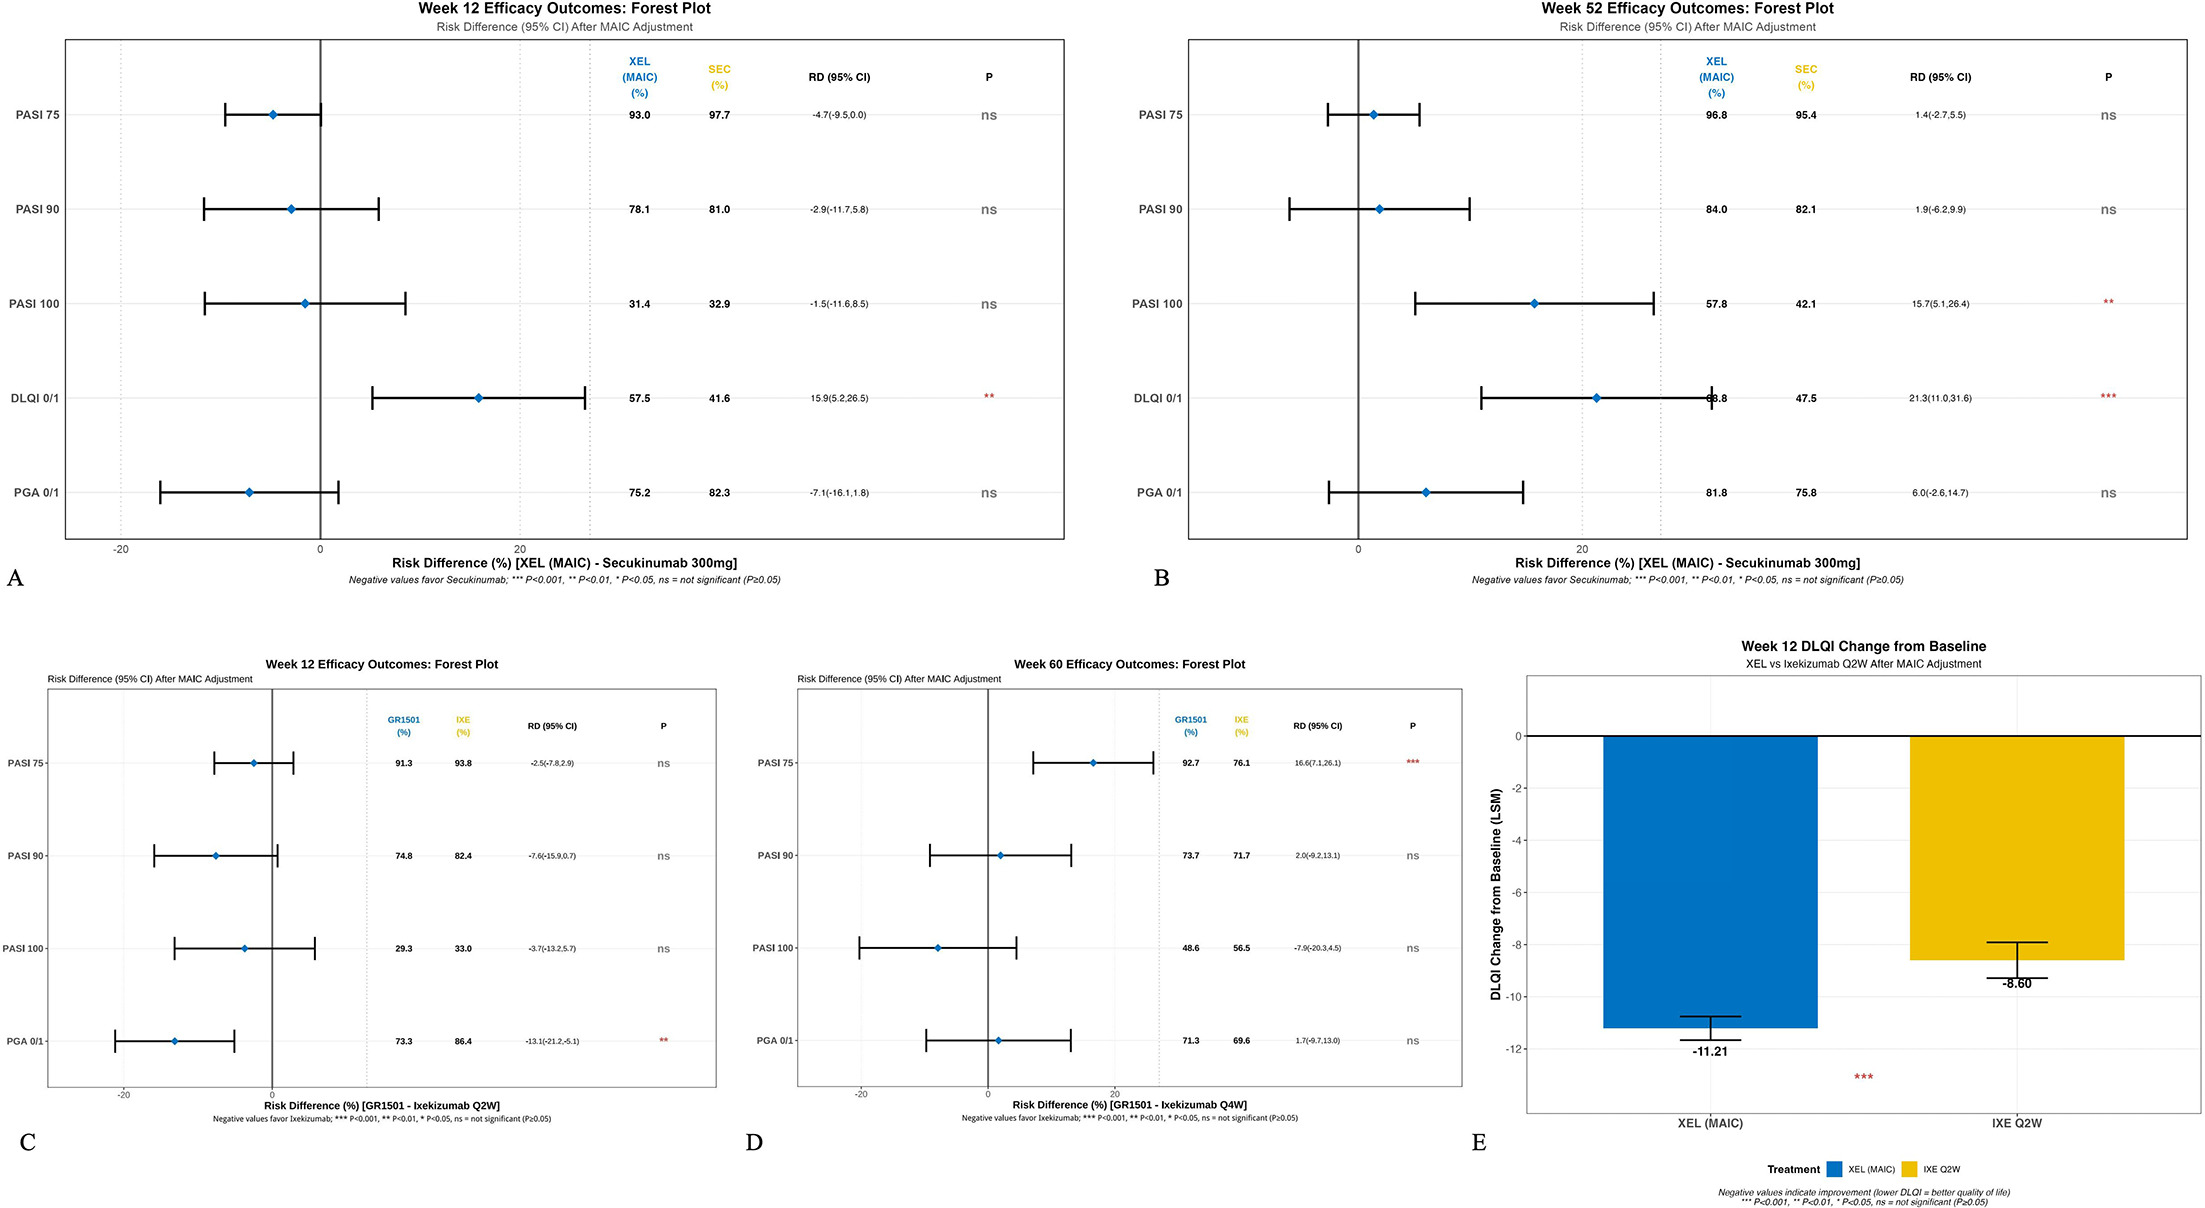
Fig. 2. MAIC-adjusted efficacy outcomes at key timepoints. Forest plots displaying risk differences (RD) with 95 % confidence intervals for primary and secondary efficacy endpoints. (A) Week 12 XEL vs SEC; (B) week 52 XEL vs SEC; (C) week 12 XEL vs IXE; (D) week 60 XEL vs IXE; (E) week 12 DLQI change (LSM) XEL vs IXE. A vertical dashed line indicates no difference (RD=0). Statistical significance is set at p<0.05. PASI, Psoriasis Area and Severity Index; PGA, Physician’s Global Assessment; DLQI, Dermatology Life Quality Index; LSM, least squares mean.
Table III. Comparative outcomes of efficacy between Xeligekimab and Secukinumab at weeks 12 and 52 after MAIC adjustment
| Time points | Outcome | Xeligekimab (%) | Secukinumab (%) | RD (95% CI) | p-value |
|---|---|---|---|---|---|
| 12 Weeks | PASI 75 | 93.0 | 97.7 | −4.7 (−9.5, 0.0) | 0.052 |
| PASI 90 | 78.1 | 81.0 | −2.9 (−11.7, 5.8) | 0.513 | |
| PASI 100 | 31.4 | 32.9 | −1.5 (−11.6, 8.5) | 0.764 | |
| PGA 0/1 | 75.2 | 82.3 | −7.1 (−16.1, 1.8) | 0.118 | |
| DLQI 0/1 | 57.5 | 41.6 | 15.9 (5.2, 26.5) | 0.004 | |
| 52 Weeks | PASI 75 | 96.8 | 95.4 | 1.4 (−2.8, 5.5) | 0.522 |
| PASI 90 | 84.0 | 82.1 | 1.9 (−6.3, 10.1) | 0.654 | |
| PASI 100 | 57.8 | 42.1 | 15.7 (4.8, 26.6) | 0.005 | |
| PGA 0/1 | 81.8 | 75.8 | 6.0 (−2.8, 14.9) | 0.183 | |
| DLQI 0/1 | 68.8 | 47.5 | 21.3 (10.6, 32.0) | <0.001 | |
|
All values represent weighted proportions after MAIC adjustment. DLQI:Dermatology Life Quality Index; PASI:Psoriasis Area and Severity Index; PGA:Physician's Global Assessment; RD:risk difference. |
|||||
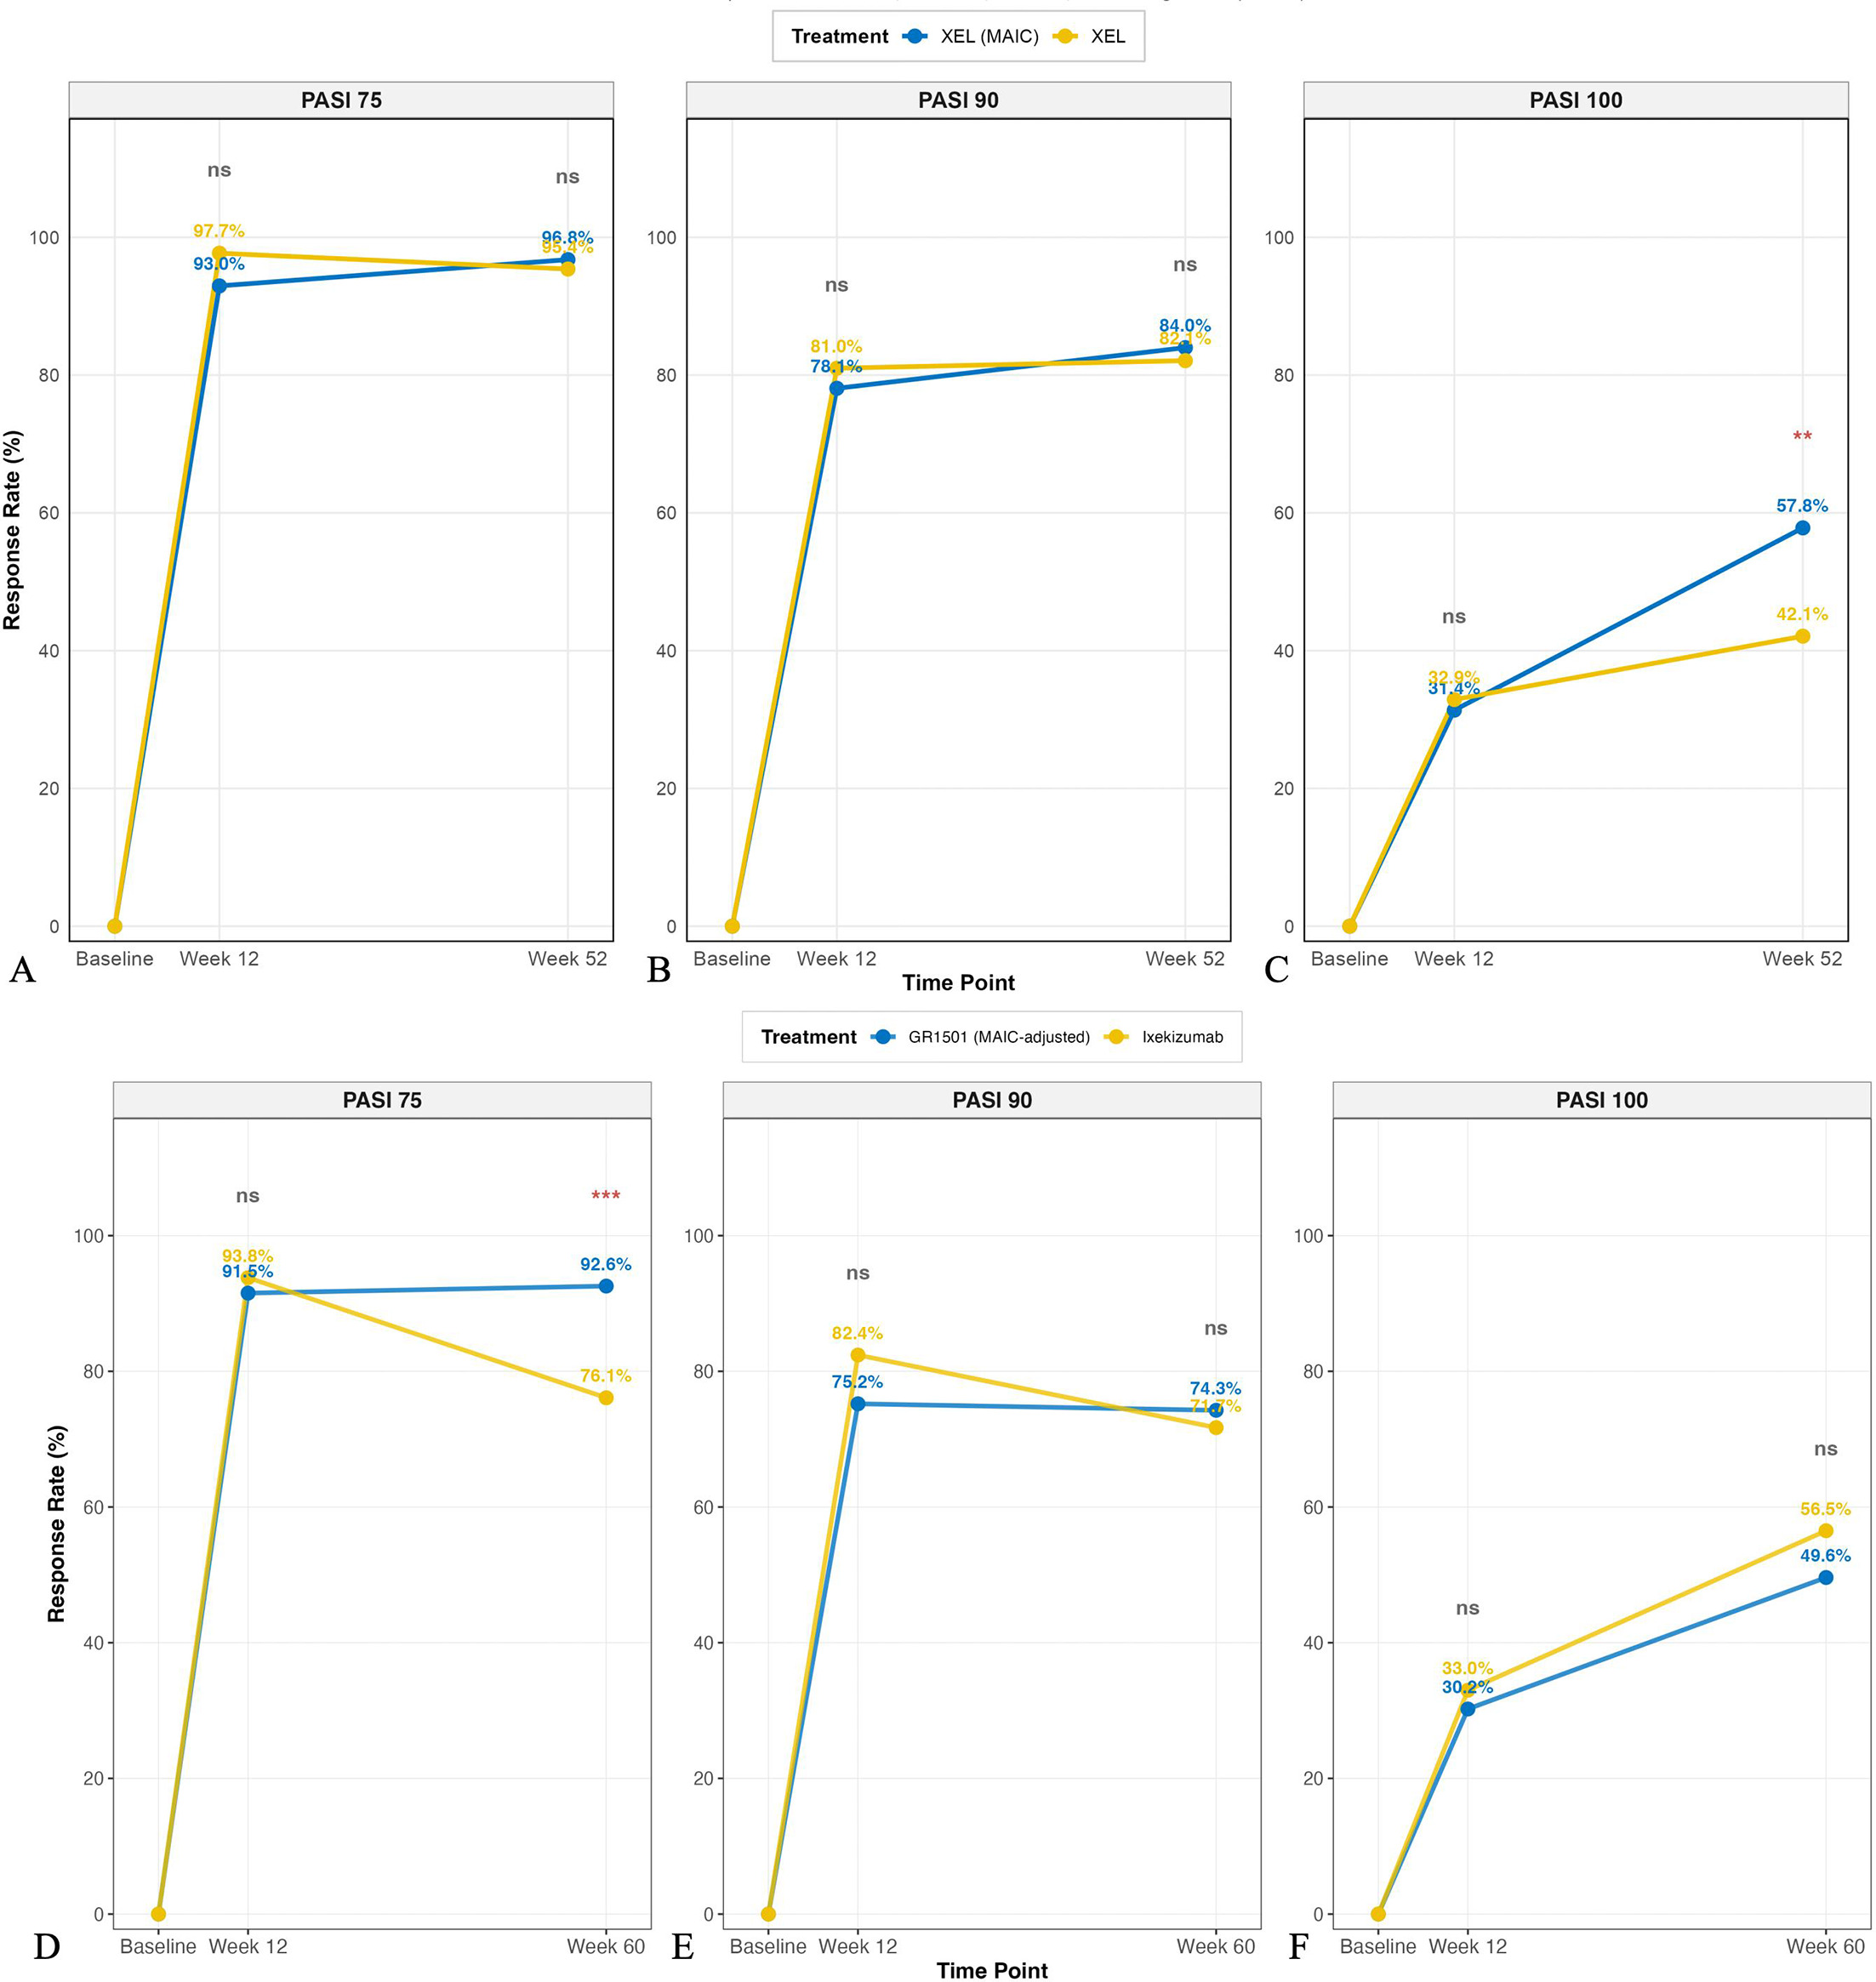
Fig. 3. Temporal evolution of PASI response rates: Xeligekimab vs Secukinumab and Ixekizumab. PASI response trajectories from baseline through week 52 (Secukinumab comparison, panels A–C) and week 60 (Ixekizumab comparison, panels D–F). (A, D) PASI 75; (B, E) PASI 90; (C, F) PASI 100 achievement rates. Data represent MAIC-weighted proportions. XEL, Xeligekimab; SEC, Secukinumab; IXE, Ixekizumab.
Table IV. MAIC-adjusted comparisons of week 12 and 60 efficacy outcomes between Xeligekimab and Ixekizumab regimens
| Time points | Outcome | Xeligekimab (%) | Ixekizumab (%) | RD (95% CI) | p-value |
|---|---|---|---|---|---|
| 12 Weeks with IXE Q2W | PASI 75 | 91.5 | 93.8 | −2.3 (−7.5, 2.9) | 0.390 |
| PASI 90 | 75.2 | 82.4 | −7.2 (−15.3, 0.9) | 0.082 | |
| PASI 100 | 30.2 | 33.0 | −2.8 (−12.1, 6.5) | 0.560 | |
| PGA 0/1 | 73.3% | 86.4% | −13.1 (−21.2, –5.1) | 0.001 | |
| 60 Weeks with IXE Q4W/Q4W | PASI 75 | 92.6 | 76.1 | 16.5 (7.0, 25.9) | <0.001 |
| PASI 90 | 74.3 | 71.7 | 2.6 (−8.5, 13.7) | 0.652 | |
| PASI 100 | 49.6 | 56.5 | −6.9 (−19.3, 5.5) | 0.275 | |
| PGA 0/1 | 71.3% | 69.6% | 1.7 (−9.7, 13) | 0.776 | |
|
Week 60 data for Ixekizumab Q4W/Q4W regimen (Q4W/Q4W maintenance after Q2W induction). All values represent weighted proportions after MAIC adjustment. Risk differences were calculated using weighted generalized linear models with identity link function. 95% CI was obtained through bootstrap resampling (1,000 iterations). P values from two-sided tests. PASI:Psoriasis Area and Severity Index; RD:risk difference. |
|||||
At week 12, PGA 0/1 response rates were 75.2 % for Xeligekimab vs 82.3 % for Secukinumab (p=0.118), and 73.3 % vs 86.4 % for Ixekizumab (p=0.001). At longer follow-up, PGA 0/1 rates were comparable between Xeligekimab and both comparators (Tables III and IV).
Quality-of-life outcomes
Compared to Secukinumab, Xeligekimab showed significantly higher DLQI 0/1 achievement at both week 12 (57.5% vs 41.6%, p=0.004) and week 52 (68.8% vs 47.5%, p<0.001) (Table III). Against Ixekizumab, Xeligekimab showed significantly greater DLQI improvement from baseline at week 12 (LSM difference: −2.61, 95% CI: −3.43 to −1.79, p<0.001) (Fig. 2E).
Safety profiles
Xeligekimab vs Secukinumab
Overall TEAE rates were similar (91.8% vs 90.1%, p=0.508), with no significant difference in SAE incidence (0.4% vs 2.1%, p=0.090) (Fig. 4A, Table SII).
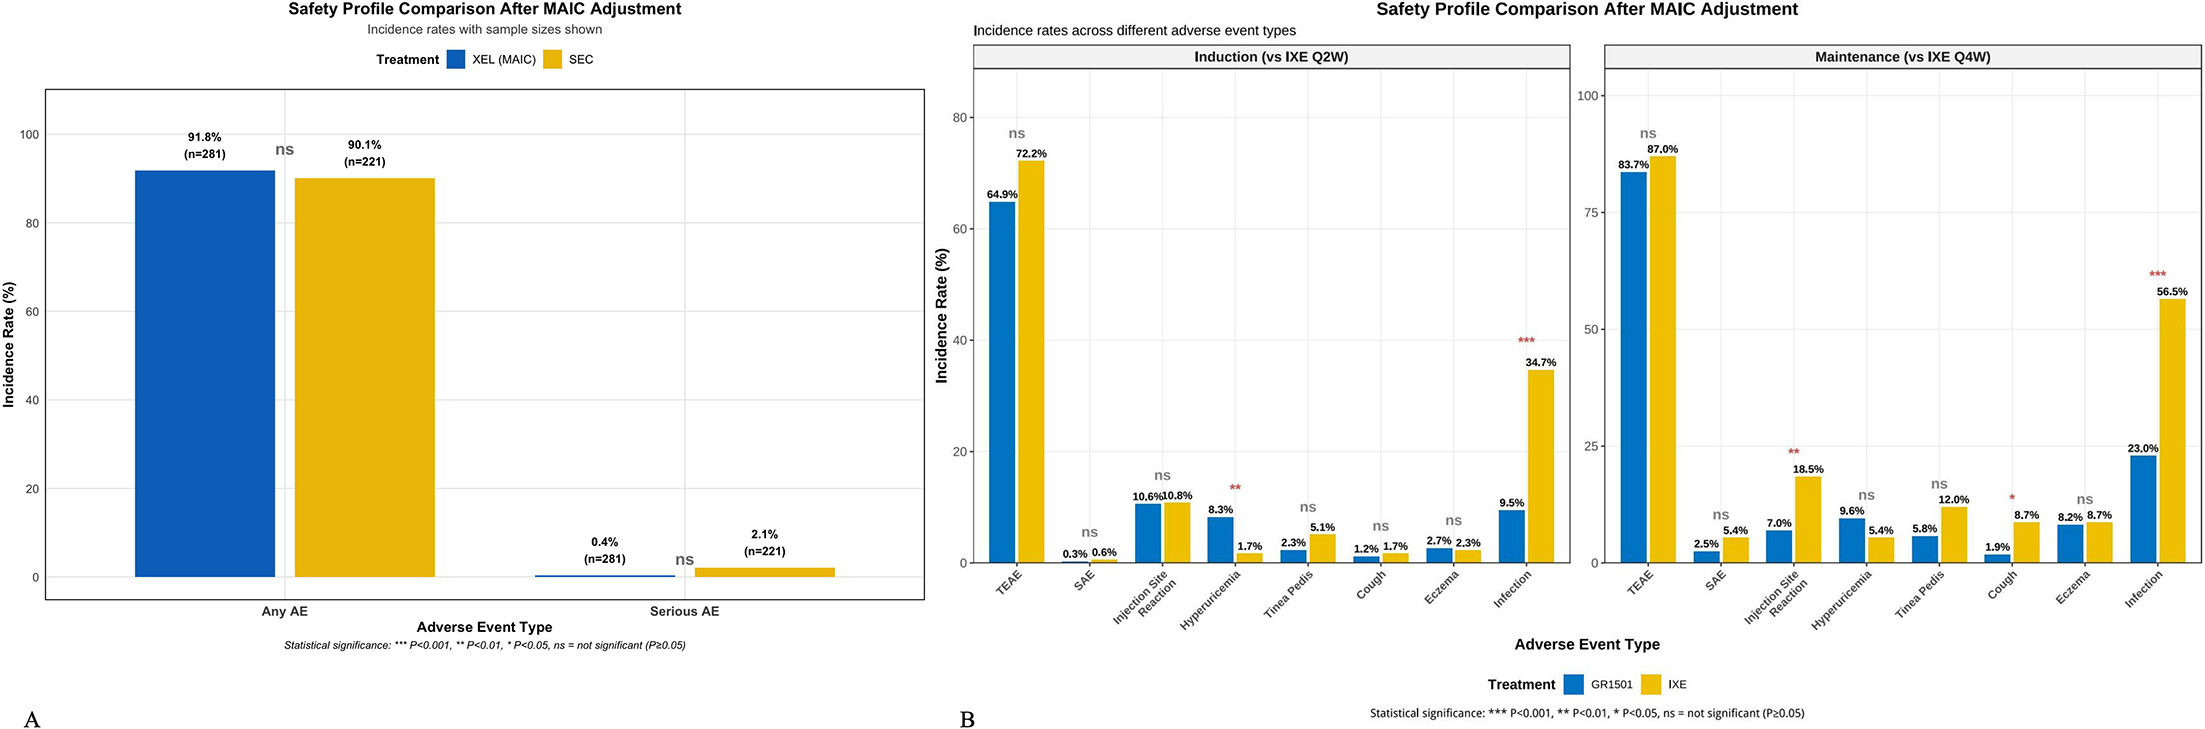
Fig. 4. Comparative safety profiles after MAIC adjustment. Incidence rates of treatment-emergent adverse events presented as weighted proportions. (A) XEL vs SEC: overall TEAE and SAE rates; (B) XEL vs IXE: adverse event profiles during induction (Q2W) and maintenance (Q4W) phases. Statistical comparisons performed using weighted chi-square tests. *P<0.05, **p<0.01, **p<0.001. TEAE, treatment-emergent adverse events; SAE, serious adverse events; URTI, upper respiratory tract infection; ALT, alanine aminotransferase.
Xeligekimab vs Ixekizumab
During induction, Xeligekimab showed significantly lower infection rates (7.9% vs 34.7%, p<0.001) but higher hyperuricaemia incidence (8.6% vs 1.7%, p=0.001). During maintenance, Xeligekimab maintained significantly lower infection rates (22.4% vs 56.5%, p<0.001) and fewer injection site reactions (7.3% vs 18.5%, p=0.012) (Fig. 4B, Table SIII).
Sensitivity analyses
Sensitivity analyses using different weight truncation thresholds (90th, 95th, 99th percentiles, and no truncation) demonstrated consistent efficacy estimates. For the Secukinumab comparison, week 12 PASI 75 rates ranged from 92.8% to 93.0% across all truncation methods (Fig. 5, Table SIV), confirming the robustness of primary findings.
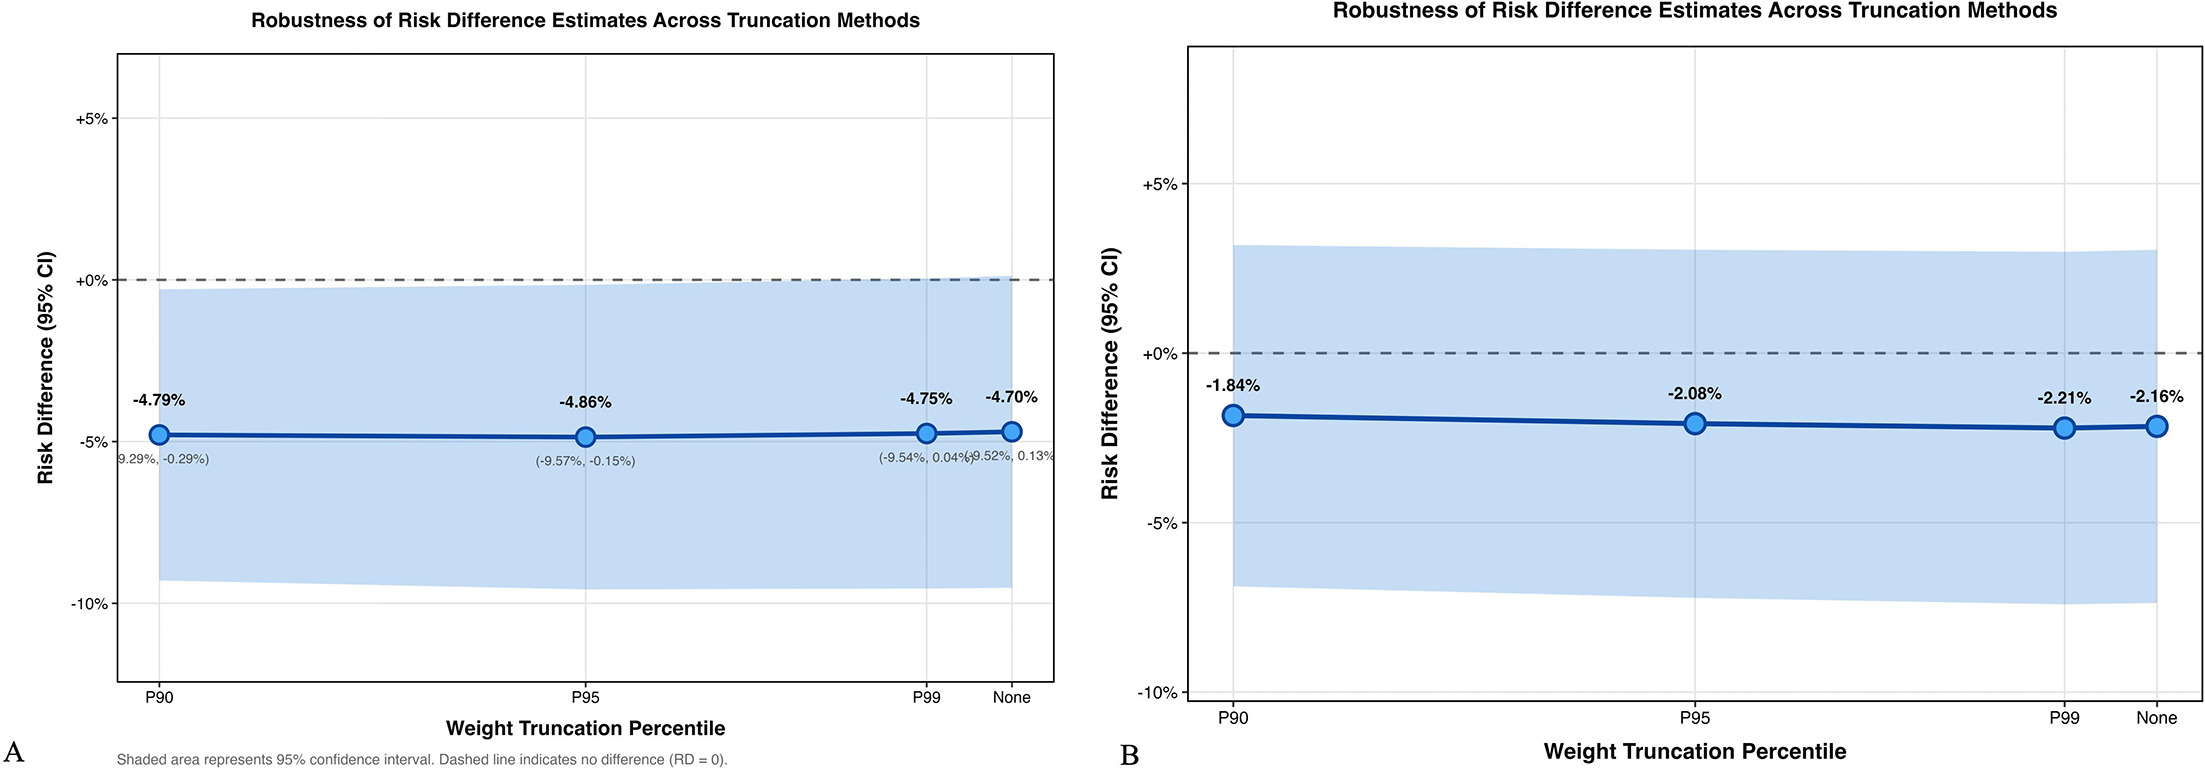
Fig. 5. Sensitivity analyses for primary efficacy endpoint. Impact of weight truncation thresholds on week 12 PASI 75 risk differences. (A) XEL vs SEC; (B) XEL vs IXE. Analyses conducted at 90th, 95th, 99th percentiles and no truncation (100%). Error bars indicate 95 % confidence intervals. Consistent effect estimates across truncation methods support robustness of primary findings.
DISCUSSION
This MAIC analysis systematically evaluated the long-term efficacy and safety of Xeligekimab vs other IL-17A inhibitors in Chinese patients with plaque psoriasis. The analysis revealed comparable short-term efficacy with statistically significant differences in specific long-term endpoints, providing hypothesis-generating evidence requiring validation through direct trials.
Temporal analysis showed that at week 12, Xeligekimab demonstrated comparable efficacy to both comparators, with numerically lower PASI 75 vs Secukinumab (93.0% vs 97.7%, p=0.052) and similar PASI 90 and 100 rates vs both Secukinumab and Ixekizumab (all p>0.05), indicating equivalent early efficacy. By week 52, Xeligekimab achieved significantly higher PASI 100 (57.8% vs 42.1%, p=0.005) vs Secukinumab. This temporal pattern suggests potential differences in long-term maintenance, though clinical significance and underlying mechanisms require prospective investigation (18).
For patients with plaque psoriasis, sustained therapeutic efficacy serves as a fundamental determinant of the prognostic outcomes, quality of life and psychological well-being. As reported by a prior systematic review, psoriasis patients would experience higher prevalence of depression (20–50%), exceeding general population rates by 1.5-fold, with elevated incidence of anxiety disorders and suicidal ideation correspondingly (19). A meta-analysis encompassing 28,424 patients revealed strong correlations between sustained lesion clearance and DLQI improvement, with the observation of a positive correlation between DLQI≤1 achievement and PASI improvement (Rho=0.78, p<0.001) (20). Xeligekimab demonstrated superior quality-of-life outcomes across both comparisons with significantly higher DLQI 0/1 achievement vs Secukinumab at week 52 (68.8% vs 47.5%, p<0.001), and significantly greater DLQI improvement from baseline vs Ixekizumab at week 12 (LSM difference: −2.61, p<0.001). These findings suggest clinically meaningful advantages in patient-reported outcomes, though long-term DLQI 0/1 data for Ixekizumab were unavailable for extended comparison.
Long-term drug survival studies demonstrated that IL-17 achieved 4 year persistence rates of 65–75%,21 indicating sustained efficacy and tolerability in real-world settings. Our study demonstrated long-term efficacy maintenance with Xeligekimab. Compared with Ixekizumab, PASI 75 response rates of 92.6 % at weeks 60 significantly exceeded Ixekizumab (76.1%, p<0.01). Moreover, when compared with Secukinumab, Xeligekimab demonstrated significantly superior PASI 100 achievement at week 52 (57.8% vs 42.1%, p=0.005). However, the marked decline in Ixekizumab long-term efficacy observed in this Chinese cohort contrasts with international open-label extension studies, potentially reflecting population-specific factors, adherence patterns or trial design differences. This discrepancy limits generalizability and warrants further investigation.
Potential mechanistic explanations include pharmacokinetic differences. Xeligekimab exhibits an extended elimination half-life (t1/2β) of 28.5 days,22 which is comparable to Secukinumab (t1/2 : 644±121 h, approximately 26.8 days) (23) but notably longer than Ixekizumab (t1/2 : 15.7 days, range: 5.80–27.5 days) (24). During the maintenance phase, Xeligekimab maintains steady-state trough concentrations (Ctrough, ss) of 28.9±10.13 μg/mL, ensuring continuous therapeutic drug exposure throughout the dosing interval. Xeligekimab demonstrated lower immunogenicity, with Neutralizing Antibody (NAb) of only 0.2% (11). Furthermore, continuous IL-17A suppression may regulate T-cell function, restore Th17/Treg balance and downregulate keratinocyte inflammatory factors, thereby achieving more stable immune homeostasis (25). However, these mechanistic interpretations remain speculative without direct supporting data from this analysis.
Xeligekimab demonstrated notably lower infection rates, holding particular clinical relevance in China, where tuberculosis remains endemic (26, 27) (induction period: 7.9 % vs 34.7 %; and maintenance period: 22.4 % vs 56.5%, p<0.001). In a prospective analysis of 89 Chinese psoriasis patients with latent tuberculosis infection receiving 2 year IL-17A inhibitor treatment but no prophylactic tuberculosis treatment, He et al. (28) reported zero active tuberculosis cases and only 5.6 % T-SPOT.TB conversion rates. This contrasts markedly with TNF-α inhibitors, which trigger a 4–8 fold higher risk of tuberculosis reactivation (29). However, inter-trial safety comparisons have inherent limitations. While adverse event definitions were verified for consistency based on CTCAE v4.0 standards, differences in monitoring intensity, reporting thresholds and exposure duration may influence observed rates. These findings should be interpreted cautiously. Hyperuricaemia emerged as a notable signal requiring monitoring (8.6 vs 1.7%, p<0.05). Wu et al. (30) demonstrated that IL-17A inhibitor therapy possessed potential uric acid-lowering effects. The elevated hyperuricaemia incidence with Xeligekimab, possibly relating to specific mechanisms or baseline patient characteristics.
Important limitations warrant acknowledgment. MAIC methodology, although it can effectively balance differences in baseline characteristics, still has inherent limitations. Despite rigorous matching, unmeasured confounders may persist. The reduced effective sample size (47.0 % for Secukinumab comparison) decreases precision, potentially affecting robustness of some findings. Quality of life conclusions are limited to measured comparisons—DLQI 0/1 superiority demonstrated only vs Secukinumab; Ixekizumab comparison used DLQI change scores due to data unavailability, precluding broader QoL generalizations. Safety comparisons face structural limitations from differential monitoring and exposure durations despite stratification by treatment phase. The marked decline in Ixekizumab long-term efficacy in this Chinese cohort, contrasting with international studies, limits generalizability and suggests population-specific factors requiring investigation.
Future research should prioritize direct head-to-head randomized controlled trials to validate these findings. Real-world drug survival studies with extended follow-up are needed to assess long-term persistence.
In conclusion, this MAIC analysis suggests potential advantages of Xeligekimab in specific long-term efficacy endpoints and infection-related safety outcomes compared to established IL-17A inhibitors in Chinese patients with moderate-to-severe plaque psoriasis. These hypothesis-generating findings require cautious interpretation and validation through prospective head-to-head trials.
REFERENCES
- Ding X, Wang T, Shen Y, Wang X, Zhou C, Tian S, et al. Prevalence of psoriasis in China: a population-based study in six cities. Eur J Dermatol 2012; 22: 663–667. https://doi.org/10.1684/ejd.2012.1802
- Chen K, Wang G, Jin H, Xu J, Zhu X, Zheng M, et al. Clinic characteristics of psoriasis in China: a nationwide survey in over 12000 patients. Oncotarget 2017; 8: 46381–46389. https://doi.org/10.18632/oncotarget.18453
- Gao X, Pan W, Zheng M, Li F, Dong X, Lv D, et al. Efficacy and safety analysis in Chinese patients with moderate-to-severe psoriasis from a phase 3 trial: impact of treatment withdrawal and retreatment of ixekizumab. Adv Ther 2025; 42: 334–347. https://doi.org/10.1007/s12325-024-03030-5
- Huang YW, Tsai TF. Remission duration and long-term outcomes in patients with moderate-to-severe psoriasis treated by biologics or tofacitinib in controlled clinical trials: a 15-year single-center experience. Dermatol Ther 2019; 9: 553–569. https://doi.org/10.1007/s13555-019-0310-5
- Cui L, Chen R, Subedi S, Yu Q, Gong Y, Chen Z, et al. Efficacy and safety of biologics targeting IL-17 and IL-23 in the treatment of moderate-to-severe plaque psoriasis: a systematic review and meta-analysis of randomized controlled trials. Int Immunopharmacol 2018; 62: 46–58. https://doi.org/10.1016/j.intimp.2018.06.020
- NMPA. Drug approval documents for secukinumab and ixekizumab. 2019.
- Blair HA. Xeligekimab: first approval. Drugs 2025; 85: 97–101. https://doi.org/10.1007/s40265-024-02125-1
- Keam SJ. Vunakizumab: first approval. Drugs 2024; 84: 1481–1485. https://doi.org/10.1007/s40265-024-02110-8
- Kuang Y, Li Y, Lv C, Li M, Zhang Z, Chen Y, et al. Unmet needs and treatment preference of systemic treatments for moderate-to-severe psoriasis from the perspectives of patients and dermatologists in China. Dermatol Ther 2024; 14: 1245–1257. https://doi.org/10.1007/s13555-024-01159-3
- Signorovitch JE, Sikirica V, Erder MH, Xie J, Lu M, Hodgkins PS, et al. Matching-adjusted indirect comparisons: a new tool for timely comparative effectiveness research. Value Health 2012; 15: 940–947. https://doi.org/10.1016/j.jval.2012.05.004
- Cai L, Jiang C, Zhang G, Fang H, Wang J, Li Y, et al. A multicentre randomized double-blind placebo-controlled phase III study of the efficacy and safety of xeligekimab (GR1501) in patients with moderate-to-severe plaque psoriasis. Br J Dermatol 2024; 191: 336–343. https://doi.org/10.1093/bjd/ljae062
- Cai L, Zhang JZ, Yao X, Gu J, Liu QZ, Zheng M, et al. Secukinumab demonstrates high efficacy and a favorable safety profile over 52 weeks in Chinese patients with moderate to severe plaque psoriasis. Chin Med J 2020; 133: 2665–2673. https://doi.org/10.1097/CM9.0000000000001163
- Li X, Zheng J, Pan WL, Zheng M, Lu Y, Li FQ, et al. Efficacy and safety of ixekizumab in Chinese patients with moderate-to-severe plaque psoriasis: 60-week results from a phase 3 study. Int J Dermatol Venereol 2022; 5: 181–190. https://doi.org/10.1097/JD9.0000000000000244
- AG N P S. Secukinumab (Cosentyx ®) [Package insert]. 2019.
- COMPANY E L A. Ixekizumab (TALTZ®) [Package insert]. 2019.
- Unit D S. NICE DSU technical support document 18: methods for population-adjusted indirect comparisons in submissions to NICE. 2016.
- CG H. Practical guideline for quantitative evidence synthesis: direct and indirect comparisons. 2015.
- Zhang D, Qiu J, Liao X, Xiao Y, Shen M, Deng Y, et al. Comparison of efficacy of anti-interleukin-17 in the treatment of psoriasis between Caucasians and Asians: a systematic review and meta-analysis. Front Med 2021; 8: 814938. https://doi.org/10.3389/fmed.2021.814938
- Luna PC, Chu CY, Fatani M, Borlenghi C, Adora A, Llamado LQ, et al. Psychosocial burden of psoriasis: a systematic literature review of depression among patients with psoriasis. Dermatol Ther 2023; 13: 3043–3055. https://doi.org/10.1007/s13555-023-01060-5
- Anguita-Montenegro B, Águila V, Palacios-Moya E, García-Arpa M, Sánchez-Caminero MP, Luque-Jiménez M. Perceived quality of life in patients with psoriasis treated with interleukin 17 or 23 inhibitors. Farm Hosp 2024; 48: T204–T211. https://doi.org/10.1016/j.farma.2024.04.012
- Thomas SE, Barenbrug L, Hannink G, Seyger MMB, de Jong EMGJ, van den Reek JMPA. Drug survival of IL-17 and IL-23 inhibitors for psoriasis: a systematic review and meta-analysis. Drugs 2024; 84: 565–578. https://doi.org/10.1007/s40265-024-02028-1
- Chongqing Genrix Biopharmaceutical Co. L. Xeligekimab injection (GR1501) [Package insert]. 2024.
- Shen ZW, Wu KQ, Jin TH, Zhao J, Jiang Q, Guo T, et al. Pharmacokinetics, safety, and immunogenicity of intravenous and subcutaneous single-dose QX002N injection in healthy subjects: a randomized, open, parallel, single-center, phase I study. Rheumatol Ther 2024; 11: 977–988. https://doi.org/10.1007/s40744-024-00683-0
- Zheng M, Chen X, Wang F, Chen J, Jackson K, Yang F, et al. Pharmacokinetics, safety, and efficacy of ixekizumab in Chinese patients with moderate-to-severe plaque psoriasis: a phase 1, single- and multiple-dose study. Adv Ther 2023; 40: 3804–3816. https://doi.org/10.1007/s12325-023-02575-1
- Brembilla NC, Boehncke WH. Revisiting the interleukin 17 family of cytokines in psoriasis: pathogenesis and potential targets for innovative therapies. Front Immunol 2023; 14: 1186455. https://doi.org/10.3389/fimmu.2023.1186455
- Torres T, Chiricozzi A, Puig L, Lé AM, Marzano AV, Dapavo P, et al. Treatment of psoriasis patients with latent tuberculosis using IL-17 and IL-23 inhibitors: a retrospective, multinational, multicentre study. Am J Clin Dermatol 2024; 25: 333–342. https://doi.org/10.1007/s40257-024-00845-4
- Sun R, Wang L, Xia H. Disease burden of tuberculosis in China from 1990 to 2021 and its prediction to 2036. Front Public Health 2024; 12: 1506266. https://doi.org/10.3389/fpubh.2024.1506266
- He CX, Wu C, Zhang L, Jin HZ. Interleukin-17A inhibitors in patients with psoriasis and tuberculosis infection: a 2-year prospective study on safety without preventive treatment. Dermatol Ther 2024; 14: 893–906. https://doi.org/10.1007/s13555-024-01130-2
- Nogueira M, Warren RB, Torres T. Risk of tuberculosis reactivation with interleukin (IL)-17 and IL-23 inhibitors in psoriasis - time for a paradigm change. J Eur Acad Dermatol Venereol 2021; 35: 824–834. https://doi.org/10.1111/jdv.16866
- Wu C, He C, Wang H, Wang W, Jin H. Impact of IL-17A inhibitors on serum uric acid levels in psoriatic patients with hyperuricemia: a prospective observational study. Psoriasis 2024; 14: 153–166. https://doi.org/10.2147/PTT.S486152