ORIGINAL REPORT
Cell-free DNA Levels in Cellulitis: A Cross-sectional Prospective Study
Chaya Bracha GORDON1, Ayelet OLLECH2,3, Gidon TEST4, Omer LAST1, Amos DOUVDEVANI1,5 and Amir HOREV1,6*
1Ben Gurion University of the Negev, Faculty of Health Sciences, Beer-Sheva, Israel, 2Pediatric Dermatology Service, Shaare Zedek Medical Center, Jerusalem, Israel, 3Faculty of Medicine, The Hebrew University of Jerusalem, Jerusalem, Israel, 4Pediatric Emergency Department, Soroka University Medical Center, Beer-Sheva, Israel, 5Department of Clinical Biochemistry, Soroka Medical Center, Beer-Sheva, Israel, and 6Pediatric Dermatology Service, Soroka University Medical Center, Beer-Sheva, Israel
Corr: Amir Horev, Ben Gurion University of the Negev, Faculty of Health Sciences, Hanesiim St, Beer-Sheva, 84101, Israel. *Email: horev8@gmail.com
Key words: cellulitis; cell-free DNA; biomarker.
Citation: Acta Derm Venereol 2026; 106: adv-2025-0020. DOI: https://doi.org/10.2340/actadv.v106.adv-2025-0020.
Copyright: © 2026 The Author(s). Published by MJS Publishing, on behalf of the Society for Publication of Acta Dermato-Venereologica. This is an Open Access article distributed under the terms of the Creative Commons Attribution-NonCommercial 4.0 International License (https://creativecommons.org/licenses/by-nc/4.0/).
Submitted: Sept 10, 2025. Accepted after revision: May 15, 2026.
Published: Jun 2, 2026.
Competing interests and funding: The authors have no conflicts of interest to declare.
The authors declare that no funds, grants, or other support were received during the preparation of this manuscript.
The data that support the findings of this study are available from the corresponding author upon reasonable request.
The study was reviewed and approved by the local Ethics Committee of the Soroka University Medical Center, Israel (approval number 0338-16-SOR). Informed consent was obtained from each patient before entering the study.
Cellulitis is a prevalent inflammatory dermatosis caused by bacterial infection that lacks a definitive quantitative biomarker for assessing disease activity and monitoring therapeutic response, leading to diagnostic ambiguity and management challenges. Cell-free DNA (cfDNA), consisting of short nucleic acid fragments released into circulation from necrotic and apoptotic cells, represents a potential objective measure of systemic inflammation. We hypothesized that cfDNA levels would be elevated in patients with cellulitis and correlate with established inflammatory parameters and clinical outcomes. We conducted a cross-sectional prospective study of 36 patients with confirmed cellulitis and 30 healthy controls. Plasma cfDNA levels were quantified at baseline (admission), 72 hours after antibiotic initiation, at discharge and at 3-week follow-up. We assessed correlations between cfDNA and traditional inflammatory markers, including C-reactive protein and white blood cell counts, as well as patient-reported pain scores. Patients with cellulitis exhibited significantly elevated plasma cfDNA levels at admission compared with healthy controls. Following antibiotic therapy, cfDNA levels declined rapidly and were positively correlated with reductions in white blood cell/neutrophil counts. Higher cfDNA levels were also associated with increased subjective pain scores. These findings suggest that cfDNA may serve as a promising biomarker for the diagnosis of cellulitis and for objectively monitoring treatment efficacy, with potential utility as an objective proxy for pain severity.
SIGNIFICANCE
Cellulitis is a common inflammatory condition caused by bacterial infection that often lacks an objective diagnostic gold standard, contributing to misdiagnosis and increased healthcare costs. Our study investigated cell-free DNA, a circulating biomarker of inflammation, as a potential tool for identifying and monitoring this disease. We found that cell-free DNA levels are elevated in patients with cellulitis, decrease with treatment and correlate with white blood cell and neutrophil counts. These findings suggest cell-free DNA may be a valuable objective measure for confirming diagnosis and tracking treatment response. Furthermore, its correlation with patient-reported pain indicates it could be a useful biomarker for objectively assessing pain levels.
Cellulitis, a common skin condition in clinical practice, is characterized by bacterial invasion into the dermis, causing localized inflammation that manifests as pain, erythema, swelling and warmth. Its high prevalence, coupled with frequent misdiagnosis due to the lack of a definitive diagnostic gold standard, imposes a significant burden on the healthcare system, often leading to unnecessary hospitalizations and elevated healthcare costs (1, 2). To improve diagnostic accuracy, recent research has focused on identifying biomarkers that can help differentiate cellulitis from other conditions (3, 4, 5, 6).
Cell-free DNA (cfDNA) is a promising biomarker that has yet to be explored in the context of cellulitis. cfDNA consists of DNA fragments released from cells undergoing apoptosis, lysis or necrosis in affected tissue. In inflamed tissue, a significant source of cfDNA is the active release from neutrophils in the form of neutrophil extracellular traps (NETs), a matrix primarily composed of DNA (7). Previously studied in association with conditions marked by systemic inflammation or immune dysregulation such as bacteremia, sepsis and myelofibrosis, cfDNA has also shown elevated levels in various dermatologic disorders, including hidradenitis suppurativa, melanoma and dermatomyositis (8, 9, 10, 11, 12, 13, 14). Given that cellulitis is associated with inflammation and tissue damage, cfDNA may prove helpful in its study, as its levels have been observed to rise and fall in response to inflammation and treatment in conditions like metastatic melanoma and psoriasis (15, 16). We aim to investigate cfDNA levels in patients with cellulitis to evaluate their potential as a biomarker for monitoring treatment response and assessing their correlation with patient-reported pain intensity throughout treatment.
MATERIALS AND METHODS
We conducted a cross-sectional, prospective study examining the levels of serum cfDNA in patients with cellulitis compared to healthy controls. Changes in cfDNA, WBC, CRP and neutrophil levels in patients with cellulitis were tracked over time, from admission to 72±48 hours post-treatment, discharge and follow-up. Trends in cfDNA levels over time were observed as well. Additionally, correlations were analysed between cfDNA and neutrophil counts and cfDNA and CRP. The correlation between pain severity and cfDNA and CRP values was also analysed.
Data were gathered from patients seen by dermatologists in the Dermatology departments of the Soroka University Medical Center (SUMC) from January 2018 to March 2020. SUMC, a 1,200-bed university-affiliated referral centre, serves as a tertiary hospital for up to 1 million residents in Southern Israel. The study was conducted in accordance with the declaration of Helsinki and all appropriate amendments. The study was reviewed and approved by the local Ethics Committee of SUMC, Israel (approval number 0338-16-SOR). Informed consent was obtained from each patient before entering the study.
Study population
Our study included adult patients (>18 years old) clinically diagnosed with cellulitis and healthy, age-matched controls. Patients diagnosed with other conditions that may affect the levels of cfDNA in the serum were excluded from the study, including psoriasis, pregnancy, rheumatoid arthritis, lupus, malignant disease or other acute diseases.
The severity of the disease was assessed by observing any additional symptoms such as blisters, ulcers, lymphangitis, oedema or erosions and noting the intensity of the pain using the visual analog pain scale. Each criterion was given one point and divided into these groups: 0–1 mild, 2–3 moderate, 4–5 severe. Epidemiological information such as age and gender was collected as well.
Venous blood samples of 1–2 ml were collected at admission before treatment, 72±48 hours inpatient during treatment, upon discharge and during follow-up visits at the dermatology clinic 3 weeks ±1 week). Inpatient treatment included systemic antibiotics with topical potassium permanganate compresses. Laboratory data were obtained from the database of Soroka Medical Center. Along with the blood samples, a complete physical examination and anamnesis were performed each time.
Lab analyses
cfDNA measurement
Blood samples were collected in commercial gel tubes using BD Vacutainer® SST II plastic serum tubes with silica (clot activator) gel (Becton-Dickinson, Plymouth, UK). Sera were separated by centrifugation (4°C, 2000g, 10 min) and kept at –20°C until assayed. cfDNA was quantified on coded serum samples by a rapid SYBR® Gold fluorometric assay, which does not require prior processing of samples, i.e., DNA extraction and amplification (17). Briefly, 20µL of patient serum was applied in duplicate to black 96-well plates (Greiner Bio-One; Frickenhausen, Germany). 80 µL of diluted SYBR® Gold (Invitrogen, Paisley, UK) was added to each well (final dilution 1 : 10,000), and fluorescence was measured with a 96-well fluorimeter (SpectraMax Paradigm plate reader, Molecular Devices, San Jose, CA) at an emission wavelength of 535 nm and an excitation wavelength of 485 nm. Concentrations of unknown samples were calculated by extrapolation in a linear regression model from a standard curve (39–5000 ng/ml) of sonicated Salmon sperm DNA (Sigma-Aldrich). We employed this direct fluorometric measurement. This approach was chosen to avoid biases inherent to qPCR-based quantification, which can be influenced by the DNA extraction protocol and the selection of target genes.
Statistical analysis
Statistical analysis was performed using Prism 6.1 software. Data are presented as mean ± standard deviation (SD) for normally distributed variables and as median and 95% confidence interval (95% CI) otherwise. A t-test was applied to compare cfDNA levels between groups. For correlation analyses, Pearson correlation coefficient was used for continuous variables, while Spearman rank correlation was used for noncontinuous variables. ANOVA analysis was performed to assess changes in cfDNA over time across more than 2 groups. A significance level of p<0.05 was selected. We compared cfDNA levels between patients diagnosed with cellulitis and healthy controls.
RESULTS
Group demographics
Our study consisted of 66 patients overall. Thirty-six patients with cellulitis had a mean age of 52.6 ±18.71 years (mean ± SD). The control group consisted of 30 healthy individuals without cellulitis with a mean age of 53.4 ± 14.15 years. The groups were age-matched, with no significant difference in mean age (p>0.05), as shown in Table I. Among the patients with cellulitis, 32 (88.9%) identified as Jewish and 4 (11.1%) as Bedouin, as shown in Table I. cfDNA levels: patients with cellulitis vs controls.
Table I. Demographic data and data for patients with cellulitis
| Patients with cellulitis | Control group | p value | |
|---|---|---|---|
| Number of patients | 36 | 30 | |
| Average age ± SD | 52.6 ± 18.4 | 53.4 ± 14.5 | >0.05 |
| Age range | 19–92 | 26–73 | |
| Gender = male (%) | 23 (63.9) | ||
| Bedouin (%) | 4 (11.1) | ||
| Jewish (%) | 32 (88.9) |
Upon admission, patients diagnosed with cellulitis exhibited a significantly elevated median cfDNA concentration of 990 (95% CI: 796–1478) compared to the control group’s median of 523 ng/mL (420–573; p<0.0001), as illustrated in Fig. 1A.

Fig. 1. Cell free DNA levels (cfDNA) levels at admission in patients with cellulitis vs control group. ****p<0.0001. The continuous line represents the median cfDNA levels, while the dashed line indicates the cutoff for normal levels. (B) cfDNA level changes over time in individual patients. Patient marked in red showed a sharp increase in cfDNA levels, which corresponded with clinical worsening.
Trends in cfDNA levels over time
Most patients (69.7%) exhibited a trend of decreasing cfDNA levels from the acute infection to the resolution post-treatment and during follow-up. However, a few patients showed slight increases, and one patient had an 80.66% increase in their cfDNA level after initiation of treatment, which correlated with a clinical worsening, as seen in Fig. 1B.
cfDNA levels over time in cellulitis patients: Pretreatment to follow-up
As seen in Fig. 2A, following treatment, cfDNA levels decreased from an initial median of 989 (796–1478) ng/mL at admission to 816 (578–1017) ng/mL 72±48 hours later, 748 (534–918) ng/mL at discharge and eventually reached 707 (333–852) ng/mL at follow-up. Statistically significant reduction in cfDNA was observed between admission and all other time points (p<0.05).
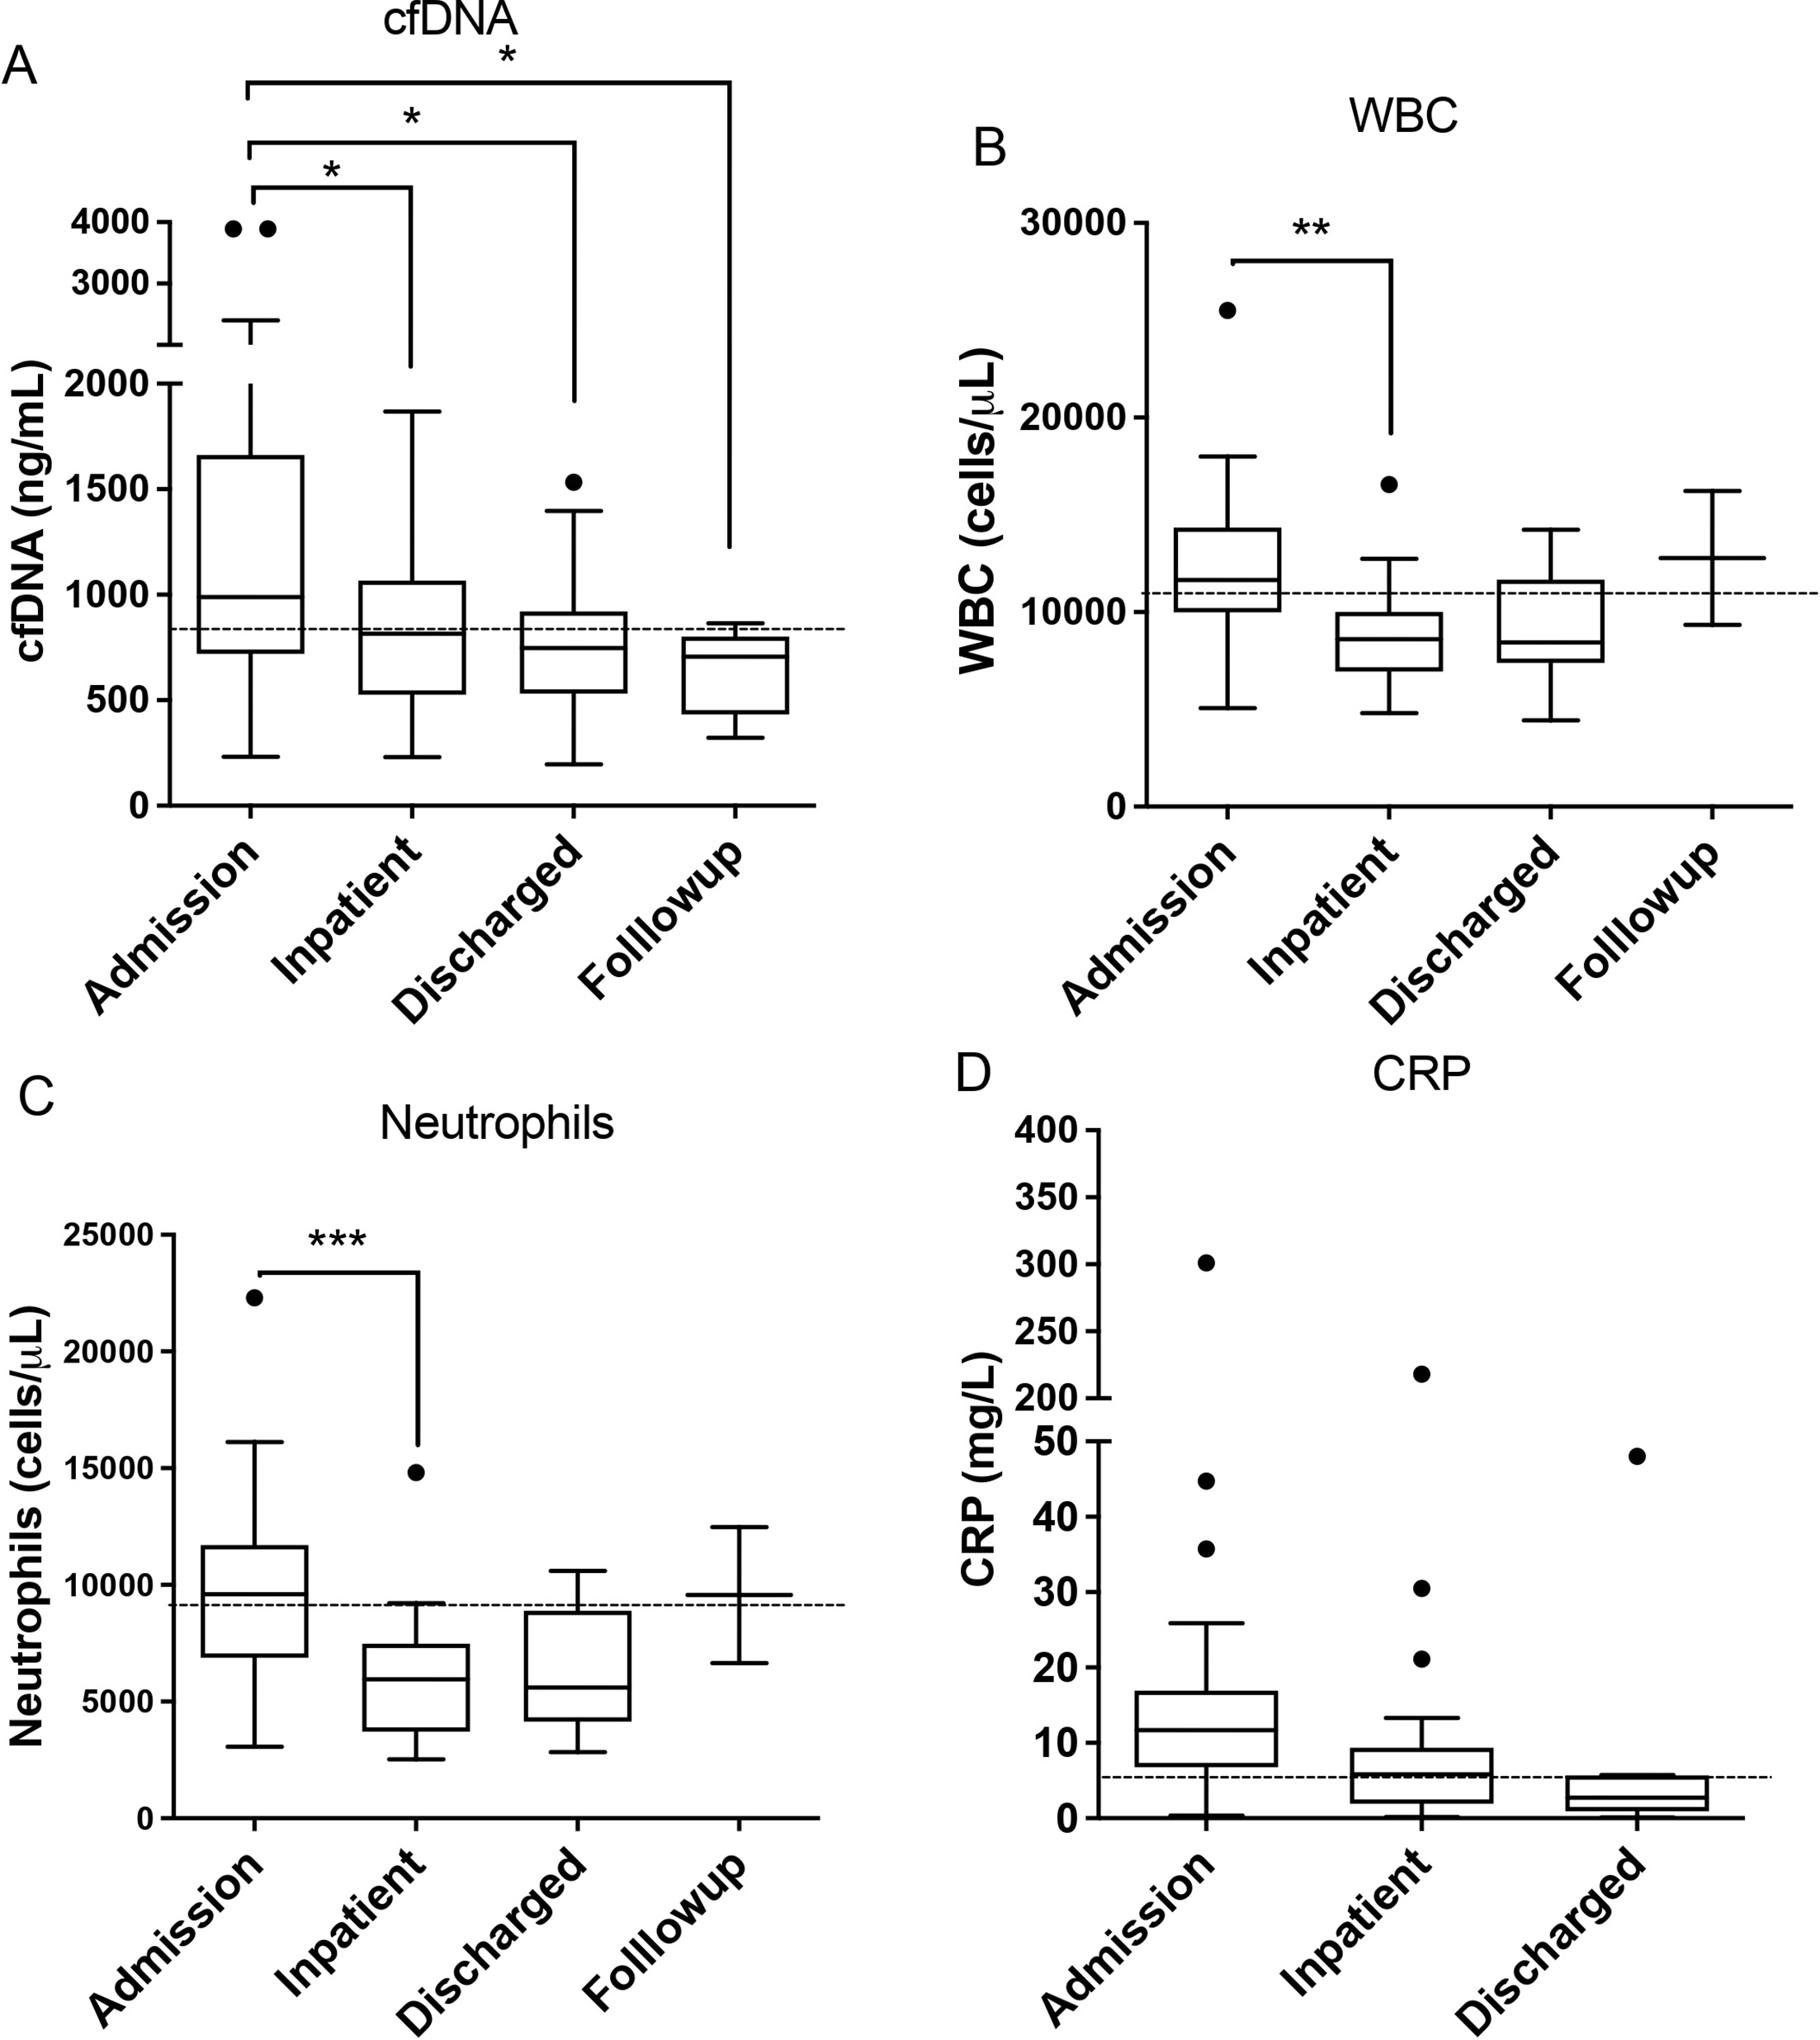
Fig. 2. cfDNA levels over time in cellulitis patients, from pretreatment to follow-up. *p<0.05. The continuous line represents the median levels, while the dashed line indicates the cutoff for normal levels. (B) White blood cell (WBC) levels over time in cellulitis patients, from pretreatment to follow-up.**p<0.05. (C) Neutrophil levels over time in cellulitis patients, from pretreatment to follow-up. ***p<0.0001. (D) C reactive protein (CRP) levels over time in cellulitis patients, from pretreatment to discharge.
WBC counts followed this trend, decreasing from an initial median of 11645 (10250–12950) cells/µL at admission to 8610 (7400–9910) cells/µL 72±48 hours later (p<0.01), as illustrated in Fig. 2B. Following treatment, neutrophil counts significantly decreased from an initial median of 9600 (7420–10540) cells/µL to 5955 (4560–6950) cells/µL (p<0.001), as illustrated in Fig. 2C. CRP decreased as well, but not significantly, with an initial median of 11.71 (7.91–15.40) mg/L at admission to 5.830 (2.470–9.050) mg/L 72±48 hours later and 2.760 (0.12–48.00) mg/L at discharge, as illustrated in Fig. 2D.
Correlation between cfDNA values and neutrophil count
A significant correlation was found between cfDNA values and neutrophil count at the time of admission (r=0.34, p<0.05) and inpatient (r=0.47, p<0.05), as illustrated in Fig. 3A and B.

Fig. 3. Correlation between cfDNA levels and neutrophil count at the time of admission. A positive correlation is observed (p<0.05, r=0.34). (B) Correlation between cfDNA values and Neutrophil count after initiation of treatment. A positive correlation is observed (p<0.05, r=0.47). (C) Correlation between cfDNA at discharge values and CRP 72±48 hours after treatment initiation. A positive correlation is observed (p<0.05, r=0.59).
Correlation between cfDNA and CRP
We found no correlation between cfDNA and CRP at admission and inpatient. Interestingly, a significant correlation was found between cfDNA values at discharge and CRP at inpatient, 72±48 hours after admission and initiation of treatment (r=0.59, p<0.05) (not shown).
Correlation between cfDNA and CRP values and pain
A significant correlation was found between cfDNA values and VAS values over 7 at admission. Patients with VAS scores greater than 7 had notably elevated cfDNA levels compared to those with lower scores (1348 (873–2403) vs 852 (655–1478) ng/mL, p<0.05), as illustrated in Fig. 4A.

Fig. 4. Correlation between cfDNA levels and pain. The dashed line indicates the cutoff for pain levels above 7. *p<0.05. (B) ROC Curve cfDNA levels for patients with pain above (Visual Analogue Scale) VAS 7. AUC=0.713.
The ROC curve analysis demonstrated that cfDNA levels effectively distinguish between individuals with high and low pain levels (AUC=0.713, p<0.05), as seen in Fig. 4B.
In contrast to cfDNA, no correlation was found between admission CRP and pain, as seen in Fig. 4C.
Correlation between cfDNA values and severity of cellulitis
No significant correlation was found between the level of cfDNA and the severity of cellulitis at admission or after the initiation of treatment (r=–0.046, p>0.05 and r=0.051, p>0.05).
DISCUSSION
In the current study, we observed elevated cfDNA levels in patients diagnosed with cellulitis, compared to their controls, which significantly decreased following antibiotic treatment initiation. The reduction in cfDNA mirrored a corresponding decrease in WBC counts, including neutrophils, after initiation of treatment.
Notably, elevated cfDNA levels are associated with higher VAS pain scores and effectively distinguish between individuals with high and low pain levels. cfDNA has also been shown to correlate with decreased pressure pain threshold in the context of nerve blocks for muscle inflammation (18). A number of potential mechanisms may be responsible for this observed correlation. cfDNA can function as a damage-associated molecular pattern (DAMP), initiating downstream inflammatory signalling. In particular, cfDNA has been shown to activate NF-κB–dependent pathways, contributing to nociceptor sensitivity (19, 20).
Toll-like receptors (TLRs) on nociceptors can recognize cfDNA and induce expression of pro-inflammatory mediators and receptors, promoting increased pain sensitivity (21, 22).
The cyclic GMP-AMP synthase–stimulator of interferon genes (cGAS–STING) pathway on nociceptors may also be stimulated by cfDNA and function as a pain modulator (23).
Circulating cfDNA has a short half-life of less than one hour (24); therefore, changes in its concentration may reflect inflammation and tissue damage in near real time. In contrast, CRP has a substantially longer half-life (approximately 16–19 hours), which may explain why CRP levels were not associated with pain intensity in our cohort (18). This marked difference in half-life may also explain the lack of correlation between cfDNA and CRP levels at admission and during hospitalization.
The median initial CRP of 11.71 mg/L at admission in our cohort is consistent with bacterial skin infections such as cellulitis, particularly as an early measurement, since about 44% of patients with bacterial infections present with baseline CRP values <10 mg/L (25).
Our finding of elevated cell-free DNA (cfDNA) levels in patients with cellulitis aligns with previous reports identifying cfDNA as a biomarker of inflammation and immune dysregulation in conditions such as bacteremia, sepsis, and myelofibrosis (9, 10, 11, 12). Similarly, elevated cfDNA levels have been observed in dermatologic disorders including hidradenitis suppurativa, melanoma and dermatomyositis (8, 13, 14).
Although circulating cfDNA levels were elevated in patients with cellulitis, we did not observe a correlation between cfDNA concentration and disease severity. This contrasts with conditions such as sepsis, where cfDNA levels typically rise with severity (26). Given the localized nature of cellulitis compared to the systemic process seen in sepsis, these findings are consistent with underlying pathophysiology. A similar pattern was noted in our recent study on Herpes Zoster (HZ), in which cfDNA levels were elevated in acute HZ, a condition with more systemic involvement, but not in postherpetic neuralgia (PHN), which is more localized (27).
Therefore, in patients with cellulitis, cfDNA may serve better as a diagnostic biomarker rather than an indicator of disease severity. We observed a significant reduction in cfDNA levels following admission and initiation of treatment. This decrease suggests an initial reduction in inflammation in response to the treatment. However, after this initial drop, cfDNA levels showed no further statistically significant changes, although a decreasing trend persisted. This observation indicates that the most pronounced impact of the treatment occurred within the first days, aligning with data demonstrating that most patients with cellulitis show clinical improvement within 2–5 days of treatment initiation, with some experiencing clinical and biochemical improvements as early as the first day (28, 29). It is notable that one patient experienced clinical decline following treatment, accompanied by an 80.66% increase in cfDNA levels. This further supports the idea that cfDNA serves as a marker of treatment response, indicating both positive outcomes and treatment failures. This is supported by treatment response studies in colorectal and metastatic breast cancer, as well as melanoma, where decreases in cfDNA were observed in patients responding to treatment (30, 31, 32).
Our findings of decreased cfDNA after treatment initiation are further supported by the positive correlation observed between cfDNA levels and neutrophils. This correlation offers further support for the reliability of cfDNA as a marker of disease presence and severity since cfDNA significantly decreased alongside neutrophils, an accepted marker of inflammation (33). Similar data were seen in patients with hidradenitis suppurativa in which cfDNA and CRP had a positive correlation (13).
It is noteworthy that although the reduction in cfDNA levels in hospitalized patients after initiation of treatment was statistically significant, there was no corresponding significant decrease in CRP levels. This observation suggests that cfDNA may serve as a more immediate biomarker for monitoring initial therapeutic responses in patients with cellulitis. This finding aligns with the known differences in half-life between cfDNA and CRP. cfDNA has a relatively short serum half-life of 1–5 hours, allowing for rapid detection of changes. Consequently, alterations in CRP levels may manifest more gradually, thereby limiting its utility in tracking early treatment responses as effectively as cfDNA (34, 35, 36). Erythrocyte sedimentation rate (ESR) also normalizes more slowly than cfDNA, typically taking several weeks to return to baseline (37). Even procalcitonin observed early in patients with cellulitis, is less valuable than cfDNA as a predictor of initial improvement, as its half-life is 24–48 hours, which is longer than that of cfDNA (38, 39).
Another potential advantage of cfDNA is the significant correlation between elevated cfDNA levels and increased pain intensity, particularly among patients with cellulitis who reported a VAS pain score greater than 7. Furthermore, cfDNA levels effectively differentiated between high and low pain states, suggesting that cfDNA may be a valuable biomarker for assessing pain levels in patients with cellulitis. This observation is supported by prior research in patients with lumbar degenerative disease, where elevated cfDNA levels were similarly correlated with increased pain intensity (40). In contrast, CRP did not correlate with pain scores. This insight highlights the potential of cfDNA as an objective indicator, particularly useful for patients who cannot effectively communicate the true extent of their pain. Our study possesses several strengths that underscore its scientific relevance. A primary strength is its novel focus on cfDNA levels following treatment initiation for cellulitis, an area with limited existing data. Additionally, our longitudinal prospective analysis, along with a comparison to the control group, enhances the robustness of our findings by offering valuable insights into the fluctuations of cfDNA over time. Moreover, we cross-referenced the observed elevations in cfDNA with established inflammatory markers such as neutrophil counts and WBC counts to validate the alignment of cfDNA with recognized indicators of inflammation.
Our method for measuring cfDNA is highly affordable, costing approximately 1 USD per patient, which enhances the feasibility of its implementation in clinical practice. Additionally, it has been verified that contribution of RNA to DNA quantification is negligible.
However, there are some limitations to consider. While patients with conditions known to affect cfDNA levels, such as psoriasis, pregnancy, rheumatoid arthritis, lupus, malignant disease or acute disease, were excluded from the exposed group, there may have been other unknown conditions that were not accounted for that impacted cfDNA levels. The control group was not matched by gender, which may represent a limitation; however, prior findings, including those from the present study, suggest that cfDNA levels do not differ significantly between males and females. CRP measurements were not available at outpatient follow up due to technical limitations, which may have restricted longitudinal assessment. Additionally, the single-centre design may limit the generalizability of findings to broader populations. Further research is necessary to determine whether these findings are reproducible in a larger sample size and across multiple centres, which would enhance the generalizability of the results.
Investigating cfDNA levels in patients with conditions that mimic cellulitis, such as pseudocellulitis, could also be valuable, as potential differences in cfDNA levels may help improve diagnostic accuracy.
Our findings highlight the potential of cfDNA as a valuable biomarker for cellulitis. It can also serve as a minimally invasive complement to other clinical diagnostic tools used to monitor treatment response. Furthermore, cfDNA may serve as an objective tool for assessing pain levels in patients with cellulitis who may be unable to communicate their level of pain effectively.
REFERENCES
- Yu Weng Q, Raff AB, Vedak P, Cohen JM, Okhovat JP. The health care burden of misdiagnosed cellulitis: an inpatient analysis. J Am Acad Dermatol 2016; 74: AB74. https://doi.org/10.1016/j.jaad.2016.02.292
- Weng QY, Raff AB, Cohen JM, Gunasekera N, Okhovat JP, Vedak P, et al. Costs and consequences associated with misdiagnosed lower extremity cellulitis. JAMA Dermatol 2017; 153: 141–146. https://doi.org/10.1001/jamadermatol.2016.3816
- Bertolus C, Schouman T, Aubry A, Hausfater P. Is procalcitonin a useful biomarker for the risk stratification of facial cellulitis? J Craniomaxillofac Surg 2016; 44: 995–997. https://doi.org/10.1016/j.jcms.2016.05.023
- Brindle RJ, Ijaz A, Davies P. Procalcitonin and cellulitis: correlation of procalcitonin blood levels with measurements of severity and outcome in patients with limb cellulitis. Biomarkers 2019; 24: 127–130. https://doi.org/10.1080/1354750X.2018.1501764
- Erturk A, Cure MC, Cure E, Kurt A, Cicek AC, Yuce S. Clinical potential of resistin as a novel prognostic biomarker for cellulitis. Exp Ther Med 2015; 9: 1875–1880. https://doi.org/10.3892/etm.2015.2311
- Ang T, Juniat V, Shapira Y, Selva D. Systemic inflammatory markers differentiate between orbital cellulitis and non-specific orbital inflammation. Orbit 2023; 42: 245–250. https://doi.org/10.1080/01676830.2022.2087233
- González-Jiménez P, Méndez R, Latorre A, Piqueras M, Balaguer-Cartagena MN, Moscardó A, et al. Neutrophil extracellular traps and platelet activation for identifying severe episodes and clinical trajectories in COVID-19. Int J Mol Sci 2023; 24: 6690. https://doi.org/10.3390/ijms24076690
- Valpione S, Gremel G, Mundra P, Middlehurst P, Galvani E, Girotti MR, et al. Plasma total cell-free DNA (cfDNA) is a surrogate biomarker for tumour burden and a prognostic biomarker for survival in metastatic melanoma patients. Eur J Cancer 2018; 88: 1–9. https://doi.org/10.1016/j.ejca.2017.10.029
- Eichenberger EM, de Vries CR, Ruffin F, Sharma-Kuinkel B, Park L, Hong D, et al. Microbial cell-free DNA identifies etiology of bloodstream infections, persists longer than conventional blood cultures, and its duration of detection is associated with metastatic infection in patients with Staphylococcus aureus and gram-negative bacteremia. Clin Infect Dis 2022; 74: 2020–2027. https://doi.org/10.1093/cid/ciab742
- Jing Q, Leung CHC, Wu AR. Cell-free DNA as biomarker for sepsis by integration of microbial and host information. Clin Chem 2022; 68: 1184–1195. https://doi.org/10.1093/clinchem/hvac097
- De Luca G, Lev PR, Camacho MF, Goette NP, Sackmann F, Castro Ríos MA, et al. High cell-free DNA is associated with disease progression, inflammasome activation and elevated levels of inflammasome-related cytokine IL-18 in patients with myelofibrosis. Front Immunol 2023; 14: 1161832. https://doi.org/10.3389/fimmu.2023.1161832
- Urosevic N, Merritt AJ, Inglis TJJ. Plasma cfDNA predictors of established bacteraemic infection. Access Microbiol 2022; 4: acmi000373. https://doi.org/10.1099/acmi.0.000373
- Johnston DGW, Hambly R, Kearney N, Tobin DJ, Kirby B. Cell-free DNA is elevated in the serum of patients with hidradenitis suppurativa. J Dermatol 2023; 50: 271–273. https://doi.org/10.1111/1346-8138.16676
- Ishino T, Myangat TM, Sawamura S, Kajihara I, Shimada S, Kanemaru H, et al. Elevation of cell-free DNA in patients with clinically amyopathic dermatomyositis. J Dermatol 2023; 50: e189–e191. https://doi.org/10.1111/1346-8138.16714
- Gray ES, Rizos H, Reid AL, Boyd SC, Pereira MR, Lo J, et al. Circulating tumor DNA to monitor treatment response and detect acquired resistance in patients with metastatic melanoma. Oncotarget 2015; 6: 42008–42018. https://doi.org/10.18632/oncotarget.5788
- Coimbra S, Catarino C, Costa E, Oliveira H, Figueiredo A, Rocha-Pereira P, et al. Circulating cell-free DNA levels in Portuguese patients with psoriasis vulgaris according to severity and therapy. Br J Dermatol 2014; 170: 939–942. https://doi.org/10.1111/bjd.12738
- Goldshtein H, Hausmann MJ, Douvdevani A. A rapid direct fluorescent assay for cell-free DNA quantification in biological fluids. Ann Clin Biochem 2009; 46: 488–494. https://doi.org/10.1258/acb.2009.009002
- Fleckenstein J, Neuberger EWI, Bormuth P, Comes F, Schneider A, Banzer W, et al. Investigation of the sympathetic regulation in delayed onset muscle soreness: results of an RCT. Front Physiol 2021; 12: 697335. https://doi.org/10.3389/fphys.2021.697335
- Kostyuk SV, Porokhovnik LN, Ershova ES, Malinovskaya EM, Konkova MS, Kameneva LV, et al. Changes of KEAP1/NRF2 and IKB/NF-κB expression levels induced by cell-free DNA in different cell types. Oxid Med Cell Longev 2018; 2018: 1052413. https://doi.org/10.1155/2018/1052413
- Kanngiesser M, Häussler A, Myrczek T, Küsener N, Lim HY, Geisslinger G, et al. Inhibitor kappa B kinase beta dependent cytokine upregulation in nociceptive neurons contributes to nociceptive hypersensitivity after sciatic nerve injury. J Pain 2012; 13: 485–497. https://doi.org/10.1016/j.jpain.2012.02.010
- Roth S, Wernsdorf SR, Liesz A. The role of circulating cell-free DNA as an inflammatory mediator after stroke. Semin Immunopathol 2023; 45: 411–425. https://doi.org/10.1007/s00281-023-00993-5
- Lacagnina MJ, Watkins LR, Grace PM. Toll-like receptors and their role in persistent pain. Pharmacol Ther 2018; 184: 145–158. https://doi.org/10.1016/j.pharmthera.2017.10.006
- Hu Y, Chen Y, Liu T, Zhu C, Wan L, Yao W. The bidirectional roles of the cGAS-STING pathway in pain processing: cellular and molecular mechanisms. Biomed Pharmacother 2023; 163: 114869. https://doi.org/10.1016/j.biopha.2023.114869
- Lo YMD, Zhang J, Leung TN, Lau TK, Chang AMZ, Hjelm NM. Rapid clearance of fetal DNA from maternal plasma. Am J Human Genet 1999; 64: 218–224. https://doi.org/10.1086/302205
- Halpern D, Cohen A, Sharon N, Krieger Y, Silberstein E, Michael T, et al. Admission circulating cell-free DNA levels as a prognostic factor in pediatric burns. Biomed Res Int 2022; 2022: 5004282. https://doi.org/10.1155/2022/5004282
- Rhodes A, Cecconi M. Cell-free DNA and outcome in sepsis. Crit Care 2012; 16: 170. https://doi.org/10.1186/cc11508
- Gordon CB, Zenaty Y, Ollech A, Test G, Douvdevani A, Horev A. Cell-free DNA levels in herpes zoster: a cross-sectional longitudinal study. Acta Derm Venereol 2025; 105: adv42137. https://doi.org/10.2340/actadv.v105.42137
- Yadav K, Krzyzaniak N, Alexander C, Scott AM, Clark J, Glasziou P, et al. The impact of antibiotics on clinical response over time in uncomplicated cellulitis: a systematic review and meta-analysis. Infection 2022; 50: 859–871. https://doi.org/10.1007/s15010-022-01842-7
- Bruun T, Oppegaard O, Hufthammer KO, Langeland N, Skrede S. Early response in cellulitis: a prospective study of dynamics and predictors. Clin Infect Dis 2016; 63: 1034–1041. https://doi.org/10.1093/cid/ciw463
- van ’t Erve I, Medina JE, Leal A, Papp E, Phallen J, Adleff V, et al. Metastatic colorectal cancer treatment response evaluation by ultra-deep sequencing of cell-free DNA and matched white blood cells. Clin Cancer Res 2023; 29: 899–909. https://doi.org/10.1158/1078-0432.CCR-22-2538
- Fernandez-Garcia D, Hills A, Page K, Hastings RK, Toghill B, Goddard KS, et al. Plasma cell-free DNA (cfDNA) as a predictive and prognostic marker in patients with metastatic breast cancer. Breast Cancer Res 2019; 21: 149. https://doi.org/10.1186/s13058-019-1235-8
- Syeda MM, Wiggins JM, Corless BC, Long GV, Flaherty KT, Schadendorf D, et al. Circulating tumour DNA in patients with advanced melanoma treated with dabrafenib or dabrafenib plus trametinib: a clinical validation study. Lancet Oncol 2021; 22: 370–380. https://doi.org/10.1016/S1470-2045(20)30726-9
- García-Escobar A, Vera-Vera S, Tébar-Márquez D, Rivero-Santana B, Jurado-Román A, Jiménez-Valero S, et al. Neutrophil-to-lymphocyte ratio an inflammatory biomarker, and prognostic marker in heart failure, cardiovascular disease and chronic inflammatory diseases: new insights for a potential predictor of anti-cytokine therapy responsiveness. Microvasc Res 2023; 150: 104598. https://doi.org/10.1016/j.mvr.2023.104598
- Yuwono NL, Warton K, Ford CE. The influence of biological and lifestyle factors on circulating cell-free DNA in blood plasma. Elife 2021; 10: e69679. https://doi.org/10.7554/eLife.69679
- Yao W, Mei C, Nan X, Hui L. Evaluation and comparison of in vitro degradation kinetics of DNA in serum, urine and saliva: a qualitative study. Gene 2016; 590: 142–148. https://doi.org/10.1016/j.gene.2016.06.033
- Plebani M. Why C-reactive protein is one of the most requested tests in clinical laboratories? Clin Chem Lab Med CCLM 2023; 61: 1540–1545. https://doi.org/10.1515/cclm-2023-0086
- Whitaker CM, Low S, Gorbachova T, Raphael JS, Williamson C. Imaging and laboratory workup for hand infections. Hand Clin 2020; 36: 285–299. https://doi.org/10.1016/j.hcl.2020.03.002
- Brindle R, Davies P. Procalcitonin and cellulitis: cohort study of the correlation of procalcitonin blood levels with the severity and outcome in patients with limb cellulitis. Open Forum Infect Dis 2016; 3: 231. https://doi.org/10.1093/ofid/ofw172.98
- Schuetz P, Albrich W, Mueller B. Procalcitonin for diagnosis of infection and guide to antibiotic decisions: past, present and future. BMC Med 2011; 9: 107. https://doi.org/10.1186/1741-7015-9-107
- Nesselbush MC, Luca BA, Jeon YJ, Jabara I, Meador CB, Garofalo A, et al. An ultrasensitive method for detection of cell-free RNA. Nature New Biol 2025; 641: 759–768. https://doi.org/10.1038/s41586-025-08834-1