ORIGINAL REPORT
Resource Use and Cost Comparison of Mohs Micrographic Surgery vs Traditional Surgery for High-risk Facial Basal Cell Carcinoma
Julia FOUGELBERG1,2 , Lovisa KLEIN1, Emelie PAULI3, Ann-Marie WENNBERG LARKÖ1,2* and Hannah CEDER1,2
1Department of Dermatology and Venereology, Institute of Clinical Sciences, Sahlgrenska Academy, University of Gothenburg, Gothenburg, Sweden, 2Region Västra Götaland, Sahlgrenska University Hospital, Department of Dermatology and Venereology, Gothenburg, Sweden, and 3Region Västra Götaland, Sahlgrenska University Hospital, Gothia Forum for Clinical Trials, Gothenburg, Sweden
Corr: Ann-Marie Wennberg Larkö, Department of Dermatology, Gröna stråket 16, Sahlgrenska University Hospital, SE-413 45 Gothenburg, Sweden. *Email: ann-marie.wennberg@gu.se
Key words: Mohs micrographic surgery; keratinocyte cancer; non-melanoma skin cancer; basal cell carcinoma; health resources; cost-benefit analysis.
Citation: Acta Derm Venereol 2026; 106: adv-2025-0263. DOI: https://doi.org/10.2340/actadv.v106.adv-2025-0263.
Copyright: © The Authors 2026. Published by MJS Publishing, on behalf of the Society for Publication of Acta Dermato-Venereologica. This is an Open Access article distributed under the terms of the Creative Commons Attribution 4.0 International License (https://creativecommons.org/licenses/by/4.0/).
Submitted: Dec 15, 2025. Accepted after revision: Jun 17, 2026.
Published: Jul 9, 2026.
Competing interests and funding: The authors have no conflicts of interest to declare.
The study used pseudonymized individual-level health data from the Swedish regional Vega database, approved by the ethics board and data controller. Due to legal and GDPR-related restrictions, these sensitive data cannot be publicly shared. The data that support the findings of this study are available from the corresponding author upon reasonable request.
Approval of the study was granted by the Swedish Review Authority in Gothenburg (approval and amendment numbers: 2024-04715-01, 2024-06247-02 and 2024-07863-02).
High-risk facial basal cell carcinomas are preferably treated with Mohs micrographic surgery, but despite its documented benefits, it remains underused in Sweden. The aim of this study was to evaluate healthcare resource utilization and direct costs for patients with high-risk facial basal cell carcinomas treated with Mohs micrographic surgery compared with traditional surgical excision. In this retrospective registry study, all patients undergoing Mohs micrographic surgery or surgical excision at Sahlgrenska University Hospital between 2020 and 2024 were included, supplemented by regional healthcare data from the Vega registry, to assess long-term healthcare use up to 10 years after primary treatment. Mohs micrographic surgery was associated with higher initial costs than surgical excision but a slower accumulation of costs over time. Patients initially treated with surgical excision who later required Mohs micrographic surgery incurred the highest total costs, often after multiple prior procedures. These findings indicate that although Mohs micrographic surgery is costlier initially, early access prevents the substantial downstream costs associated with treatment failure. Primary Mohs micrographic surgery is a cost-efficient strategy for high-risk facial basal cell carcinomas and should be used more frequently in order to enable better utilization of resources and improved outcomes for the patient.
SIGNIFICANCE
Mohs micrographic surgery for high-risk facial basal cell carcinomas is underused in the Nordic countries, probably due to limited access but also due to higher resource utilization and costs. This study demonstrates that Mohs micrographic surgery, despite its higher initial cost, reduces the need for subsequent interventions and ongoing healthcare utilization. These findings clarify the long-term economic and clinical value of selecting Mohs surgery at an early stage. By providing evidence for more efficient allocation of healthcare resources, the study contributes to improved treatment strategies and supports policies that enhance patient outcomes while reducing overall societal costs.
INTRODUCTION
Basal cell carcinoma (BCC) represents a growing public health concern in fair-skinned populations, with over 71,000 new cases reported in Sweden in 2023 (1, 2). The rising incidence, particularly among high-risk subtypes underscores the need for cost-effective treatments that reduce morbidity and patient suffering (3). High-risk facial BCCs are preferably treated with Mohs micrographic surgery (MMS), which offers superior cure rates and tissue-sparing benefits (4). While MMS is widely practiced in the USA and parts of Europe, its use remains limited in Scandinavia (5, 6, 7, 8).
In Sweden, all BCC tumours are classified by histopathological subtype according to the Sabbatsberg-model. This system categorizes tumours into 3 risk groups: (i) “low risk” (Glas type IA and IB), (ii) “medium risk” (Glas type II) and (iii) “high risk” (Glas type III). Type II includes less aggressive infiltrative or micronodular BCCs, with clearly demarcated borders and invasion depth limited to the dermis. Type III can have infiltrative, micronodular, morpheaform or basosquamous growth patterns, with perineural and/or perivascular growth. The tumour borders are irregular without any clear demarcation, with tumour nests arranged in small (1–2 cells thick) irregular cords of basaloid cells, extending into the dermis or even subcutis, muscle, cartilage and/or bone (9). In this paper, type II and III BCCs (according to the Swedish classification) are referred to as high-risk subtypes due to their shared features.
There are many challenges in the management of high-risk facial BCCs. These include diagnostic difficulties across medical specialties, limited access to MMS, maybe because of insufficient knowledge of its indications and benefits but also long waiting times (up to 1 year in Sweden). Unreliable preoperative biopsies that can misguide clinical decision-making are also a challenge (10, 11, 12). Together, these factors contribute to suboptimal treatments, leading to high rates of incomplete excisions (8, 13, 14, 15) and recurrences (16, 17, 18, 19, 20). Traditional surgery (surgical excision, SE) for high-risk subtypes requires wider margins (5–15 mm) (4, 7, 21, 22, 23) and several studies report that 25–55% of high-risk facial BCCs are incompletely excised with SE (8, 13, 14, 15). The conventional technique for histopathological examination (“bread-loafing”) has limited coverage, only examining 0.1–2% of the surgical margin, compared to MMS’s 100% margin assessment (5, 16, 20, 21, 24, 25). Thus, MMS allows for effective detection of subclinical extensions (i.e. tumour growth invisible to the naked eye during clinical examination), while saving maximum healthy tissue (26).
Although MMS is not a cutting-edge method (27), its rarely performed in Scandinavia due to limited resources (5, 16). In Sweden, MMS is reserved for high-risk facial BCCs (28). Despite this, only about 5% of eligible patients receive MMS. Currently, the capacity is confined to three centres (Stockholm, Gothenburg and Lund), which together perform approximately 600 procedures annually. Given that at least 11,000 high-risk BCCs are diagnosed per year (3), there is a substantial gap between demand and MMS capacity. This gap might be due to this limit of access but probably also due to higher resource utilization and costs. Data on the cost-effectiveness of MMS vs SE are limited, with no consensus on which surgical method offers better value for the money. To the best of our knowledge, no such study has been conducted in Scandinavia.
Objectives
The aim of this study was to explore the health economic potential of MMS as a treatment for high-risk facial BCCs. The overall objective was to compare health care resource utilization for patients who received primary MMS and those who primary underwent traditional surgery or other treatments. Also, we wanted to analyse potential differences in terms of gender, age, comorbidity and geographical residence for those who underwent different primary treatments.
MATERIALS AND METHODS
This retrospective registry study was conducted at the Department of Dermatology at Sahlgrenska University Hospital, Gothenburg, Sweden. Consecutive patients treated with MMS or SE for high-risk facial BCC (type II and III according to the Swedish classification) between 2020 and 2024 were included. The study was approved by The Swedish Ethical Review Authority.
Healthcare utilization data were obtained from the Vega registry, Region Västra Götaland’s database for healthcare resource use. Diagnoses were identified using International Classification of Diseases (ICD-10) codes and procedures using the Swedish Classification of Health Interventions (KVÅ codes).
The study population comprised 2 cohorts: (i) patients registered in the local MMS registry at our department and (ii) patients identified in the Vega registry with high-risk facial BCC (ICD-10: C443C, C443D, C443E) referred for MMS or treated with SE or other destructive treatments (e.g. cryosurgery, curettage and electrodessication) (Table I). Data from 2014 to 2024 enabled retrospective assessment of treatment pathways before MMS vs MMS as primary treatment.
Table I. ICD-10 codes used to define cohort 2
| ICD-10 code | Description |
|---|---|
| C441-C | Malignant neoplasm of skin of lip (excl. vermilion border) |
| C441-D | Malignant neoplasm of skin of external ear |
| C442-D | Malignant neoplasm of skin of eyelid, including canthus |
| C443-C | Malignant neoplasm of skin of nose |
| C443-D | Malignant neoplasm of skin of scalp and neck |
| C443-E | Malignant neoplasm of skin of other and unspecified parts of face |
The following variables were collected; age, sex, date of diagnosis, date of surgery, tumour location, histopathological subtype, healthcare utilization and cost per patient (CPP). Patients were categorized into MMS, SE or destructive treatment groups based on KVÅ codes and ICD-10 codes (Table II). Inclusion was restricted to patients considered potentially eligible for MMS.
Table II. Classification of treatment based on KVÅ codes
| Treatment | KVÅ codes | Description |
|---|---|---|
| Surgical excision (SE) | QAE10 without ZQX00 | Surgical excision in the head and neck region |
| Mohs micrographic surgery (MMS) | QAE10 in combination with ZQX00 | Surgical excision in the head and neck region combined with micrographic technique (Mohs surgery) |
| Other treatments | CAW99 | Other orbital surgery |
| CBB30 | Excision of tumour or local lesion in eyelid | |
| CBB32 | Destruction of local lesion in eyelid | |
| CBB50 | Excision of tumour/lesion in eyelid with reconstruction using graft or flap | |
| CBB99 | Other removal of tumour/lesion in eyelid | |
| CBD10 | Reconstruction of eyelid with graft or flap | |
| CBD11 | Opening of flap or eyelid reconstruction | |
| DHB00 | Excision from external nose, e.g., tumour | |
| DHW99 | Other nasal surgery | |
| DQ004 | Photodynamic therapy (PDT) | |
| DV070 | Radiotherapy | |
| QAA25 | Destruction of skin lesion in head and neck region | |
| QAE00 | Excision in head and neck region | |
| QXA25 | Destruction of skin lesion, unspecified region | |
| ZXC00 | Use of diathermy | |
| ZXC50 | Use of cryotherapy | |
| ZXC65 | Curettage | |
| ZXH20 | Nerve block anaesthesia | |
| ZZA50 | Free full-thickness skin graft |
Statistical analysis
Data were analysed using Stata version 17.0 (StataCorp, College Station, Texas, USA) in collaboration with Gothia Forum health economists. Missing CPP values were estimated using Diagnosis Related Group (DRG) weights and the 2024 regional base tariff. Costs were adjusted to 2024 SEK using the Swedish Consumer Price Index and converted to EUR using the average exchange rate for 2024 (1EUR=11.43) from the Swedish Central Bank (Riksbanken).
Costs were analysed at 1, 3, 5 and 10 years after primary treatment. To address baseline differences between treatment groups, multivariable linear regression analyses were performed adjusting for age, sex, comorbidity burden and municipal category.
RESULTS
Demographics
Among 5,132 patients with high-risk facial BCC, 2% received initial SE followed by MMS (n=92), 83% were treated with SE without MMS (n=4,279), and 15% underwent primary MMS (n=761) (Fig. 1).
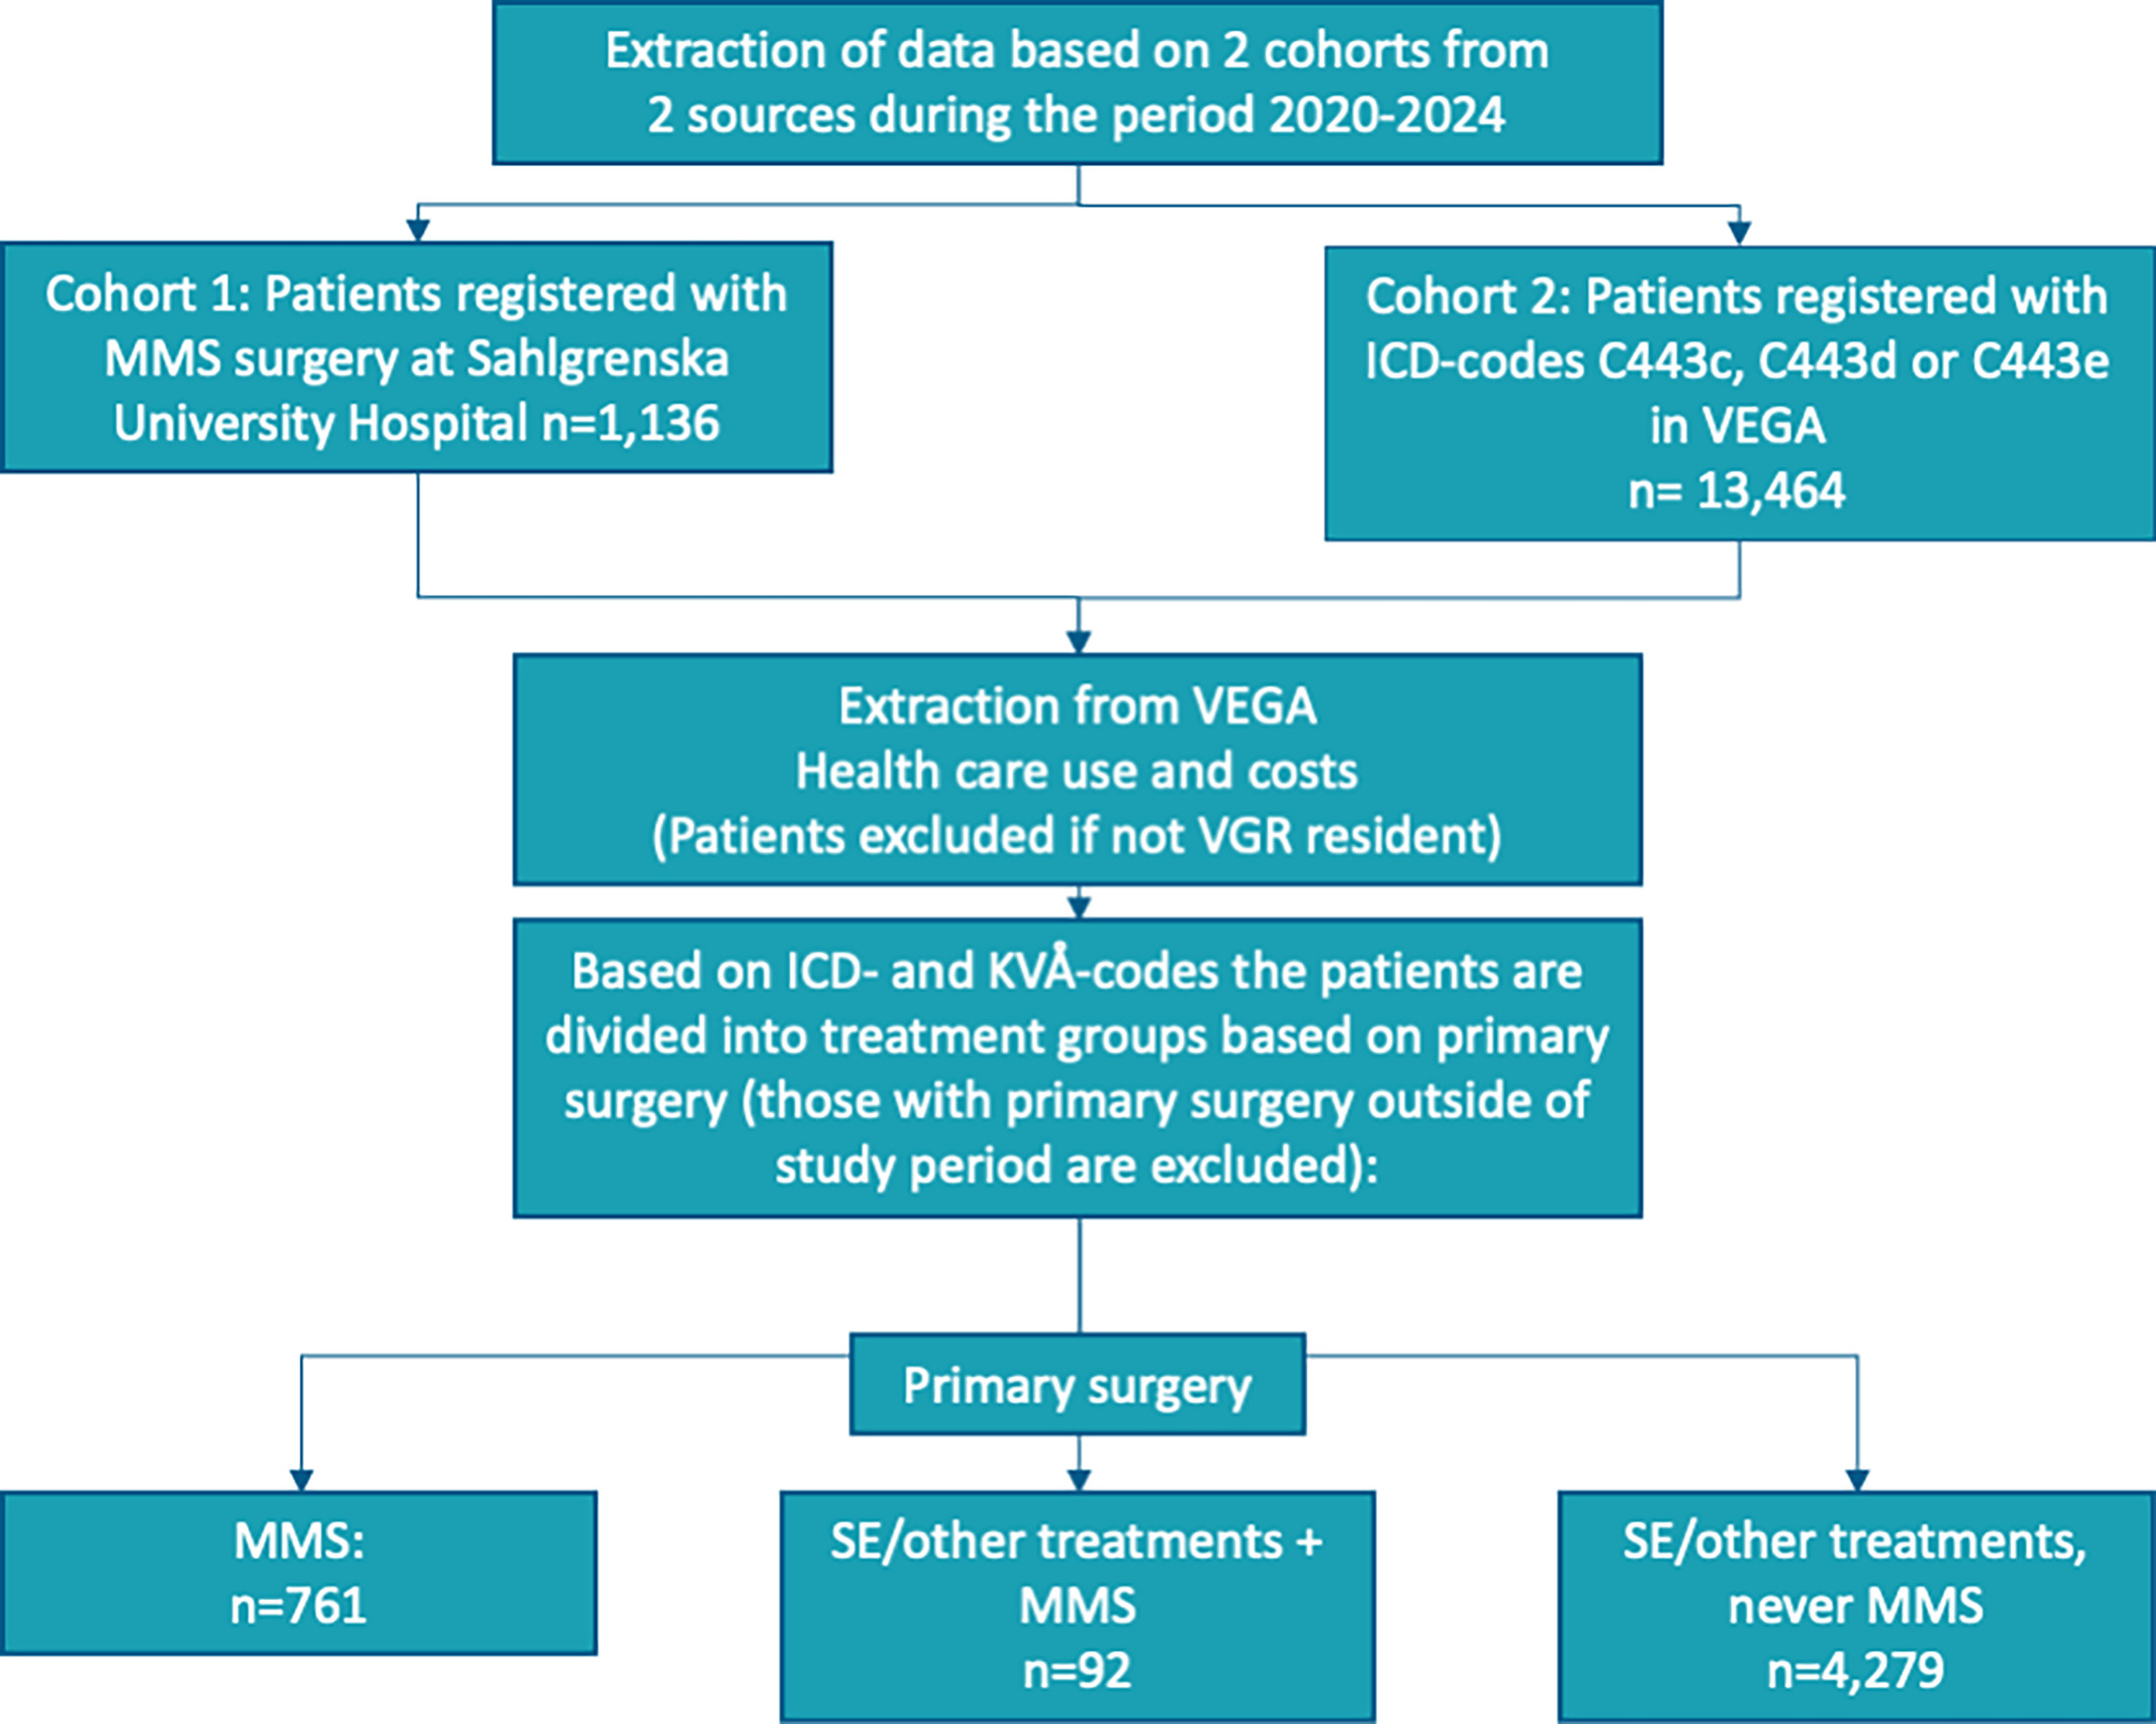
Fig. 1. Flow chart of extraction process.
Patients in the SE-to-MMS group were slightly younger (median age of 71 years, IQR 63–77), compared with the SE-only group (76 years, IQR 68–82) and the primary MMS group (72 years, IQR 61–78) (Table III). The SE-only group had a higher proportion of patients ≥80 years (34%), whereas the MMS group had a greater proportion of patients aged 50–69 years.
| Patient group | SE/other, then MMS n=91 |
SE/other, never MMS n=4,282 |
Primary MMS n=766 |
|||
|---|---|---|---|---|---|---|
| Age, years, median (IQR), range | 71 (63–77, 42–89) | 76 (68–82, 23–105) | 72 (61–78, 17–92) | |||
| Age categories | n | % | n | % | n | % |
| 20–29 y | − | − | 5.0 | 0.1 | 2.0 | 0.3 |
| 30–39 y | − | − | 32.0 | 0.8 | 20.0 | 2.6 |
| 40–49 y | 9.0 | 9.9 | 143.0 | 3.3 | 49.0 | 6.4 |
| 50–59 y | 7.0 | 7.7 | 355.0 | 8.3 | 106.0 | 13.9 |
| 60–69 y | 24.0 | 26.4 | 719.0 | 16.8 | 156.0 | 20.5 |
| 70–79 y | 38.0 | 41.8 | 1,560.0 | 36.5 | 286.0 | 37.5 |
| 80–89 y | 13.0 | 14.3 | 1,233.0 | 28.8 | 137.0 | 18.0 |
| 90–99 y | − | − | 229.0 | 5.4 | 6.0 | 0.8 |
| ≥100y | − | − | 4.0 | 0.1 | − | − |
| Sex | ||||||
| Male | 38.0 | 41.8 | 2,023.0 | 47.3 | 302.0 | 39.6 |
| Female | 53.0 | 58.2 | 2,256.0 | 52.7 | 461.0 | 60.4 |
| Home municipality* | ||||||
| Group A: large cities/close to large city | 74.0 | 81.3 | 831.0 | 37.7 | 594.0 | 77.9 |
| Group B: medium-sized towns | 14.0 | 15.4 | 911.0 | 41.3 | 84.0 | 11.0 |
| Group C: smaller towns/rural | 3.0 | 3.3 | 464.0 | 21.0 | 85.0 | 11.1 |
| Comorbidities - ICD-10-chapters** | ||||||
| A: Certain infectious and parasitic diseases | − | − | − | − | − | − |
| B: Certain infectious and parasitic diseases (cont.) | − | − | 2.0 | 0.1 | − | − |
| C: Neoplasms (high-risk BCC excluded) | 5.0 | 5.3 | 372.0 | 8.2 | 19.0 | 2.4 |
| D: Diseases of the blood and blood-forming organs | 2.0 | 2.2 | 277.0 | 6.2 | 21.0 | 2.7 |
| E: Endocrine, nutritional and metabolic diseases | 2.0 | 2.2 | 51.0 | 1.2 | 2.0 | 0.3 |
| F: Mental and behavioural disorders | − | − | 19.0 | 0.4 | − | − |
| G: Diseases of the nervous system | − | − | 17.0 | 0.4 | − | − |
| H: Diseases of the eye, ear, etc. | − | − | 15.0 | 0.4 | − | − |
| I: Diseases of the circulatory system | 5.0 | 5.2 | 114.0 | 2.6 | 5.0 | 0.7 |
| J: Diseases of the respiratory system | − | − | 21.0 | 0.5 | 2.0 | 0.3 |
| K: Diseases of the digestive system | − | − | 4.0 | 0.1 | − | − |
| L: Diseases of the skin and subcutaneous tissue | 7.0 | 7.2 | 631.0 | 13.4 | 22.0 | 2.8 |
| M: Diseases of the musculoskeletal system | − | − | 13.0 | 0.3 | 1.0 | 0.1 |
| N: Diseases of the genitourinary system | 1.0 | 1.1 | 13.0 | 0.3 | − | − |
| O: Pregnancy, childbirth and the puerperium | − | − | − | − | − | − |
| Q: Congenital malformations, deformations and chromosomal abnormalities | − | − | 3.0 | 0.1 | − | − |
| R: Symptoms, signs and abnormal clinical findings | 1.0 | 1.1 | 19.0 | 0.4 | 2.0 | 0.3 |
| Z: Factors influencing health status | 6.0 | 6.1 | 148.0 | 3.4 | 15.0 | 1.9 |
|
*Based on SALAR’s definition from 2023: A. Large cities and municipalities near large cities, B. Medium-sized towns and municipalities near medium-sized towns, C. Smaller towns/urban areas and rural municipalities. **Based on other diagnoses registered at time of primary treatment. |
||||||
Women comprised 58% of the SE-to-MMS group, 53% of the SE-only group, and 60% of the primary MMS group. Both MMS groups were more frequently urban residents (81% and 78% respectively), compared with 38% in the SE-only group.
Co-morbidity was generally lower among MMS-treated patients. The SE-only group had the highest prevalence of comorbid conditions, particularly skin diseases (13%), neoplasms (8%) and blood disorders (6%), whereas primary MMS patients had the lowest overall comorbidity rates. Overall, MMS-treated were younger, more often urban, and had fewer comorbidities than SE-only patients.
Resource use and costs
Patients undergoing SE prior to MMS represented the most resource-intensive subgroup, with a mean of 3 prior SE procedures (Table IV).
Table IV. Total treatment costs in SEK for patients undergoing one to six failed SEs before MMS
| Number of SEs | Cost for SEs (€) | Cost for MMS (€) | Total treatment cost |
|---|---|---|---|
| 1 | 685 | 1,889 | 2,574 |
| 2 | 1,370 | 1,889 | 3,256 |
| 3 | 2,055 | 1,889 | 3,944 |
| 4 | 2,740 | 1,889 | 4,629 |
| 5 | 3,425 | 1,889 | 5,314 |
| 6 | 4,110 | 1,889 | 5,999 |
Table V presents cumulative costs up to 10 years. In the first 10 year, costs were highest for primary MMS (€ 1,889) and lowest for SE-only treatment (€ 685). Over time, costs increased in all groups, but most markedly among patients who ultimately required MMS after SE, reaching € 3,853 at 10 years. The SE-only group showed a gradual increase from € 685 to € 1,892, while primary MMS costs rose more moderately to € 2,856 at 10 years. Specialist outpatient care accounted for the majority of total costs across all groups, whereas inpatient and primary care costs remained low.
Table V. Mean direct healthcare cost for high-risk BCC related healthcare per person in SEK, mean and 95% CI
| Cost per patient | |||||||||
|---|---|---|---|---|---|---|---|---|---|
| Primary surgery | SE/other, then MMS | SE/other, never MMS | MMS | ||||||
| Up to 1 year following primary surgery | n=92 | n=4,279 | n=761 | ||||||
| EUR | 95% CI | EUR | 95% CI | EUR | 95% CI | ||||
| Primary care | 25 | 4 | 46 | 38 | 35 | 42 | 48 | 34 | 61 |
| Outpatient spec | 798 | 636 | 961 | 615 | 598 | 632 | 1,841 | 1,808 | 2,137 |
| Inpatient | – | 32 | 13 | 50 | – | ||||
| Mean total per patient | 823 | 660 | 986 | 685 | 658 | 712 | 1,889 | 1,853 | 1,925 |
| Up to 3 years following primary surgery | n=35 | n=719 | n=68 | ||||||
| Primary care | 67 | 10 | 124 | 108 | 91 | 125 | 138 | 59 | 216 |
| Outpatient spec | 1,094 | 811 | 1,377 | 869 | 808 | 931 | 2,352 | 2,085 | 2,619 |
| Inpatient | – | 92 | 33 | 151 | – | ||||
| Mean total per patient | 1,161 | 845 | 1,477 | 1,069 | 966 | 1,173 | 2,490 | 2,216 | 2,764 |
| Up to 5 years following primary surgery | n=23 | n=418 | n=34 | ||||||
| Primary care | 139 | 38 | 241 | 129 | 106 | 152 | 109 | -15 | 232 |
| Outpatient spec | 1,315 | 884 | 1,747 | 1,005 | 802 | 1,208 | 2,445 | 2,048 | 2,843 |
| Inpatient | – | 52 | 0 | 104 | – | ||||
| Mean total per patient | 1,454 | 953 | 1,956 | 1,186 | 933 | 1,438 | 2,554 | 3,001 | 2,981 |
| Up to 10 years following primary surgery | n=12 | n=220 | n=12 | ||||||
| Primary care | 231 | 52 | 410 | 181 | 136 | 227 | 62 | 3 | 121 |
| Outpatient spec | 1,733 | 939 | 2 527 | 1,498 | 1,105 | 1,890 | 2,794 | 1,851 | 3,736 |
| Inpatient | – | 213 | -2 | 429 | – | ||||
| Mean total per patient | 1,964 | 1,054 | 2,874 | 1,892 | 1,364 | 2,420 | 2,856 | 1,910 | 3,802 |
| Mean total per patient (including MMS for group 1) | 3,853 | ||||||||
Confidence intervals widened with longer follow-up, particularly in the MMS group, reflecting smaller sample sizes. In adjusted analyses (Table VI), primary MMS was associated with higher costs at 1 and 3 years compared with SE, but differences were attenuated and no longer significant at 5 and 10 years. Adjustment for age and comorbidity slightly influenced estimates, whereas sex and municipal category were not significant predictors.
Table VI. Multivariable regression analysis adjusting for age, sex, comorbidity and municipal category
| Time horizon | SE/other never MMS | Primary MMS | Age | Female | Comorbidity index | R² | N |
|---|---|---|---|---|---|---|---|
| 1 year | −186* (−364 to −8) | 1,036*** (854 to 1,217) | 1.47 (p=0.058) | NS | 72* (6 to 139) | 0.20 | 5,128 |
| 3 years | −251 (NS) | 1,060*** (609 to 1,510) | 8.47** | NS | NS | 0.07 | 819 |
| 5 years | −600* (−1,174 to −27) | 576 (p=0.086) | NS | NS | NS | 0.03 | 474 |
| 10 years | NS | NS | NS | NS | (trend) p=0.078 | 0.03 | 244 |
|
Coefficients represent adjusted mean cost differences (EUR). Robust standard errors used. *p<0.05, **p<0.01, ***p<0.001. NS: not statistically significant. |
|||||||
DISCUSSION
Our findings indicate that the choice of surgical treatment pathway for high-risk facial BCCs has important implications for healthcare costs and resource use. Primary MMS was associated with higher initial healthcare costs (€ 1,889), consistent with its more resource-intensive nature. However, cost accumulation over time was slower compared with SE-based strategies, suggesting reduced need for subsequent interventions.
In contrast, SE or other procedures had lower upfront costs (€ 685) but showed a gradual increase, reaching € 1,892 at 10 years. The SE-to-MMS group had the highest cumulative costs (€ 3,853), reflecting repeated procedures and subsequent MMS. These findings highlight that treatment pathways with low initial costs may result in higher long-term expenditure when re-interventions are required.
Adjusted analyses indicated that differences in age, comorbidity and municipal category did not materially explain cost differences between treatment groups. However, long-term estimates should be interpreted with caution due to smaller sample sizes and wide confidence intervals.
The economic value of MMS depends on the proportion of patients requiring additional surgery after initial SE. In our cohort, 17% underwent MMS (15% primary, 2% after SE). Data from our Mohs registry show that at least 30% of the patients received other treatments before MMS (8). Previous studies have reported incomplete excision rates of 25–55% for high-risk facial BCCs, suggesting that the true proportion requiring MMS may be higher.
The most costly pathway was SE followed by MMS, while successful primary SE was the least costly. This supports that treatment failure has substantial economic consequences. However, our estimate of a “break-even” threshold (>50% MMS requirement) should be interpreted cautiously, as it is based on simplified cost assumptions and direct costs only. Indirect costs such as travel time, productivity loss and psychosocial burden were not captured. Similarly, clinical outcomes such as recurrence and re-interventions were not included. These limitations are inherent to registry-based cost analyses and likely underestimate the relative value of MMS.
Previous literature shows conflicting results regarding the cost-effectiveness of MMS vs SE, reflecting differences in healthcare systems, follow-up structures and study design (29, 30, 31, 32). Most studies originate from insurance-based systems, limiting comparability with Nordic healthcare settings.
Patients treated with MMS were younger, more often female, and more urban, while SE-only patients were older and had higher comorbidity burden. Although these factors influenced short-term costs, they did not significantly alter between-group cost differences.
Moreover, repeated interventions also increase indirect costs, including patient time, travel and productivity loss and other important factors such as cosmetic or functional impairment and psychological burden. This study focuses on healthcare costs and does also not include clinical outcomes such as recurrence or re-interventions. These aspects were not captured in this register-based analysis. Accounting for these factors would likely favour MMS as the more cost-favourable option from a health economic perspective (Fig. 2). Most prior studies have typically used quality-adjusted life years (QALYs) as the primary outcome measure (33), whereas we focused on actual healthcare costs and resource use. Incorporating factors that are not valued in monetary terms – such as reduced patient suffering, saved time for the patient, decreased anxiety and concern about recurrence and optimal cosmetic outcome – would more clearly demonstrate the overall value of MMS.
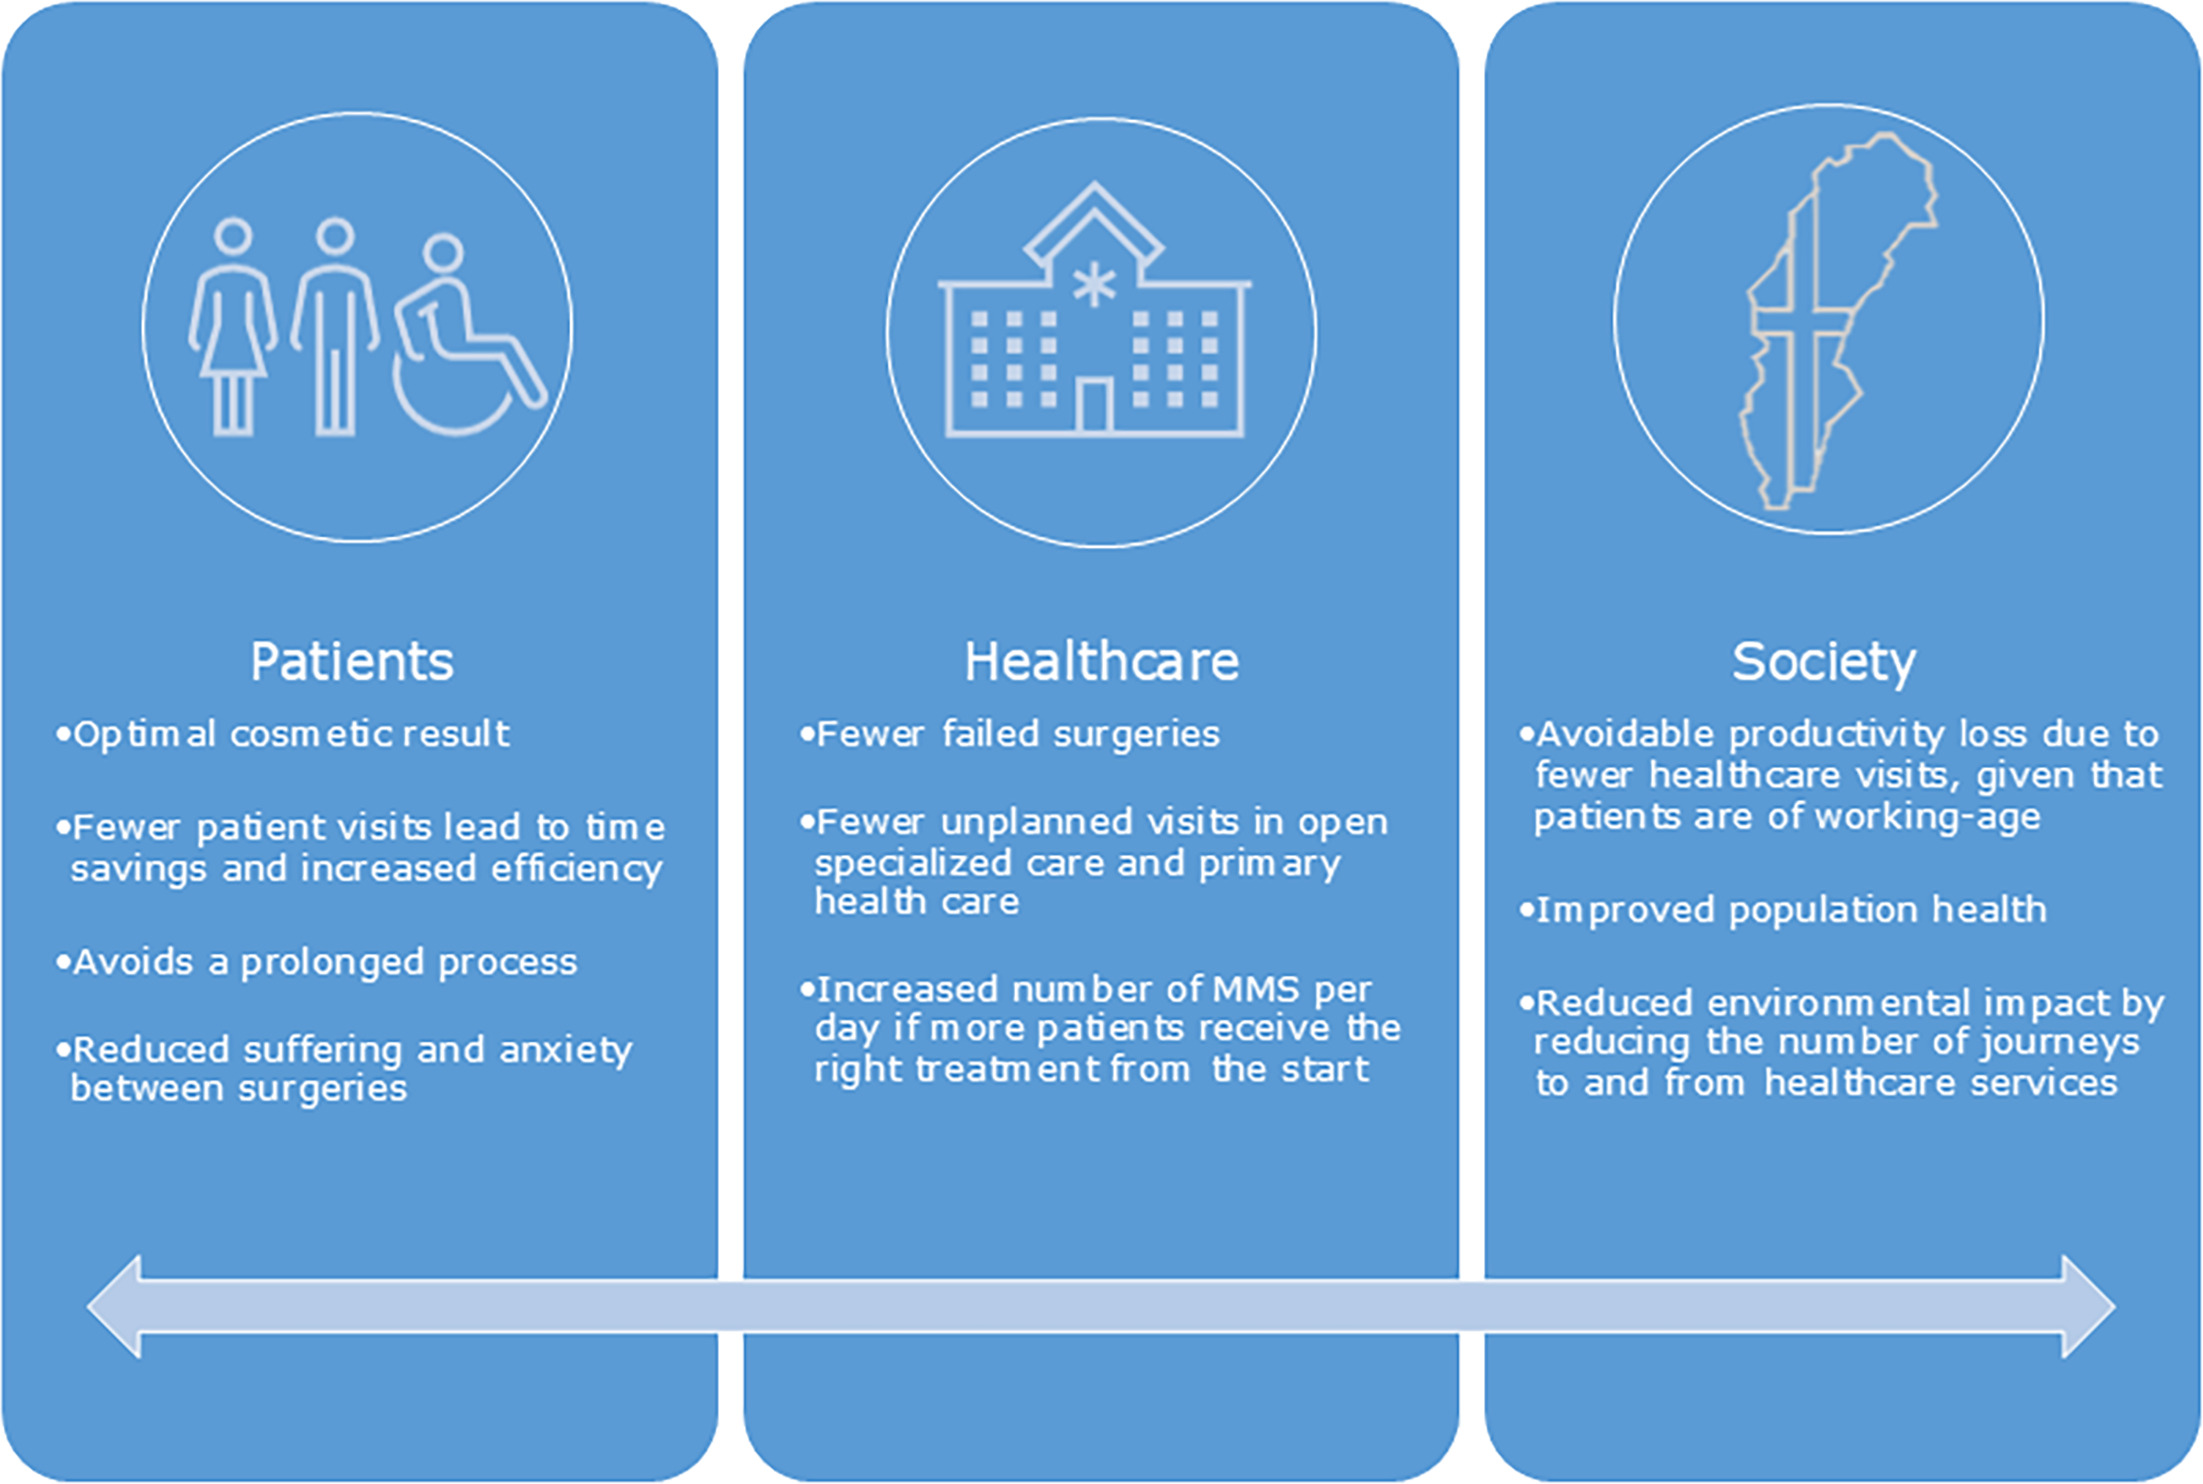
Fig. 2. Potential benefits with increased MMS capacity for patients, healthcare and society.
The underuse of MMS, despite its recognized safety and effectiveness, is a major problem. In Swedish clinical practice, MMS has traditionally been considered as a treatment of final option, primarily reserved for complex or recurrent cases. Clinicians often favour repeated SEs over MMS, reflecting limited awareness of its indications and benefits. This conservative approach, common across the Nordic countries, has contributed to limited access. The current waiting time of up to 12 months for MMS remains problematic. Such delays cannot reasonably be explained by limited resources but rather reflects suboptimal prioritization within the healthcare system.
Earlier use of MMS may reduce repeated procedures and improve resource efficiency. MMS achieves tumour clearance in a single procedure and is most efficient when used as primary treatment. Its effectiveness is reduced in recurrent cases, which often require >4 stages (34) and have higher recurrence risk (17, 20, 21, 35). Each additional procedure increases both clinical risk and resource use.
A previous study from our department showed an increase in primary MMS use and a reduction in surgical stages over time, along with smaller defect sizes and higher rates of primary closure (8). These findings support improved efficiency with earlier use of MMS.
Despite being considered the gold standard for high-risk facial BCC, MMS remains underutilized in Sweden. Further studies integrating both clinical outcomes and societal costs are needed to fully evaluate its value in routine practice.
Strengths and limitations
The main strength of this study is the use of real-world healthcare resource utilization and cost data from the Vega regional healthcare registry. A further strength is the inclusion of all consecutive cases in cohort 1 from the local Mohs registry, ensuring complete capture of treated patients at our center.
Limitations include potential misclassification related to ICD-10 coding and the exclusion of indirect costs. In addition, the single-centre study design may limit generalizability to other settings, and not all tumours in cohort 2 may have been pathologically verified.
Conclusion
This study suggests that MMS may be a cost-efficient treatment option for high-risk facial BCCs when used in accordance with Swedish treatment guidelines. Although MMS was associated with higher initial costs compared with SE, the long-term cost trajectory appeared more stable. Patients undergoing SE followed by MMS had the highest cumulative costs, indicating that treatment failure may contribute to increased healthcare expenditure over time. Differences in costs were not explained by baseline characteristics in adjusted analyses. These findings support the importance of considering long-term resource use when evaluating treatment strategies for high-risk facial BCC.
ACKNOWLEDGEMENTS
The study was financed by grants from the Swedish state under the agreement between the Swedish government and the county councils, the ALF-agreement (ALFGBG-728761).
REFERENCES
- The National Board of Health and Welfare. [Statistics on cancer incidence]. 2024. Available from: https://www.socialstyrelsen.se/globalassets/sharepoint-dokument/artikelkatalog/statistik/2024-10-9299.pdf
- Peris K, Fargnoli MC, Garbe C, Kaufmann R, Bastholt L, Seguin NB, et al. Diagnosis and treatment of basal cell carcinoma: European consensus-based interdisciplinary guidelines. Eur J Cancer 2019; 118: 10–34. https://doi.org/10.1016/j.ejca.2019.06.003
- Kappelin J, Green AC, Ingvar Å, Ahnlide I, Nielsen K. Incidence and trends of basal cell carcinoma in Sweden: A population-based registry study. Br J Dermatol 2022; 186: 963–969. https://doi.org/10.1111/bjd.20964
- European Society for Micrographic Surgery. [ESMS position document on the use of Mohs micrographic surgery and other micrographic surgery techniques in Europe]. 2019. Available from: www.esms-mohs.eu
- Wennberg AM, Larkö O, Stenquist B. Five-year results of Mohs’ micrographic surgery for aggressive facial basal cell carcinoma in Sweden. Acta Derm Venereol 1999; 79: 370–372. https://doi.org/10.1080/000155599750010292
- Ad Hoc Task Force, Connolly SM, Baker DR, Coldiron BM, Fazio MJ, Storrs PA, et al. AAD/ACMS/ASDSA/ASMS 2012 appropriate use criteria for Mohs micrographic surgery: A report of the American Academy of Dermatology, American College of Mohs Surgery, American Society for Dermatologic Surgery Association, and the American Society for Mohs Surgery. J Am Acad Dermatol 2012; 67: 531–550. https://doi.org/10.1016/j.jaad.2012.06.009
- Work Group, Invited Reviewers, Kim JYS, Kozlow JH, Mittal B, Moyer J, et al. Guidelines of care for the management of basal cell carcinoma. J Am Acad Dermatol 2018; 78: 540–559. https://doi.org/10.1016/j.jaad.2017.10.006
- Ceder H, Grönberg M, Paoli J. Mohs micrographic surgery for primary versus recurrent or incompletely excised facial high-risk basal cell carcinomas. Acta Derm Venereol 2021; 101: adv00381. https://doi.org/10.2340/00015555-3698
- Jernebeck J, Glaumann B, Glas JE. Basal cell carcinoma. Clinical evaluation of the histological grading of aggressive types of cancer. Lakartidningen 1988; 85: 3467–3470.
- Haws AL, Rojano R, Tahan SR, Phung TL. Accuracy of biopsy sampling for subtyping basal cell carcinoma. J Am Acad Dermatol 2012; 66: 106–111. https://doi.org/10.1016/j.jaad.2011.02.042
- Roozeboom MH, Kreukels H, Nelemans PJ, Mosterd K, Winnepenninckx VJL, Abdul Hamid MA, et al. Subtyping basal cell carcinoma by clinical diagnosis versus punch biopsy. Acta Derm Venereol 2015; 95: 996–998. https://doi.org/10.2340/00015555-2113
- Wolberink EAW, Pasch MC, Zeiler M, van Erp PEJ, Gerritsen MJP. High discordance between punch biopsy and excision in establishing basal cell carcinoma subtype: Analysis of 500 cases. J Eur Acad Dermatol Venereol 2013; 27: 985–989. https://doi.org/10.1111/j.1468-3083.2012.04628.x
- Kappelin J, Nielsen K, Nilsson F, Bjellerup M, Ahnlide I. Surgical treatment of basal cell carcinoma: A case series on factors influencing the risk of an incomplete primary excision. J Eur Acad Dermatol Venereol 2020; 34: 2518–2525. https://doi.org/10.1111/jdv.16327
- Farhi D, Dupin N, Palangié A, Carlotti A, Avril MF. Incomplete excision of basal cell carcinoma: Rate and associated factors among 362 consecutive cases. Dermatol Surg 2007; 33: 1207–1214. https://doi.org/10.1111/j.1524-4725.2007.33255.x
- Bassas P, Hilari H, Bodet D, Serra M, Kennedy FE, García-Patos V. Evaluation of surgical margins in Basal cell carcinoma by surgical specialty. Actas Dermosifiliogr 2013; 104: 133–140. https://doi.org/10.1016/j.ad.2012.06.001
- Paoli J, Daryoni S, Wennberg AM, Mölne L, Gillstedt M, Miocic M, et al. 5-year recurrence rates of Mohs micrographic surgery for aggressive and recurrent facial basal cell carcinoma. Acta Derm Venereol 2011; 91: 689–693. https://doi.org/10.2340/00015555-1134
- Smeets NWJ, Krekels GAM, Ostertag JU, Essers BAB, Dirksen CD, Nieman FHM, et al. Surgical excision vs Mohs’ micrographic surgery for basal-cell carcinoma of the face: randomised controlled trial. Lancet 2004; 364: 1766–1772. https://doi.org/10.1016/S0140-6736(04)17399-6
- Alsaif A, Hayre A, Karam M, Rahman S, Abdul Z, Matteucci P. Mohs micrographic surgery versus standard excision for basal cell carcinoma in the head and neck: Systematic review and meta-analysis. Cureus 2021; 13: e19981. https://doi.org/10.7759/cureus.19981
- Brown AC, Brindley L, Hunt WTN, Earp EM, Veitch D, Mortimer NJ, et al. A review of the evidence for Mohs micrographic surgery. Part 2: Basal cell carcinoma. Clin Exp Dermatol 2022; 47: 1794–1804. https://doi.org/10.1111/ced.15266
- van Loo E, Mosterd K, Krekels GAM, Roozeboom MH, Ostertag JU, Dirksen CD, et al. Surgical excision versus Mohs’ micrographic surgery for basal cell carcinoma of the face: A randomised clinical trial with 10 year follow-up. Eur J Cancer 2014; 50: 3011–3020. https://doi.org/10.1016/j.ejca.2014.08.018
- Kuijpers DIM, Thissen MRTM, Neumann MHA. Basal cell carcinoma: Treatment options and prognosis, a scientific approach to a common malignancy. Am J Clin Dermatol 2002; 3: 247–259. https://doi.org/10.2165/00128071-200203040-00003
- Cammarata E, Esposto E, Airoldi C, Giorgione R, Boggio P, Savoia P. Mohs micrographic technique in high-risk basal cell carcinoma: A 3D prediction of safety margins. J Wound Care 2024; 33: cxciv–cxcviii. https://doi.org/10.12968/jowc.2020.0322
- National Comprehensive Cancer Network (NCCN). Basal cell skin cancer. [NCCN Clinical Practice Guidelines in Oncology]. Version 1. 2021. Available from: https://www.nccn.org
- Abide JM, Nahai F, Bennett RG. The meaning of surgical margins. Plast Reconstr Surg 1984; 73: 492–497. https://doi.org/10.1097/00006534-198403000-00030
- van Delft LCJ, Nelemans PJ, van Loo E, Abdul Hamid M, Kelleners-Smeets NWJ. The illusion of conventional histological resection margin control. Br J Dermatol 2019; 180: 1240–1241. https://doi.org/10.1111/bjd.17510
- Gulleth Y, Goldberg N, Silverman RP, Gastman BR. What is the best surgical margin for a Basal cell carcinoma: A meta-analysis of the literature. Plast Reconstr Surg 2010; 126: 1222–1231. https://doi.org/10.1097/PRS.0b013e3181ea450d
- Mohs FE. Chemosurgery for the microscopically controlled excision of cutaneous cancer. Head Neck Surg 1978; 1: 150–166. https://doi.org/10.1002/hed.2890010209
- Regional Cancer Centers in Sweden. Basal Cell Carcinoma, national care program. 2024. Available from: https://kunskapsbanken.cancercentrum.se/globalassets/kunskapsbanken/basalcellscancer/nvp-basalcellscancer.pdf
- Ravitskiy L, Brodland DG, Zitelli JA. Cost analysis: Mohs micrographic surgery. Dermatol Surg 2012; 38: 585–594. https://doi.org/10.1111/j.1524-4725.2012.02341.x
- Bialy TL, Whalen J, Veledar E, Lafreniere D, Spiro J, Chartier T, et al. Mohs micrographic surgery vs traditional surgical excision: A cost comparison analysis. Arch Dermatol 2004; 140: 736–742. https://doi.org/10.1001/archderm.140.6.736
- Essers BAB, Dirksen CD, Nieman FHM, Smeets NWJ, Krekels GAM, Prins MH, et al. Cost-effectiveness of Mohs micrographic surgery vs surgical excision for basal cell carcinoma of the face. Arch Dermatol 2006; 142: 187–194. https://doi.org/10.1001/archderm.142.2.187
- Rogers HW, Coldiron BM. A relative value unit-based cost comparison of treatment modalities for nonmelanoma skin cancer: Effect of the loss of the Mohs multiple surgery reduction exemption. J Am Acad Dermatol 2009; 61: 96–103. https://doi.org/10.1016/j.jaad.2008.07.047
- Seidler AM, Bramlette TB, Washington CV, Szeto H, Chen SC. Mohs versus traditional surgical excision for facial and auricular nonmelanoma skin cancer: An analysis of cost-effectiveness. Dermatol Surg 2009; 35: 1776–1787. https://doi.org/10.1111/j.1524-4725.2009.01291.x
- Sahai S, Walling HW. Factors predictive of complex Mohs surgery cases. J Dermatolog Treat 2012; 23: 421–427. https://doi.org/10.3109/09546634.2011.579083
- Leibovitch I, Huilgol SC, Selva D, Richards S, Paver R. Basal cell carcinoma treated with Mohs surgery in Australia III. Perineural invasion. J Am Acad Dermatol 2005; 53: 458–463. https://doi.org/10.1016/j.jaad.2005.04.089