ORIGINAL REPORT
Cardiovascular Risk Factors in Adults with Atopic Dermatitis: A Cross-sectional Study
Raquel SANABRIA-DE LA TORRE1,2,3,4 , Andrés OLIVER-RAMÍREZ5, Katrina ABUABARA4, Trinidad MONTERO-VÍLCHEZ1,3,5* and Salvador ARIAS-SANTIAGO1,3,5
1Biosanitary Research Institute of Granada (ibs.GRANADA), Granada, Spain, 2Department of Biochemistry and Molecular Biology III and Immunology, University of Granada, Granada, Spain, 3Dermatology Department, Virgen de las Nieves University Hospital, Granada, Spain, 4Department of Dermatology, University of California, San Francisco, United States, and 5Dermatology Department, School of Medicine, University of Granada, Granada, Spain
Corr: Trinidad Montero-Vílchez, Dermatology Department, Virgen de las Nieves University Hospital, Avda. Madrid 15, ES-18016 Granada, Spain. *Email: tmonterov@gmail.com
Key words: Atopic dermatitis; Arterial stiffness; Blood pressure; Biomarkers; Cardiovascular risk; Lifestyle.
Citation: Acta Derm Venereol 2026; 106: adv-2026-0452. DOI: https://doi.org/10.2340/actadv.v106.adv-2026-0452.
Copyright: 2026 ©Author(s). Published by MJS Publishing, on behalf of the Society for Publication of Acta Dermato-Venereologica. This is an Open Access article distributed under the terms of the Creative Commons Attribution-NonCommercial 4.0 International License (https://creativecommons.org/licenses/by-nc/4.0/).
Submitted: Feb 28, 2026. Accepted after revision: Jul 20, 2026.
Published: Aug 20, 2026.
Competing interests and funding: The authors have no conflicts of interest to declare.
This work was supported by Project “PI23/01875”, funded by Instituto de Salud Carlos III (ISCIII) and co-funded by the European Union, and by the National Eczema Association (NEA) through grant NEA24-ERG220. RS-dlT was supported by a predoctoral fellowship from the Ministry of Universities (FPU21/00833), and TMV was supported by a postdoctoral fellowship from the ISCIII (JR24/00025).
The data that support the findings of this study are available from the corresponding author upon reasonable request.
Reviewed and approved by the Granada Provincial Research Ethics Committee, Spain (approval code SICEIA-2024-002764 and date 26/11/2024).
Atopic dermatitis (AD) is a chronic inflammatory skin disease linked to systemic comorbidities, although its relationship with cardiovascular risk) remains controversial. The main objective of this study was to evaluate cardiovascular risk-related factors in AD and explore associations with disease severity. A cross-sectional study including adults with AD and healthy controls was conducted. Cardiovascular risk assessment included anthropometric, lifestyle, vascular and laboratory data, with global risk estimated using the PREVENT equations. The study included 100 adults (50 AD patients and 50 controls). Patients had moderate-to-severe disease (SCORAD 49.19±16.41). Compared with controls, AD patients showed higher BMI (27.25 vs 24.63 kg/m², p=0.01), lower Mediterranean diet adherence (p<0.001) and reduced physical activity (p=0.03). Mean arterial pressure (103.67 vs 93.55 mmHg, p=0.001), LDH (215.31 vs 183.88 IU/L; p=0.008) and CRP (7.90 vs 0.84 mg/L, p=0.05) were significantly higher in patients. Higher v-IGA scores were associated with increased fasting glucose and heart rate. Estimated 10 year cardiovascular risk was significantly higher in AD than in controls (p=0.04). Overall, AD patients exhibit an unfavourable cardiometabolic profile. Greater disease severity may be linked to vascular alterations, supporting the need for cardiovascular assessment in AD management.
SIGNIFICANCE
Atopic dermatitis is usually considered a skin disease, but it may also affect overall health. In this study, adults with atopic dermatitis showed higher body weight, poorer lifestyle habits, higher blood pressure, and metabolic changes compared with healthy individuals. When these factors were combined, patients with atopic dermatitis had a higher estimated 10 year cardiovascular risk. More severe skin disease was linked to worse metabolic and heart-related markers. These findings suggest that atopic dermatitis should be viewed as a condition with potential systemic effects, and that cardiovascular risk assessment and lifestyle interventions may represent a beneficial non-pharmacological strategy for these patients.
INTRODUCTION
Atopic dermatitis (AD) is a chronic inflammatory skin disease with a rising global prevalence (1). Although AD usually begins in childhood, adult-onset forms are increasingly recognized and often display distinct clinical features (2). Its pathogenesis involves the interplay of genetic, immunological and environmental factors leading to skin barrier dysfunction and immune dysregulation (3).
Beyond cutaneous manifestations, chronic low-grade inflammation (4) and metabolic alterations (5) have been proposed as mechanisms linking AD to cardiometabolic disorders. Like other dermatoses, including psoriasis and hidradenitis suppurativa (6), AD has been associated with an increased prevalence of both atopic (asthma, allergic rhinitis) and nonatopic comorbidities (psychiatric, autoimmune) (7).
Epidemiological studies have reported associations between AD and cardiovascular diseases (CVDs), including hypertension (8), ischaemic heart disease (9), stroke (10) and peripheral arterial disease (11, 12), although findings remain inconsistent (13).
Targeted biologic therapies and Janus kinase inhibitors (JAKi) have revolutionized AD management (14). Nevertheless, their long-term systemic impact remains uncertain, particularly regarding metabolic and cardiovascular safety profiles (15, 16).
Given the rising prevalence of AD and its potential cardiovascular implications, further research is warranted. The aim of this study was to assess cardiovascular risk (CVR)-related factors in adults with AD compared with age- and sex-matched healthy controls and to analyse their relationship with disease severity.
MATERIALS AND METHODS
Study design and participants
This unicentric, cross-sectional, study was conducted in accordance with the STROBE guidelines. Two groups were included: patients with AD under follow-up at the Dermatology Department of Virgen de las Nieves University Hospital (Granada, Spain) and age- and sex-matched healthy controls. Recruitment was carried out between December 2024 and March 2025.
Eligible participants were adults aged 18–65 years who provided written informed consent. For the AD group, a dermatologist-confirmed diagnosis of AD for at least 6 months was required. Control participants were selected consecutively from patients attending the Dermatology outpatient clinics for minor dermatological complaints unrelated to inflammatory skin disease, such as melanocytic nevi, seborrheic keratoses or skin tags. Eligible controls had no personal history of AD, chronic inflammatory skin diseases, autoimmune diseases or chronic systemic conditions. Exclusion criteria for both groups included a previous major cardiovascular event and the presence of any other chronic inflammatory skin condition.
Study variables
Sociodemographic data, clinical history, comorbidities and treatments were collected through structured interviews. The severity of AD was assessed using validated physician-reported measures, including the Eczema Area and Severity Index (EASI), the Body Surface Area (BSA), the SCORing Atopic Dermatitis (SCORAD) and the validated-Investigator’s Global Assessment (v-IGA). Patient-reported severity was evaluated with the Patient-Oriented Eczema Measure (POEM), as well as a Numerical Rating Scale (NRS) for pruritus and sleep disturbance.
Anthropometric measures were obtained using standardized clinical procedures. Lifestyle factors included adherence to the Mediterranean diet (MD) and physical activity (PA) levels. MD adherence was assessed using the validated 14-item PREvención con DIeta MEDiterránea (PREDIMED) questionnaire, with each item scored as 1 or 0 and total scores classified as low (≤5), moderate (6, 7, 8, 9) or high (≥10) adherence. PA levels were evaluated using the 5-item International Physical Activity Questionnaire (IPAQ), validated for the Spanish population, which assesses the frequency, duration and intensity of PA over the past 7 days, as well as walking and sitting time. Participants were classified as vigorous, moderate or slow.
Vascular parameters were measured using the IEM Mobil-O-Graph device and included systolic blood pressure (SBP), diastolic blood pressure (DBP), mean arterial pressure (MAP), differential pressure (DP), central systolic blood pressure (cSBP), central diastolic blood pressure (cDBP), cardiac output (CO), heart rate (HR), stroke volume (SV), total vascular resistance (TVR), augmentation index at a heart rate of 75 beats per minute (Alx-75) and pulse wave velocity (PWV). AIx-75 reflects the contribution of wave reflection to central arterial pressure and serves as a surrogate marker of peripheral vascular tone and arterial stiffness. PWV represents the velocity of the arterial pressure wave and is a direct, blood pressure-dependent indicator of arterial stiffness and CVR.
Fasting blood samples were collected for biochemical assessment, including fasting glucose, insulin, total cholesterol (TC), high-density lipoprotein chole-sterol (HDL-C), non-HDL-C, low-density lipoprotein cholesterol (LDL-C), triglycerides (TG), lactate dehydrogenase (LDH), alkaline phosphatase (ALP), uric acid, C-reactive protein (CRP) and vitamin D levels. Cardiometabolic indices such as the trigly-ceride–glucose (TyG) index and the homeostasis model assessment of insulin resistance (HOMA-IR) were calculated. In patients with AD, additional inflammatory markers were analysed, including erythrocyte sedimentation rate (ESR), total IgE, complement components C3 and C4, D-dimer and interleukin-6 (IL-6), which were not available for the control group. Reference ranges for these markers were ESR<20 mm/h, IgE<100 UI/mL, C3 90–180 mg/dL, C4 10–40 mg/dL, D-dimer<0.5 µg/mL and IL-6<5 pg/mL.
The PREVENT score integrates age, sex, blood pressure, lipid parameters, glycemic status, smoking and diabetes status to estimate 10- and 30 year CVR and was used as an integrative measure of CVR (17). According to American Heart Association recommendations, analyses were restricted to participants aged 30–79 years, the validated age range for PREVENT (17).
Statistical analysis
Descriptive statistics were used to characterize the population. Continuous variables were expressed as mean±standard deviation (SD) and compared using Student t-test or Wilcoxon rank-sum test, as appropriate. Categorical variables were reported as absolute and relative frequencies and compared using the χ² test or Fisher exact test.
Associations between variables were explored through multivariate regression models. Comparisons were conducted both unadjusted and adjusted for BMI (continuous) and educational level (categorical: low/medium/high), selected a priori as potential cofounders using a directed acyclic graph (DAG) approach. Mendelian randomization studies support a causal effect of higher BMI on the risk of AD (18). Adjusted analyses were performed using nominal logistic regression (dependent variable: AD vs control; independent variables: each cardiovascular parameter, BMI and educational level). Statistical significance was set at p<0.05 (2-tailed). Exploratory long-term CVR was estimated using the PREVENT equations in participants aged 30–79 years. Analyses were performed using JMP Pro version 18 (SAS Institute Inc., Cary, NC, USA).
A sensitivity sample size calculation was additionally performed assuming a 2-tailed independent-samples t-test, α=0.05, 80% power, and a total sample size of 100 participants equally allocated between groups. Under these assumptions, the study was powered to detect moderate between-group differences of approximately Cohen d=0.56. Sample size calculations were performed using G*Power version 3.1.9.6.
Ethical considerations
The study complied with the Declaration of Helsinki and was approved by the Provincial Ethics Committee of Granada (SICEIA-2024–002764, 26/11/2024). Participants provided written informed consent.
RESULTS
A total of 100 participants were included: 50 patients with AD and 50 age- and sex-matched controls (26 men and 24 women in each group). The mean age was 38.3±15.3 years in patients and 38.2±15.2 years in controls. No statistically significant differences were observed in sociodemographic characteristics between the study groups, except for educational level (p=0.03), with a higher proportion of participants holding higher education degrees in the control group (28/50, 56%) compared with the AD group (19/50, 38%). The mean disease severity in patients was moderate-to-severe, with a SCORAD score of 49.20±16.40 and an EASI score of 18.28±10.53. More than half of patients presented rhinoconjunctivitis (27/50, 54%), followed by asthma (20/50, 40%) and food allergies (2/50, 4%). The remaining sociodemographic and clinical characteristics are summarized in Table I.
Table I. Sociodemographic, clinical and lifestyle characteristics of the study population
Anthropometric and lifestyle factors
Patients showed significantly higher body weight (77.79±15.75 vs 70.13±11.91 kg, p=0.01) and BMI (27.25±5.84 vs 24.63±2.96 kg/m², p=0.01) than controls. Among women, waist circumference was also greater in patients (88.66±13.93 vs 79.29±10.70 cm, p=0.01), while a similar trend was observed in men.
Patients reported lower adherence to the MD (PREDIMED score: 7.9±2.0 vs 10.0±1.4, p<0.001), lower PA levels (IPAQ score: p=0.02), and longer sedentary time (443.2±144.0 vs 381.6±140.2 min/day, p=0.03). Alcohol and tobacco consumption did not differ between groups (Table I).
Item-by-item analysis of the PREDIMED questionnaire showed poorer adherence to several key components of the MD in patients with AD (Table SI).
Regarding PA, patients with AD reported lower frequencies of vigorous, moderate and walking activities (Table SII).
Cardiovascular dynamics
Patients with AD showed significantly higher BP values than controls (Table II), including systolic (132.25±18.50 vs 118.61±12.38 mmHg; p<0.0001), diastolic (81.02±12.27 vs 72.65±10.12 mmHg; p=0.004), and MAP (103.67±14.66 vs 93.55±9.52 mmHg; p<0.0001). Central BP parameters were also higher in patients (cSBP: p=0.002; cDBP: p=0.01). After adjustment for BMI and educational level, most vascular parameters remained significantly higher in the AD group, except for DP and CO (Table SIII).
Table II. Cardiovascular dynamics measurements
| Variables | AD patients (n=50) Mean±SD |
Healthy controls (n=50) Mean±SD |
p-value |
|---|---|---|---|
| SBP (mmHg) | 132.25±18.50 | 61±12.38 | <0.0001 |
| DBP (mmHg) | 81.02±12.27 | 72.65±10.12 | 0.004 |
| MAP (mmHg) | 103.67±14.66 | 93.55±9.52 | <0.0001 |
| DP (mmHg) | 52.23±14.31 | 46.24±12.80 | 0.03 |
| cSBP (mmHg) | 131.13±17.74 | 118.19±14.18 | 0.002 |
| cDBP (mmHg) | 81.66±12.39 | 73.64±10.29 | 0.01 |
| HR (bpm) | 71.85±11.41 | 72.04±13.57 | 0.93 |
| CO (L/min) | 4.83±0.11 | 4.52±0.11 | 0.05 |
| SV (mL/beat) | 68.11±2.03 | 64.79±2.01 | 0.25 |
| Alx-75 (%) | 25.00±11.66 | 23.18±11.42 | 0.44 |
| PWV (m/s) | 6.69±1.72 | 6.11±1.47 | 0.07 |
| TVR (mmHg*min/L) | 1.31±0.20 | 1.27±0.18 | 0.25 |
|
p-values derived from independent t-tests comparing patients with AD and healthy controls. Statistically significant results (p<0.05) are highlighted in bold. Differences adjusted for BMI and educational level; see Table SIII,. AD: Atopic dermatitis; Alx-75: augmentation index at a heart rate of 75 beats per minute; cDBP: central diastolic blood pressure; CO: cardiac output; cSBP: central systolic blood pressure; DBP: diastolic blood pressure; DP: differential pressure; HR: heart rate; MAP: mean arterial pressure; PWV: pulse wave velocity; SBP: systolic blood pressure; SD:standard deviation; SV: stroke volume; TVR: total vascular resistance. |
|||
A trend towards higher PWV was observed in patients (6.69±1.72 vs 6.11±1.47 m/s, p=0.07), although this difference was not maintained after adjustment (p=0.89). No differences were found for HR, SV, Alx-75 or TVR.
When patients were stratified according to treatment, those not receiving advanced therapies (biologics and/or JAKi) showed higher AIx-75, while treated patients presented slightly higher cDBP; no other significant differences were observed (Table SIV).
Laboratory parameters
Patients exhibited higher fasting glucose (86.51±18.87 vs 79.92±8.61 mg/dL; p=0.03), TG (99.10±6.88 vs 77.78±6.88 mg/dL; p=0.03), and LDH (215.31±5.84 vs 183.88±9.81 UI/L; p=0.008), and lower ALP levels (68.74±2.44 vs 78.59±2.44 UI/L; p=0.005). CRP tended to be higher in patients (7.90±1.88 vs 0.84±2.95 mg/L; p=0.05). The TyG index showed a trend toward higher values in the AD group (8.17±0.08 vs 7.96±0.08, p=0.06). No other metabolic differences were observed (Table III).
Table III. Laboratory parameters
| Variables | AD patients (n=50) Mean±SD |
Healthy controls (n=50) Mean±SD |
p-value |
|---|---|---|---|
| Fasting glucose (mg/dL) | 86.51±18.87 | 79.92±8.61 | 0.03 |
| Insulin (mU/L) | 8.77±0.85 | 5.00±2.36 | 0.14 |
| LDH (UI/L) | 215.31±5.84 | 183.88±9.81 | 0.008 |
| TG (mg/dL) | 99.10±6.88 | 77.78±6.88 | 0.03 |
| TC (mg/dL) | 189.73±42.62 | 177.35±34.27 | 0.14 |
| HDL-C (mg/dL) | 53.15±11.99 | 56.88±12.82 | 0.18 |
| LDL-C (mg/dL) | 117.51±36.05 | 108.44±32.29 | 0.24 |
| non-HDL-C (mg/dL) | 137.49±43.49 | 123.41±33.28 | 0.10 |
| Uric acid (mg/dL) | 5.13±1.47 | 5.13±1.21 | 0.99 |
| ALP (UI/L) | 68.74±2.44 | 78.59±2.44 | 0.005 |
| CRP (mg/L) | 7.90±1.88 | 0.84±2.95 | 0.05 |
| Vitamin D (ng/mL) | 24.30±1.11 | 27.59±1.11 | 0.04 |
| TyG index | 8.17±0.08 | 7.96±0.08 | 0.06 |
| HOMA-IR | 1.83±0.22 | 1.06±0.67 | 0.28 |
| ESR (mm/h) | 11.19±12.45 | - | - |
| IgE (UI/mL) | 696.20±1497.18 | - | - |
| C3 complement (mg/dL) | 106.50±24.49 | - | - |
| C4 complement (mg/dL) | 24.31±12.32 | ||
| D-dimer (µg/mL) | 0.34±0.23 | - | - |
| IL-6 (pg/mL) | 5.57±9.07 | - | - |
|
A dash (–) indicates that data were only available for patients with AD. p-values derived from independent t-tests comparing patients with AD and healthy controls. Statistically significant results (p<0.05) are highlighted in bold. Differences adjusted for BMI and educational level, see Table SV. AD: Atopic dermatitis; ALP: alkaline phosphatase; CRP: C-reactive protein; ESR: erythrocyte sedimentation rate; HDL-C: high-density lipoprotein cholesterol; HOMA-IR: homeostatic model assessment for insulin resistance; IgE: immunoglobulin E; IL-6: interleukin 6; LDH: lactate dehydrogenase; LDL-C: low-density lipoprotein cholesterol; SD:standard deviation; TC: total cholesterol; TG: triglycerides; TyG: triglyceride/glucose. |
|||
After adjustment for BMI and education, LDH (215.31±5.84 vs 183.88±9.81 UI/L; p=0.03) and CRP (7.90±1.88 vs 0.84±2.95 mg/L; p=0.002) remained significantly higher in patients, whereas glucose, TG and other did not (Table SV).
In treatment-stratified analyses (Table SVI), higher LDH and IL-6 levels were observed in patients receiving advanced therapies, whereas ESR was lower in those treated with JAKi.
Several biochemical parameters showed positive correlations with haemodynamic measures (Fig. 1), particularly those related to glucose-insulin metabolism and lipid profile (Table SVII).

Fig. 1. Heatmap of correlations between biochemical and vascular/hemodynamic parameters in patients with atopic dermatitis (AD). (A) Heatmap showing Pearson correlation coefficients (R) between biochemical markers and haemodynamic measures, including systolic blood pressure (SBP), diastolic blood pressure (DBP), mean arterial pressure (MAP), pulse wave velocity (PWV) and augmentation index standardized to 75 bpm (AIx@75). (B) Heatmap displaying only statistically significant correlations (p<0.05). Positive correlations are represented by warmer colors and negative correlations by cooler colors. Fasting glucose, insulin, TG, TC and TyG index correlated positively with SBP, DBP and MAP, as well as with arterial stiffness parameters (PWV and Alx75). The strongest associations were observed between insulin and SBP (r=0.61, p<0.0001), HOMA-IR and SBP (r=0.59, p<0.0001) and TyG index with PWV (r=0.57, p<0.0001). Fasting glucose levels also correlated with PWV (r=0.57, p<0.0001) and AIx-75 (r=0.36, p=0.01). Among inflammatory markers, ESR correlated with PWV (r=0.45, p=0.002) and AIx-75 (r=0.44, p=0.002). CRP and C3 complement also showed positive correlations with PWV (r=0.33, p=0.02 and r=0.33, p=0.03, respectively). Vitamin D exhibited an inverse correlation with AIx-75 (r=–0.28, p=0.05).
AD severity and CVR markers
Higher v-IGA scores were associated with higher fasting glucose (85.50±9.25 vs 78.55±5.25 vs 83.81±4.35 vs 101.91±5.25, p=0.02, Fig. 2a) higher HR (67.29±13.60 vs 67.45±8.73 vs 71.17±11.45 vs 79.91±9.66, p=0.04, Fig. 2b), and with a trend toward increased MAP (97.00±17.30 vs 104.00±11.02 vs 100.33±12.30 vs 113.27±17.28, p=0.067). In addition, higher SCORAD and EASI scores were positively correlated with HR (r=0.30, p=0.04; r=0.28, p=0.05, Fig. 3). Patients with comorbidities had higher uric acid (5.53±1.35 vs 4.47±1.46, p=0.02, Fig. S1a) and lower ALP (72.6±18.24 vs 87.58±24.41, p=0.03, Fig. S1b).

Fig. 2. (A) Fasting glucose levels across v-IGA severity categories and (B) heart rate across v-IGA categories. Boxplots represent mean values and standard deviation, with individual data points overlaid. Global differences were assessed using 1-way ANOVA, which showed statistical significance for both fasting glucose (p=0.02) and heart rate (p=0.04). Post hoc Tukey pairwise comparisons were performed, and significant differences are indicated in the figure as follows: *p<0.05; **p<0.01.
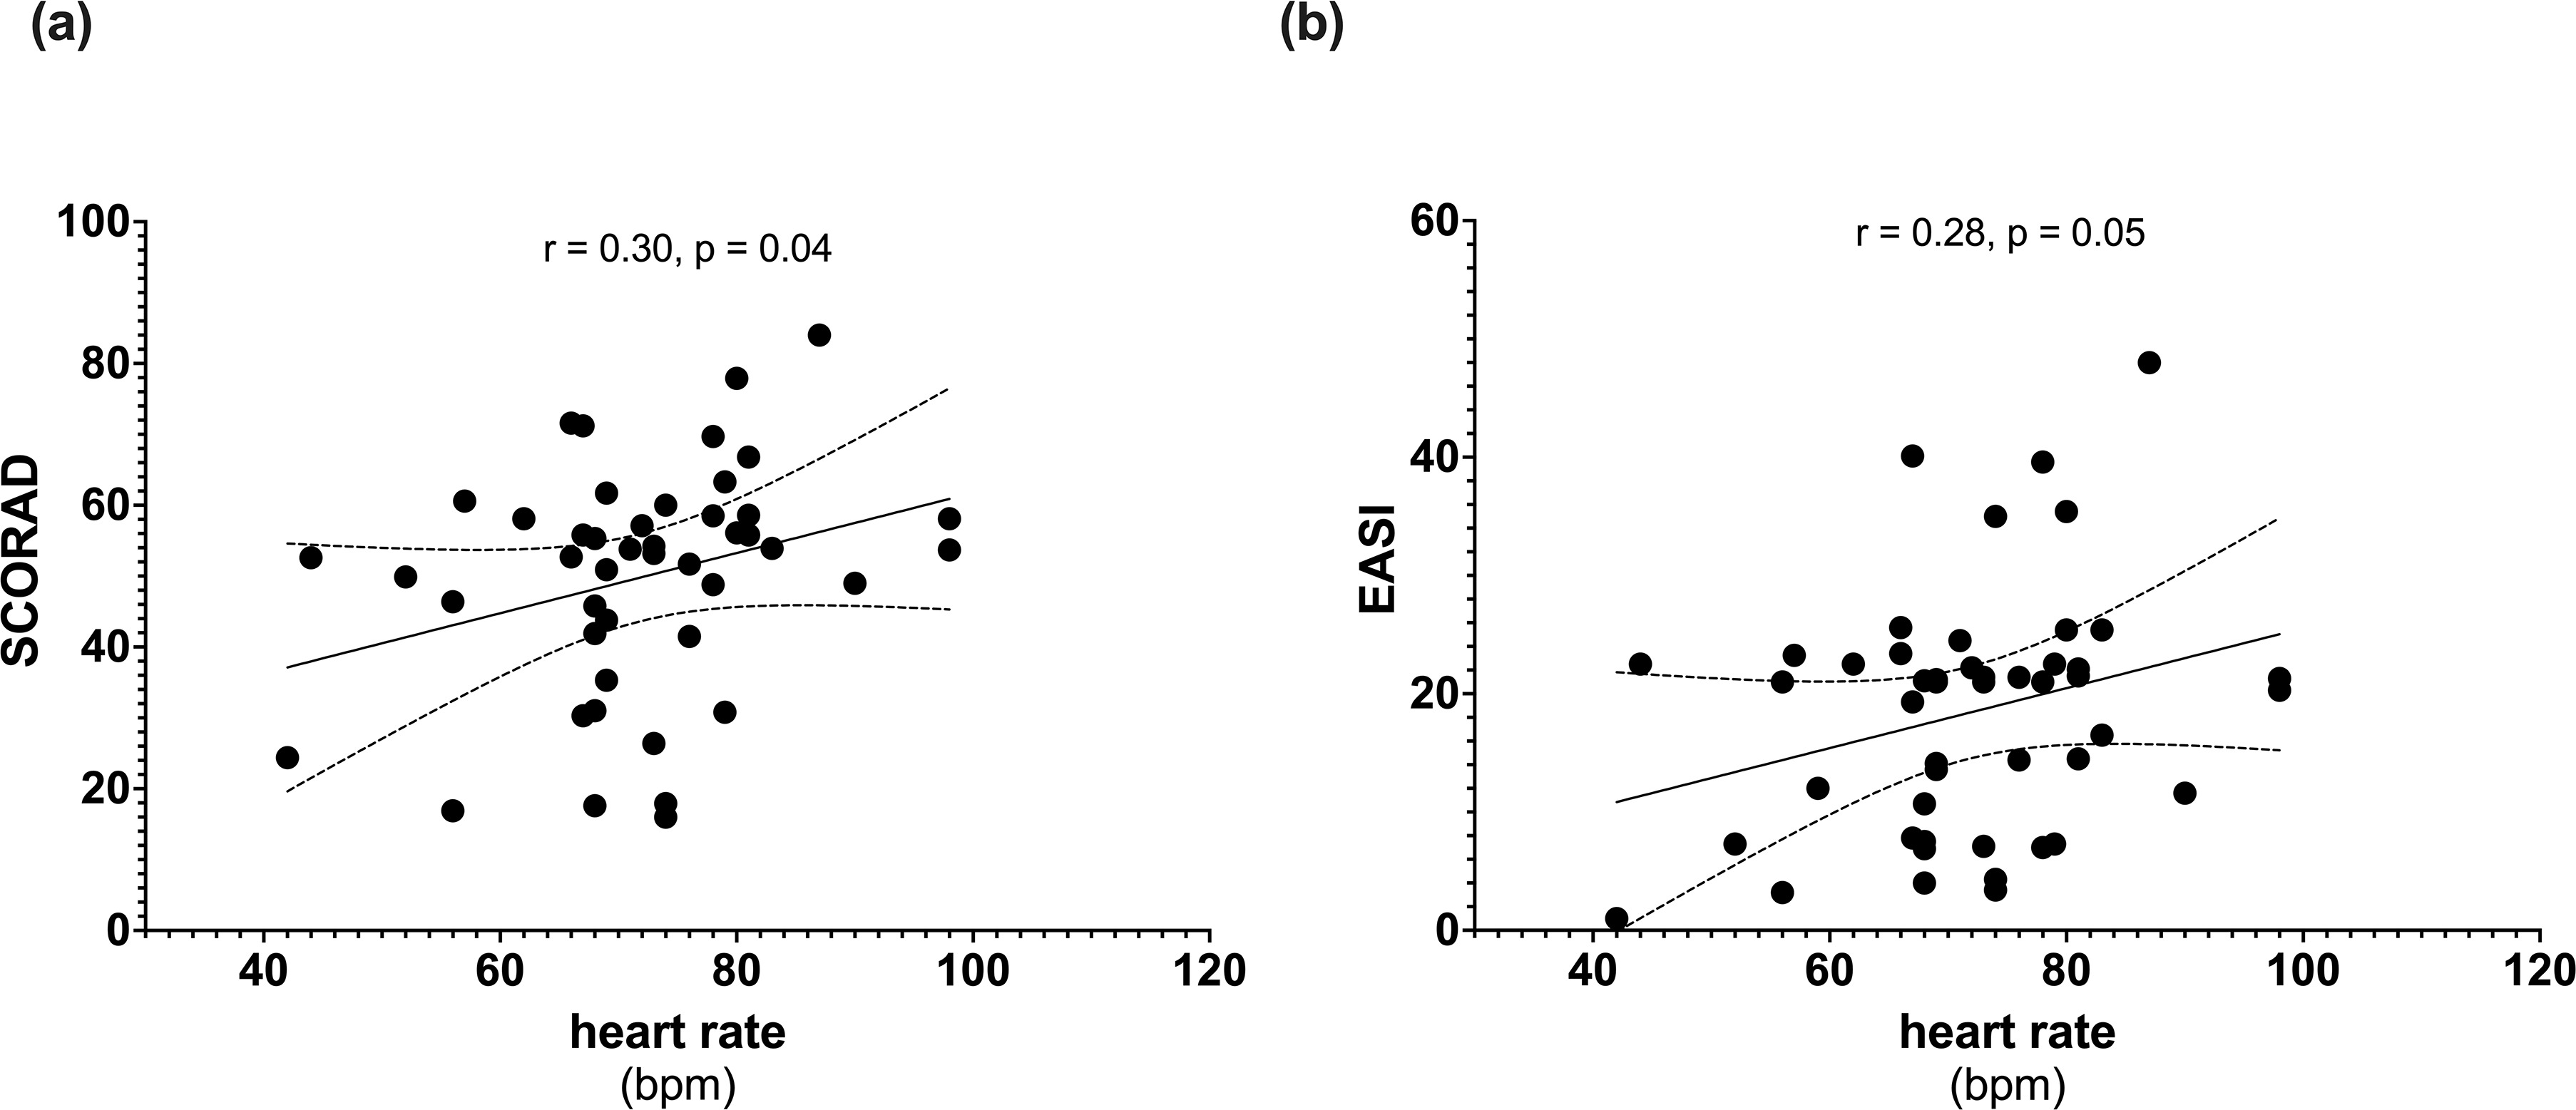
Fig. 3. (A) Scatterplot showing the positive association between SCORAD and heart rate (HR) (r=0.30, p=0.04). (B) Scatterplot showing the positive association between EASI and HR (r=0.28, p=0.05). Regression lines with 95% confidence intervals are shown. *p<0.05.
Estimated CVR using the PREVENT equations
Exploratory PREVENT analyses were performed in participants aged 30–79 years, including 31 patients with AD and 29 healthy controls. Patients showed higher estimated 10-year CVR compared with controls (p=0.04). 30-year risk estimates followed a similar direction but did not reach statistical significance (p=0.06) (Table SVIII).
DISCUSSION
In this study, patients with AD showed an unfavorable profile of CVR-related factors compared with healthy controls, including higher obesity, poorer lifestyle patterns, elevated BP, and metabolic disturbances. These results support growing evidence that AD extends beyond the skin and is associated with an unfavorable cardiometabolic profile. These alterations were reflected in a higher estimated 10 year CVR assessed using the PREVENT equations.
First, despite having similar sociodemographic characteristics and being matched for age and sex, patients exhibited higher BMI (19) and waist circumference (20) (especially among women), consistent with previous studies reporting increased rates of overweight and obesity in AD (21). AD is characterized by systemic inflammation involving both cutaneous and extracutaneous tissues, including adipose tissue (22). Inflammatory processes in adipose tissue may promote insulin resistance and obesity development (20). Poor adherence to the MD and reduced PA characterized the AD group. These lifestyle factors likely contribute both to systemic inflammation (5, 23) and to the metabolic abnormalities observed (24, 25, 26). PREDIMED and IPAQ analyses revealed lower consumption of fruits, vegetables, legumes, fish, nuts and white meat and lower levels of moderate-to-vigorous activity in patients with AD, supporting an unfavorable lifestyle profile (27, 28).
Hemodynamic parameters demonstrated a consistent pattern of increased BP in AD patients, even after adjusting for BMI and educational level. These findings agree with previous studies reporting elevated BP in individuals with AD (29). Arterial stiffness is measured by Alx-75 and PWV and commonly used to evaluate CVR (30). Although differences in PWV did not remain significant after adjustment, the trend towards higher arterial stiffness aligns with prior reports suggesting possible early vascular alterations in AD (5) and is consistent with findings in psoriasis (31). The finding that untreated patients had higher AIx-75 than those receiving advanced therapies raises the hypothesis that systemic treatments could potentially attenuate peripheral arterial stiffness through inflammation control. However, given the cross-sectional design, these differences may also reflect higher baseline disease severity among patients requiring advanced systemic treatment rather than treatment-related effects and therefore require confirmation in longitudinal studies. Similarly, the higher IL-6 levels observed in biologic-treated patients likely reflect channelling bias and greater baseline inflammatory burden, rather than a treatment-related effect.
Biochemically, patients with AD exhibited higher fasting glucose, TG and LDH levels, and lower ALP levels than healthy controls, with CRP levels bordering significance. After adjustment, only LDH and CRP remained significantly elevated, indicating that systemic inflammation and tissue turnover may be robustly associated with AD (32). The trend toward higher TyG index values, a surrogate marker of insulin resistance and hepatic steatosis in psoriasis (33), further supports potential metabolic involvement. Within the AD cohort, inflammatory markers such as ESR, CRP and C3 correlated positively with PWV and AIx-75, suggesting a possible relationship between chronic low-grade inflammation and vascular stiffness, whereas vitamin D showed a borderline inverse correlation with AIx-75, raising the possibility of a modest protective effect on peripheral vascular tone. In parallel, IgE and IL-6 concentrations were elevated relative to their reference ranges, and ESR values were within the upper normal limit, findings that may be compatible with low-grade systemic inflammation in AD. Taken together, these findings support a potential relationship between chronic immune activation and early vascular alterations in AD, although inflammatory biomarkers were only assessed in the patient group. Shared inflammatory pathways between AD and type 2 diabetes (34), particularly those involving Th2-related cytokines, may underlie the metabolic and vascular alterations observed in this population (20, 29).
Disease severity showed modest associations with selected cardiovascular parameters (35). Higher v-IGA, SCORAD and EASI scores showed exploratory associations with increased HR, a prognostic marker that has been consistently linked to adverse cardiovascular outcomes in population-based studies (36). Elevated resting HR could reflect sympathetic activation and systemic inflammation in moderate-to-severe AD (37).
The presence of atopic comorbidities (rhinoconjunctivitis, asthma and/or food allergies) further characterized a subgroup with less favourable CVR-factor profiles, as reflected by higher uric acid levels and lower ALP concentrations. Hyperuricemia is a well-established marker of metabolic dysfunction and endothelial stress (38), while lower ALP levels may be influenced by nutritional factors (39), a possibility supported by the poorer adherence to key MD components observed in patients with AD. This finding warrants further investigation.
Taken together, these findings support the notion that AD is not merely a cutaneous disorder but a systemic inflammatory condition that may predispose patients to an unfavorable cardiometabolic profile. The interplay between chronic inflammation, metabolic alterations, and unhealthy lifestyle habits may synergistically contribute to an unfavorable CVR profile in this population. These observations support the potential value of a more integrated management strategy in AD, incorporating routine CVR assessment and targeted lifestyle interventions.
Strengths and limitations
Strengths of this study include the comprehensive assessment of CVR across anthropometric, hemodynamic, biochemical, and lifestyle domains, enabling a holistic evaluation of cardiovascular status. The integration of validated lifestyle questionnaires provides insight into modifiable behaviours, and the inclusion of an age- and sex-matched control group strengthens the study design. Importantly, direct measures of arterial stiffness were incorporated, including both PWV and AIx-75, enabling the characterization of early vascular changes; to our knowledge, this is the first study to evaluate both PWV and the TyG index in patients with AD. Limitations include the cross-sectional and single-centre design, which precludes causal inference and may limit generalizability. In addition, differences in educational level between groups may have introduced residual socioeconomic confounding despite statistical adjustment. No formal correction for multiple comparisons was applied due to the exploratory nature of the analyses. Furthermore, the sample size may have limited the ability to reliably detect smaller effect sizes. Therefore, findings with borderline statistical significance, particularly severity-related correlation analyses, should be interpreted cautiously. In addition, analyses based on the PREVENT equations were restricted to participants aged 30–79 years, according to the validated applicability range of this CVR prediction tool, which reduced the sample size available for these comparisons and consequently limited statistical power. Treatment-stratified analyses also involved relatively small sample sizes, increasing susceptibility to channelling bias and confounding by indication. The hospital-based cohort consisted mainly of patients with moderate-to-severe disease, many receiving systemic or biologic therapies, precluding conclusions regarding treatment effects on cardiovascular measures. Multicentre longitudinal studies are needed to confirm these findings and to elucidate mechanistic links between AD and cardiovascular comorbidities.
Conclusion
Adults with AD showed an unfavourable CVR profile compared with matched controls, reflected by higher obesity, elevated BP and central haemodynamic parameters, and metabolic alterations. Greater disease severity showed modest associations with higher resting HR and fasting glucose levels, although these exploratory findings require confirmation in larger studies. These findings support the integration of cardiovascular assessment and lifestyle interventions into AD management.
ACKNOWLEDGEMENTS
This research is a part of the doctoral thesis of Raquel Sanabria de la Torre in the Clinical Medicine and Public Health program of the University of Granada. This paper can only be used for the defense of the mentioned doctoral thesis.
REFERENCES
- Chan KR, Keddie SH, Flohr C, Tsoi MF. Prevalence of atopic dermatitis in the United States from 2021 to 2024: data from the National Health Interview Survey. J Am Acad Dermatol 2026; 94: 633–635. https://doi.org/10.1016/j.jaad.2025.10.022
- Ho MJ, Sultana R, Choo K, Lee HY. Cumulative life course impairment in moderate-to-severe atopic dermatitis: cross-sectional study in Singapore. Dermatology 2025; 241: 425–436. https://doi.org/10.1159/000548368
- Rerknimitr P, Otsuka A, Nakashima C, Kabashima K. The etiopathogenesis of atopic dermatitis: barrier disruption, immunological derangement, and pruritus. Inflamm Regen 2017; 37: 14. https://doi.org/10.1186/s41232-017-0044-7
- Morąg B, Kozubek P, Gomułka K. Obesity and selected allergic and immunological diseases—etiopathogenesis, course and management. Nutrients 2023; 15: 37686844. https://doi.org/10.3390/nu15173813
- Matwiejuk M, Myśliwiec H, Mikłosz A, Chabowski A, Flisiak I. Is atopic dermatitis associated with systemic metabolic disturbances? A systematic review. IJMS 2025; 26: 5884. https://doi.org/10.3390/ijms26125884
- Katamanin OM, Tan IJ, Barry J, Jafferany M. Role of inflammation and cytokine dysregulation in depression in patients with inflammatory skin conditions. Am J Clin Dermatol 2025; 26: 35–43. https://doi.org/10.1007/s40257-024-00905-9
- Esposito M, Giunta A, De Berardinis A, Magnanimi LM, Fargnoli MC, Patruno C, et al. Dermatologic comorbidities associated with atopic dermatitis towards a shared therapeutical approach: a narrative review. Dermatol Ther 2025; 15: 3495–3511. https://doi.org/10.1007/s13555-025-01536-6
- Uehara M, Sugiura H, Tanaka K. Rarity of hypertension in adult patients with atopic dermatitis. Br J Dermatol 2002; 146: 631–635. https://doi.org/10.1046/j.1365-2133.2002.04717.x
- Andersen YMF, Egeberg A, Gislason GH, Hansen PR, Skov L, Thyssen JP. Risk of myocardial infarction, ischemic stroke, and cardiovascular death in patients with atopic dermatitis. J Allergy Clin Immunol 2016; 138: 310–312. https://doi.org/10.1016/j.jaci.2016.01.015
- Yuan M, Cao WF, Xie XF, Zhou HY, Wu XM. Relationship of atopic dermatitis with stroke and myocardial infarction. Medicine 2018; 97: e13512. https://doi.org/10.1097/MD.0000000000013512
- Berna-Rico E, Pérez-García B, Abbad-Jaime de Aragón C, Neria F, Monge D, Pérez-Bootello J, et al. Subclinical atherosclerosis is increased in moderate-to-severe atopic dermatitis. J Eur Acad Dermatol Venereol 2025; 39: e1032–e1035. https://doi.org/10.1111/jdv.20813
- Silverwood RJ, Forbes HJ, Abuabara K, Ascott A, Schmidt M, Schmidt SAJ, et al. Severe and predominantly active atopic eczema in adulthood and long term risk of cardiovascular disease: population based cohort study. BMJ 2018; 361: k1786. https://doi.org/10.1136/bmj.k1786
- Fehr D, Huynh-Tran VH, Maintz L, Niederseer D, Ameri M, Dreher A, et al. Deciphering the connection between atopic dermatitis and cardiovascular diseases: analysis of clinical associations and cardiometabolic proteins. Allergy 2025; 80: 2187–2200. https://doi.org/10.1111/all.16588
- Müller S, Maintz L, Bieber T. Treatment of atopic dermatitis: recently approved drugs and advanced clinical development programs. Allergy 2024; 79: 1501–1515. https://doi.org/10.1111/all.16009
- Oh J, Kim S, Kim MS, Abate YH, Abd ElHafeez S, Abdelkader A, et al. Global, regional, and national burden of asthma and atopic dermatitis, 1990–2021, and projections to 2050: a systematic analysis of the Global Burden of Disease Study 2021. Lancet Respir Med 2025; 13: 425–446. https://doi.org/10.1016/S2213-2600(25)00003-7
- Haag C, Alexis A, Aoki V, Bissonnette R, Blauvelt A, Chovatiya R, et al. A practical guide to using oral Janus kinase inhibitors for atopic dermatitis from the International Eczema Council. Br J Dermatol 2024; 192: 135–143. https://doi.org/10.1093/bjd/ljae342
- Khan SS, Matsushita K, Sang Y, Ballew SH, Grams ME, Surapaneni A, et al. Development and validation of the American Heart Association’s PREVENT equations. Circulation 2024; 149: 430–449. https://doi.org/10.1161/CIRCULATIONAHA.123.067626
- Yew YW, Loh M, Thng STG, Chambers JC. Investigating causal relationships between Body Mass Index and risk of atopic dermatitis: a Mendelian randomization analysis. Sci Rep 2020; 10: 15279. https://doi.org/10.1038/s41598-020-72301-2
- Obesity. [cited 2025 October 3]. Available from: https://www.who.int/health-topics/obesity#tab=tab_1
- Bastard JP, Maachi M, Lagathu C, Kim MJ, Caron M, Vidal H, et al. Recent advances in the relationship between obesity, inflammation, and insulin resistance. Eur Cytokine Netw 2006; 17: 4–12.
- Yang S, Zhu T, Wakefield JS, Mauro TM, Elias PM, Man MQ. Link between obesity and atopic dermatitis: does obesity predispose to atopic dermatitis, or vice versa? Exp Dermatol 2023; 32: 975–985. https://doi.org/10.1111/exd.14801
- Salava A, Salo V, Leppänen J, Lauerma A, Remitz A. Factors associated with severity of atopic dermatitis - a Finnish cross-sectional study. J Eur Acad Dermatol Venereol 2022; 36: 2130–2139. https://doi.org/10.1111/jdv.18378
- la Torre R de, Ureña-Paniego C, Arias-Santiago S, Montero-Vílchez T. Impact of the Mediterranean diet and physical activity on the severity of atopic dermatitis. Dermatitis 2025: 17103568251376645. https://doi.org/10.1177/17103568251376645
- Kesik F, Dogan-Gunaydin S, Fisunoglu M. The impact of diet on hidradenitis suppurativa severity: a cross-sectional case-control study. Medicina 2024; 60: 39768986. https://doi.org/10.3390/medicina60122107
- Kupczyk D, Bilski R, Szeleszczuk Ł, Mądra-Gackowska K, Studzińska R. The role of diet in modulating inflammation and oxidative stress in rheumatoid arthritis, ankylosing spondylitis, and psoriatic arthritis. Nutrients 2025; 17: 1603. https://doi.org/10.3390/nu17091603
- Lorite-Fuentes I, Montero-Vilchez T, Arias-Santiago S, Molina-Leyva A. Potential benefits of the Mediterranean diet and physical activity in patients with hidradenitis suppurativa: a cross-sectional study in a Spanish population. Nutrients 2022; 14: 551. https://doi.org/10.3390/nu14030551
- Kwon YJ, Lee HS, Lee JW. Association between dietary patterns and cardiovascular mortality in patients with metabolic dysfunction-associated steatotic liver disease. Endocrine 2025; 90: 558–569. https://doi.org/10.1007/s12020-025-04365-x
- Huang B, Lin C, Feng Y, Cai S, Zhao M, Hu C, et al. Association between physical activity domains and cardiovascular diseases among US adults: evidence from NHANES 2007–2020. Sci Rep 2025; 15: 35341. https://doi.org/10.1038/s41598-025-19419-3
- Frølunde AS, Drljevic-Nielsen A, Vestergaard C. Atopic dermatitis, hypertension, and cardiovascular risk: an appraisal of the evidence. Ital J Dermatol Venerol 2025; 160: 494–500. https://doi.org/10.23736/S2784-8671.25.08041-7
- Hametner B, Wassertheurer S, Mayer CC, Danninger K, Binder RK, Weber T. Aortic pulse wave velocity predicts cardiovascular events and mortality in patients undergoing coronary angiography: a comparison of invasive measurements and noninvasive estimates. Hypertension 2021; 77: 571–581. https://doi.org/10.1161/HYPERTENSIONAHA.120.15336
- Agoglia L, Peixoto H, Cardoso AC, Barbosa L, Victer CSXL, Carneiro S, et al. Psoriasis and cardiovascular risk: associated and protective factors. An Bras Dermatol 2025; 100: 456–461. https://doi.org/10.1016/j.abd.2024.07.013
- Shalom G, Dreiher J, Kridin K, Horev A, Khoury R, Battat E, et al. Atopic dermatitis and the metabolic syndrome: a cross-sectional study of 116 816 patients. J Eur Acad Dermatol Venereol 2019; 33: 1762–1767. https://doi.org/10.1111/jdv.15642
- Zhong X, Huang D, Chen R, Yao L, Ma R, Yu Y, et al. Positive association between insulin resistance and fatty liver disease in psoriasis: evidence from a cross-sectional study. Front Immunol 2024; 15: 1388967. https://doi.org/10.3389/fimmu.2024.1388967
- Zhang Y, Wei Q, Chen Q. Potential shared mechanisms in atopic dermatitis and type 2 diabetes identified via transcriptomic and machine learning approaches. Sci Rep 2024; 14: 39681684. https://doi.org/10.1038/s41598-024-82732-w
- Ascott A, Mulick A, Yu AM, Prieto-Merino D, Schmidt M, Abuabara K, et al. Atopic eczema and major cardiovascular outcomes: a systematic review and meta-analysis of population-based studies. J Allergy Clin Immunol 2019; 143: 1821–1829. https://doi.org/10.1016/j.jaci.2018.11.030
- Aune D, Sen A, ó’Hartaigh B, Janszky I, Romundstad PR, Tonstad S, et al. Resting heart rate and the risk of cardiovascular disease, total cancer, and all-cause mortality - a systematic review and dose-response meta-analysis of prospective studies. Nutr Metab Cardiovasc Dis 2017; 27: 504–517. https://doi.org/10.1016/j.numecd.2017.04.004
- Brito Díaz B, Alemán Sánchez JJ, Cabrera de León A. Frecuencia cardiaca en reposo y enfermedad cardiovascular. Med Clín 2014; 143: 34–38. https://doi.org/10.1016/j.medcli.2013.05.034
- Gagliardi ACM, Miname MH, Santos RD. Uric acid: A marker of increased cardiovascular risk. Atherosclerosis 2009; 202: 11–17. https://doi.org/10.1016/j.atherosclerosis.2008.05.022
- Sundar Ray C, Singh B, Jena I, Behera S, Ray S. Low alkaline phosphatase (ALP) in adult population: an indicator of zinc (Zn) and magnesium (Mg) deficiency. Curr Res Nutr Food Sci 2017; 5: 347–352. https://doi.org/10.12944/CRNFSJ.5.3.20