REVIEW ARTICLE
Photodynamic Diagnosis of Actinic Keratosis: A Systematic Review
Younes KAZBENNAOU1*† , Marie BOILEAU1,2†, Cyril MAIRE2,3, Nadira DELHEM2, Anne-Sophie DEWALLE2 and Laurent MORTIER1,2
1Department of Dermatology, Claude Huriez Hospital, CHU Lille, Lille, France, 2Inserm, CHU Lille, U1189-ONCO-THAI-Assisted Laser Therapy and Immunotherapy for Oncology, University of Lille, Lille, France, and 3St Jean Dermatology clinic, Arras, France
†These authors contributed equally to this work.
Corr: Younes Kazbennaou, Department of Dermatology, CHU of Lille, Lille, France. *Email: younes.kazbennaou@chu-lille.fr
Key words: actinic keratosis; photodiagnosis; photodynamic therapy; protoporphyrin IX.
Citation: Acta Derm Venereol 2026; 106: adv-2026-0949. DOI: https://doi.org/10.2340/actadv.v106.adv-2026-0949.
Copyright: 2026 ©Author(s). Published by MJS Publishing, on behalf of the Society for Publication of Acta Dermato-Venereologica. This is an Open Access article distributed under the terms of the Creative Commons Attribution-NonCommercial 4.0 International License (https://creativecommons.org/licenses/by-nc/4.0/).
Submitted: Aug 16, 2026. Accepted after revision: Aug 24, 2026.
Published: Sept 23, 2026.
Competing interests and funding: The authors have no conflicts of interest to declare.
The data that support the findings of this study are available from the corresponding author upon reasonable request.
Actinic keratosis is a precancerous condition typically diagnosed by hyperkeratotic papules. The concept of field cancerization suggests subclinical lesions surround visible actinic keratoses. Photodynamic diagnosis is a noninvasive imaging modality that can im-prove actinic keratosis diagnosis and treatment assessment. This systematic review describes current evidence regarding photodynamic diagnosis modalities for actinic keratosis. We searched MEDLINE and Embase through 28 February 2025. Data synthesis was descriptive due to methodological heterogeneity across studies. Thirty-seven studies were included. Methyl aminolevulinate and aminolevulinic acid were used in 54% and 51% of studies, respectively. Incubation times ranged from 20 to 1080 min, 70% of studies followed a 3-h protocol. Most excitation sources (89%) emitted light within the 400–410 nm range, often via clinical-grade systems (54%). Imaging hardware varied: 54% used integrated clinical systems, 30% used independent cameras. Fluorescence quantification was described in 62% of studies, and 54% used specialized analysis software. Patient positioning was rarely reported (8%). This review highlights significant methodological heterogeneity in actinic keratosis photodynamic diagnosis, particularly in photosensitizer protocols and imaging systems. While clinical-grade systems provide standardization, low-cost alternatives enhance accessibility. However, lack of procedural consistency limits comparability. Future efforts should focus on advancing standardized protocols to support broader clinical validation and adoption.
SIGNIFICANCE
Actinic keratosis is a precancerous skin condition that develops on chronically sun-exposed skin. It can be challenging to identify the full extent of actinic keratoses because some lesions are barely visible. Photodynamic diagnosis – a light-based imaging technique – helps spot these hidden lesions and assess treatment success. We reviewed published studies to see if common protocols exist for photodynamic diagnosis and how to move towards a standardized approach. While studies shared show similarities, we found major variations in how photodynamic diagnosis was conducted, making it difficult to directly compare results across studies.
INTRODUCTION
Actinic keratosis (AK) is a common precancerous skin condition induced by repeated ultraviolet (UV) exposure, and thus typically developing on sun-exposed areas such as the face, scalp and dorsal hands (1, 2, 3). Established risk factors include cumulative UV exposure, advanced age, fair skin (Fitzpatrick phototypes I–II) and immunosuppression (4, 5, 6). AK represents the visible manifestation of a broader subclinical process known as field cancerization, in which seemingly normal perilesional skin also harbours UV-induced molecular damage (7, 8). Contemporary management therefore targets both the clinically apparent lesions and the surrounding field to achieve durable remission and reduce recurrence.
While many AKs remain stable or regress spontaneously, a small proportion may progress to invasive cutaneous squamous cell carcinoma (cSCC). Reported annual transformation rates ranged from 0.025% to 16% over follow-up periods of 1–10 years in a review of 5 studies by Glogau et al. (9). The variability of this rate could be explained by several factors such as differences in the patients’ age across studies, the severity of AK and the extent of field cancerization. Indeed, transformation risk rises with the number of lesions and the extent of field cancerization, highlighting the importance of field-directed therapeutic strategies (10).
Several noninvasive imaging modalities enable the visualization of the subclinical disease and thus the delineation of the limits of the field cancerization. Dermoscopy enhances diagnostic accuracy and correlates well with histopathological findings (11). Reflectance confocal microscopy (RCM) offers near-histological resolution in vivo and can detect microscopic changes before they are clinically evident (12, 13). Optical coherence tomography (OCT) is valuable for early identification of keratinocytic neoplasia (14, 15). Line-field confocal optical coherence tomography (LC-OCT) provides high resolution and horizontal, vertical and 3-dimensional section images (16) that can be used for monitoring the efficacy of various treatments (17). Nonetheless, dermoscopy, RCM, OCT and LC-OCT can assess only a limited field of view at a time (<1 cm²), and they only provide anatomical information but not functional insights. Among the imaging modalities, fluorescence-based photodynamic diagnosis (PDD) is the only one that offers such functional assessment and can evaluate a whole field cancerization at once.
After topical application, aminolevulinic acid (ALA) or methyl-aminolevulinate (MAL) enters the cells, where it is metabolized to the photosensitizer protoporphyrin IX (PpIX). Due to alterations in several cellular mechanisms (heme biosynthesis, mitochondrial functions, PpIX efflux, etc.), the metabolized PpIX accumulates in the dysplastic keratinocytes up to 4 times more compared to healthy cells (18). This preferential accumulation is the basis for selective fluorescence detection of dysplastic keratinocytes, commonly referred to as photodynamic diagnosis (PDD), a companion procedure to photodynamic therapy (PDT), a commonly used treatment for AK. In fact, under blue light (400–410 nm), PpIX emits visible red fluorescence (600–700 nm) (19), that enables real-time visualization of both clinical and subclinical lesions (20, 21, 22). This fluorescence results from the return of PpIX to ground state after excitation by the blue light.
The first descriptions of PDD for AK followed the development of PDT with ALA in the 1990s (23, 24). The objective was to assess in vivo PpIX production after incubation with ALA. A Wood’s lamp emitting ultraviolet light was applied to induce PpIX fluorescence and the qualitative assessment of this fluorescence was used to predict sensibility to PDT. This simple technique is still used nowadays but, as subsequently established by the present manuscript, more sophisticated methods have been recently developed to optimize PDD. Since these early applications, the methodology of PDD has progressively evolved with the development of more advanced and quantitative technologies. Several clinical trials, including some reported in the present review, have used PDD to assess AK treatments; however, no gold standard for this technique has yet been established.
This is to our knowledge the first systematic review that aims to summarize current evidence on PDD for AK and field cancerization, discuss technical considerations, and explore its potential integration into clinical practice.
MATERIALS AND METHODS
Search strategy and selection criteria
A comprehensive search of the MEDLINE and Embase databases was performed from their inception to 28 February 2025. The search used the following terms: (“fluorescence” OR “fluorescent”) AND (“actinic keratosis” OR “actinic keratoses”). The following MeSH terms were also used to try to broaden the search: "keratosis, actinic” [MeSH Terms], “photochemotherapy” [MeSH Terms], “aminolevulinic acid” [MeSH Terms], “skin neoplasms” [MeSH Terms], “fluorescence” [MeSH Terms]. Only articles in English were included.
Screening and data extraction
Two independent reviewers screened titles and abstracts, evaluated full texts for eligibility, and extracted data using a dedicated data extraction sheet. Discrepancies were resolved by consensus.
Inclusion criteria
The following inclusion criteria were applied for this review: human studies involving AK or field cancerization assessed with PpIX fluorescence and English articles.
Exclusion criteria
Ex-vivo studies, nonhuman studies, reviews and conference abstracts without full text were excluded from this review. The articles in which fluorescence was not assessed via imaging techniques ((e.g.) studies that used spectroscopy probes only) were also excluded.
Data items
The following data were collected from the selected articles: precursor type and concentration, incubation parameters, standardization of the patient’s position, illumination system (light source, excitation wavelength), acquisition system (camera…), image treatment and fluorescence assessment.
PRISMA compliance
The review adheres to PRISMA 2020. A completed checklist is provided in Appendix S1. This review was not registered, and no protocol was prepared, as the intended descriptive synthesis did not involve statistical analyses requiring predefined analytical methods.
Data synthesis
Given the substantial methodological heterogeneity across studies — particularly in photosensitizer precursor concentration, incubation time, excitation wavelength, imaging hardware and data presentation – no quantitative meta-analysis could be performed. Instead, we calculated proportions to characterize how frequently specific technical choices were reported ((e.g.) percentage of studies using MAL vs ALA vs both, percentage of studies for each incubation time, percentage of studies including calibration methods). Continuous variables are summarized descriptively.
RESULTS
Study selection
A total of 324 records were originally identified through systematic database searching; after removing duplicates (94) and applying automation tools (“article” and “letter” filter on EMBASE), 140 titles and abstracts were screened. Thirty-seven full-text articles were appropriate for inclusion (PRISMA flow-chart, Fig. 1) (24, 25, 26, 27, 28, 29, 30, 31, 32, 33, 34, 35, 36, 37, 38, 39, 40, 41, 42, 43, 44, 45, 46, 47, 48, 49, 50, 51, 52, 53, 54, 55, 56, 57, 58). No previous review was found.
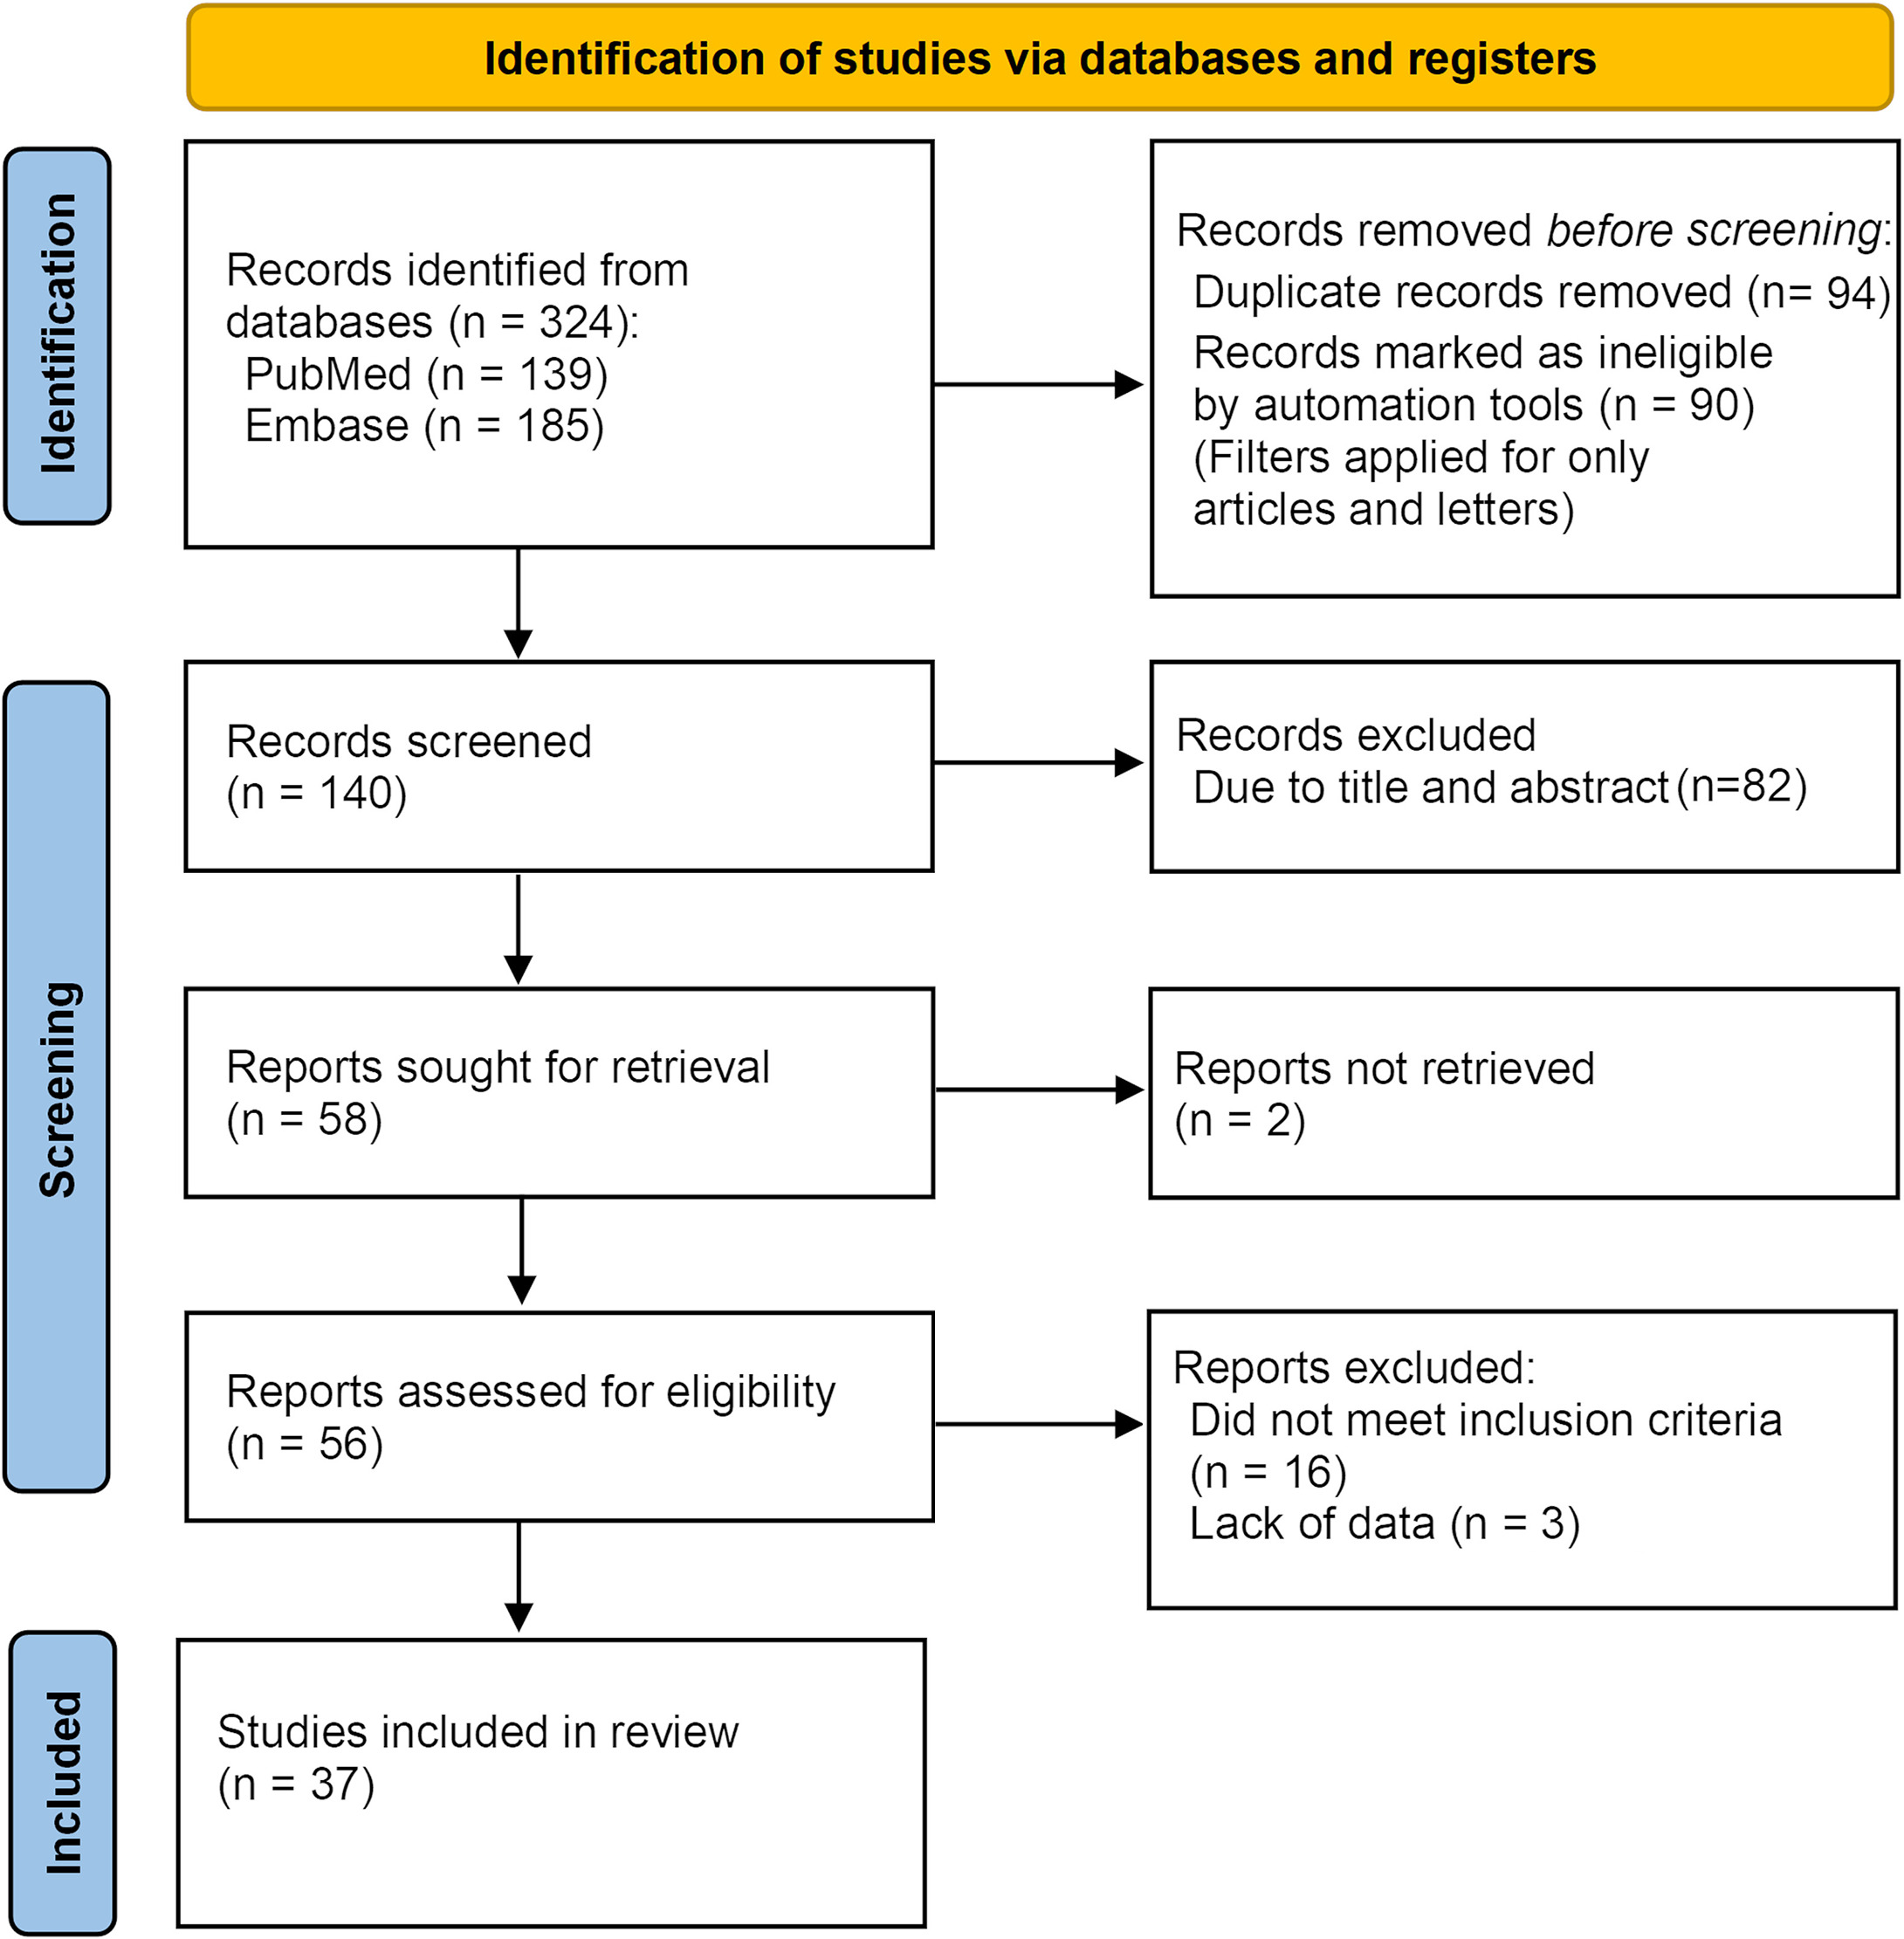
Fig. 1. PRISMA flow chart. PRISMA (Preferred Reporting Items for Systematic Reviews and Meta-Analyses) flow diagram representing the process of identifying, screening, and selecting studies for the systematic review.
The data collection form is provided in Table I and data items are summarized in Fig. 2.
Table I. Extracted data in studies on PDD of AK
| Author (Year) | Photosensitizer (type, concentration) | Incubation (min) | Excitation λ (nm) | Imaging device | Fluorescence assessment | Standardization of the patient’s position |
|---|---|---|---|---|---|---|
| Smits T et al. (2005) | 5-ALA20% | 3 h | 407 nm | Dyaderm system | Arbitrary units using ImageJ software | NA |
| Smits T et al. (2007) | 5-ALA20% | 3 h | 370–440 nm | Dyaderm system | Arbitrary units using ImageJ software | NA |
| Fauteck JD et al. (2008) | 5-ALA(patch, 2 mg/cm²) | 2 to 5 h | 370–440 nm | Dyaderm system | Relative fluorescence intensity | NA |
| Kleinpenning MM et al. (2010) | MAL | 3 h | 370–440 nm | Dyaderm system | Quantification (not detailed) | NA |
| de Leeuw J et al. (2009) | 5-ALA (liposomal) | 2.5 ha | 405 nm | Dyaderm system | Fluorescence scale from green to red automatically provided by the computer | NA |
| Tyrrell J et al. (2010) | MAL16% | 3 h | 370–440 nm | Dyaderm system | Arbitrary units using ImageJ software | NA |
| Tyrrell JS et al. (2010) | MAL16% | 3 h | 407 nm | Dyaderm system | Arbitrary units using ImageJ software | NA |
| Tyrrell JS et al. (2011) | MAL16% | 3 h | 407 nm | Dyaderm system | Arbitrary units using ImageJ software | NA |
| Blake E et al. (2013) | MAL16% | 3 h | 370–440 nm | Dyaderm system | Arbitrary units using ImageJ software | NA |
| Tyrrell J et al. (2019) | MAL16% | 3 h | 370–440 nm | Dyaderm system | Arbitrary units using ImageJ software | NA |
| Wiegell SR et al. (2008) | MAL16% | 3 h | 365 And 405 nm |
Medeikonos system | Calibration using a fluorescence standard: arbitrary units (AU) | NA |
| Wiegell SR et al. (2009) | MAL16% | 3 h | 365 and 405 nm | Medeikonos system | Arbitrary units using matlab program and calibration standard | NA |
| Togsverd-Bo et al. (2012) | MAL16% | 3 h | 365 and 405 nm | Medeikonos system | Calibration using a fluorescence standard: arbitrary units (AU) | NA |
| Petersen B et al. (2014) | MAL16% | 3 h | 365 and 405 nm | Medeikonos system | Arbitrary units using matlab program and calibration standard | NA |
| Wiegell SR et al. (2014) | MAL16% | 3 h | 365 and 405 nm | Medeikonos system | Arbitrary units using matlab program and calibration standard | NA |
| Wiegell SR et al. (2016) | MAL16% | 30 min to 3 h | 365 and 405 nm | Medeikonos system | Calibration using a fluorescence standard. arbitrary units (AU) | NA |
| Rossi A et al. (2016) | MAL16% | 100–120 min | 340–420 nm | FotoFinder system | Manual grading of fluorescence intensity+extension of fluorescence | Distance of 10 cm from the skin |
| Bartosińska J et al. (2022) | 5-ALA | 3 h | Not stated | FotoFinder system | Manual grading of fluorescence intensity and distribution of fluorescence | NA |
| Szeimies RM et al. (2002) | 5-ALA20% | 4 h | 365 and405 nm | Camera | Relative fluorescence intensity | NA |
| Ericson et al. (2004) | 5-ALA20% | 3 h | 365 and 405 nm | Camera | Fluorescence relative units using reference markers | NA |
| Sieroń A et al. (2004) | 5-ALA20% | 10 h | 442 nm | Camera | Presence or absence of fluorescence | NA |
| Puizina-Ivić N et al. (2008) | 5-ALA20% | 5 h | 405 nm | Camera | Manual grading of fluorescence intensity | NA |
| Ortonne JP et al. (2010) | MAL (concentration not provided) |
3 h | Not stated | Camera | Count of fluorescent lesions | Same position and distance. Previous photograph was used to orientate subject and camera. |
| Van der Beek N et al. (2012) | 5-ALA (liposomal) (concentration not provided) | 2.5 ha | 407 nm | Camera | Non-normalized and normalized PpIX fluorescence relative to the auto-fluorescence | NA |
| Neittaanmäki-Perttu N et al. (2013) | MAL16% | 3–4 h | NA | Camera | Delimitation of the fluorescence | NA |
| Piffaretti F et al. (2013) | MAL16% | 3 h | Not stated | Camera | Mean fluorescence intensity of using a reference fluorescing spot. arbitrary units (AU) | Device’s orientation and angle with respect to the lesion precisely defined and kept constant for each fluorescent measurement |
| Kulyk O et al. (2015) | MAL16% or 5-ALA10% | 3 h | 405 nm | Camera | Arbitrary units using matlab program | NA |
| Kim BK et al. (2015) | MAL16% | 3 h | 365 nm | Camera | Count of fluorescent lesions | UV lamp at 11 cm from the skin |
| Bobyr I et al. (2019) | 5-ALA20% | 3 h | NA | Camera | Gradation of fluorescence intensity from 0 to 255 | NA |
| Willey A et al. (2019) | 5-ALA20% | 20 min (+skin heating) | 403–432 nm | Camera | Scale of 0 to 255 using Image Pro analysis software | NA |
| Li L et al. (2024) | 5-ALA20% | 3 h | 385–405 nm | Camera | Manual grading of fluorescence intensity+field cancerization delimitation using ImageJ colour histogram | NA |
| Fernández-Guarino M et al. (2020) | MAL16% or 5-ALA10% | 2 h | NA | Smartphone | No | NA |
| Korecka et al. (2024) | 5-ALA10% | 3 h | 365 nm | Smartphone | Manual grading of fluorescence intensity | NA |
| Jeffes EW et al. (2001) | 5-ALA20% | 14 to 18 h | Not stated | NA | Manual grading of fluorescence intensity | NA |
| Buinauskaite E et al. (2013) | 5-ALA20% | 4 h | NA | NA | Manual grading of fluorescence intensity | NA |
| Sorbellini E et al. (2019) | MAL5% | 30 min | NA | NA | Count of fluorescent lesions | NA |
|
aRepeated applications every 5 min AK: Actinic keratosis; PDD: Phtodynamic diagnosis. |
||||||
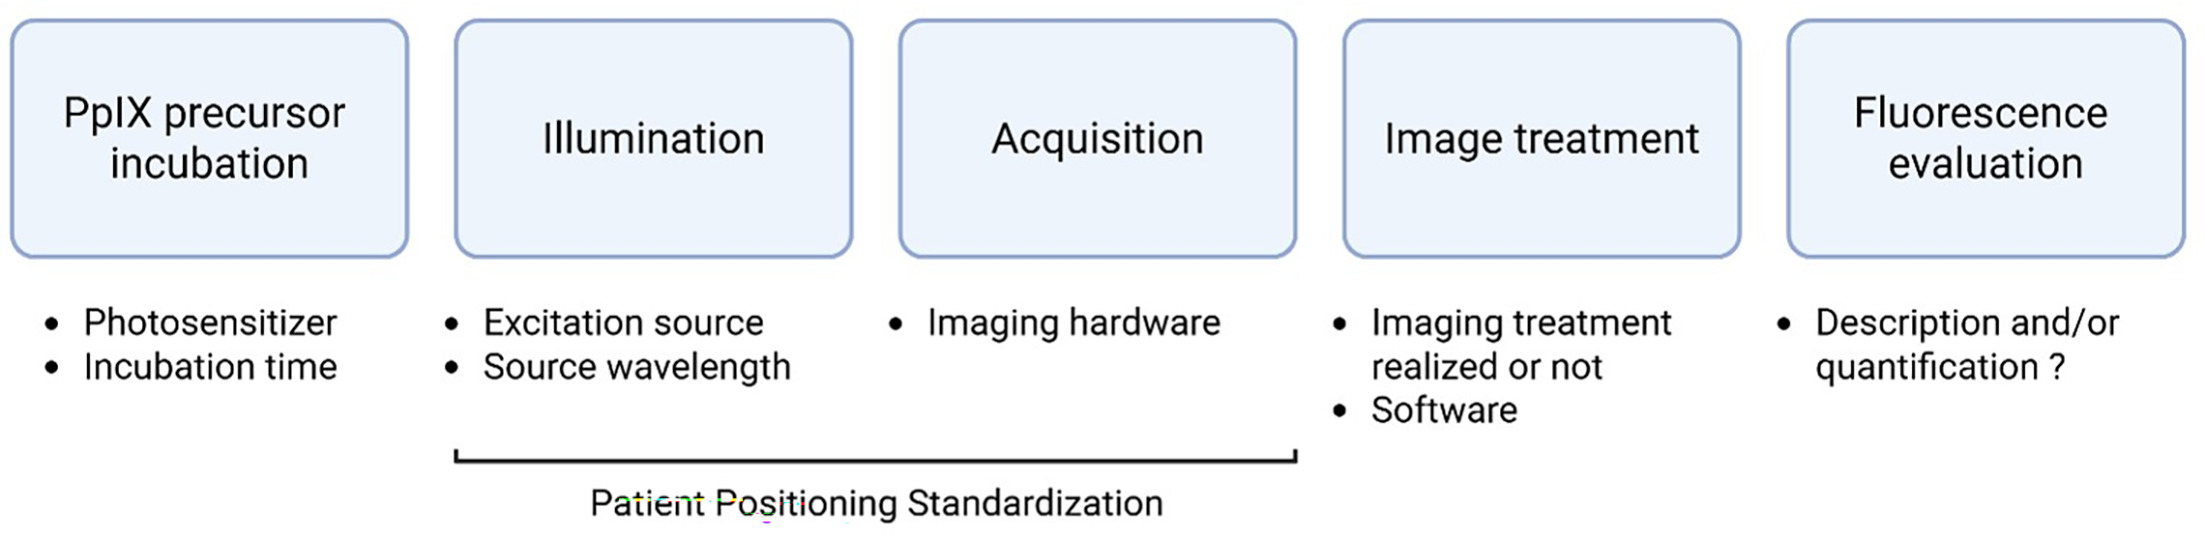
Overview of techniques reported
– Photosensitizer: MAL was used in 54% of studies and ALA in 51% (some studies reported the use of both photosensitizers (5%)).
– Incubation time: Reported incubation time ranged from 20 to 1,080 min. A 3 h incubation time was used in 70% of studies, which is the recommended incubation time for conventional PDT with most of the currently commercially available PpIX precursors.
– Excitation source: More than 54 % of the light sources used were clinical-grade fluorescence systems: the Dyaderm system (Biocam GmbH, Regensburg, Germany) (30%), the Medeikonos system (Medeikonos AB, Gothenburg, Sweden) (19%) and the FotoFinder dermoscope system (FotoFinder Systems GmbG, Bad Birnbach, Germany) (5%); other light sources included Wood’s lamp (16%), UV dermoscope Dermlite DL5 (DermliteLLC, Aliso Viejo) (3%) or another kind of blue lamp (LEDs or other) (27%). Among articles that reported spectral information on the light source (73%), the central wavelength was between 400 and 410 nm in 89%, 365 nm in 7% and 442 nm in 4%. Fig. 3.
– Fluorescence acquisition hardware: Independent cameras were employed in 30% of studies, clinical-grade fluorescence systems in 54%, and smartphone-adapted devices in 5%. No information was reported on the acquisition hardware in the remaining 11% of the studies (Fig. 4).
– Image treatment and fluorescence assessment: 54% of the studies reported the use of an image treatment software (e.g. ImageJ) and calibration using a reference standard was often done. Fluorescence intensity could be either precisely quantified (62%) or graded on a scale from high to low or described according to its disposition or extension (22%).
– Standardization of the patient’s position: Only 3 articles (8%) reported information about the distance between the light source and the skin, or the orientation and angle between the skin and light source. (Table II)
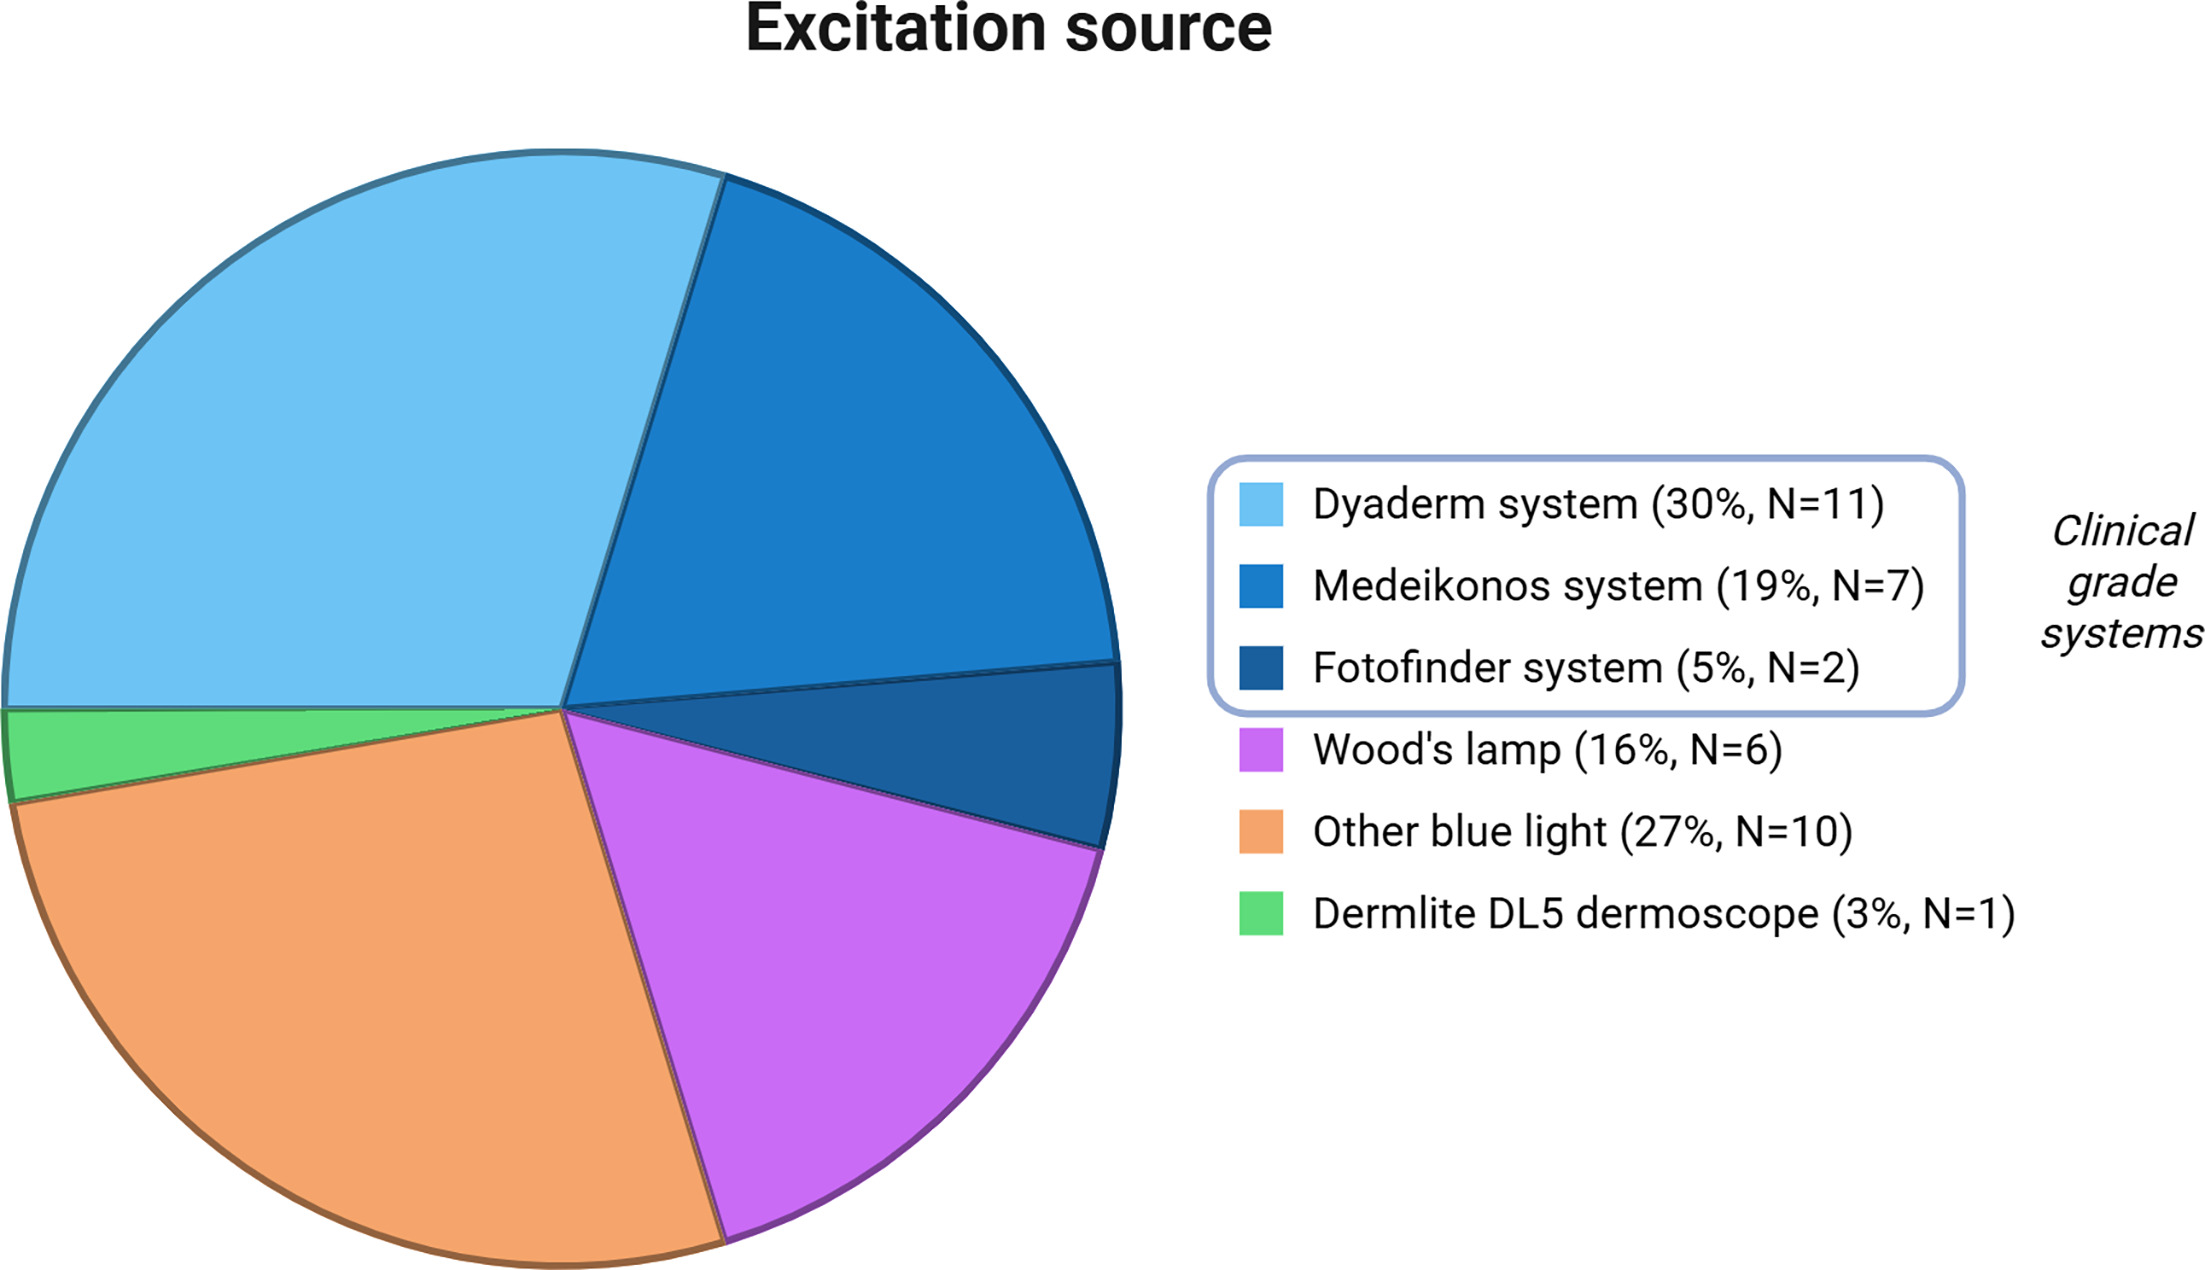
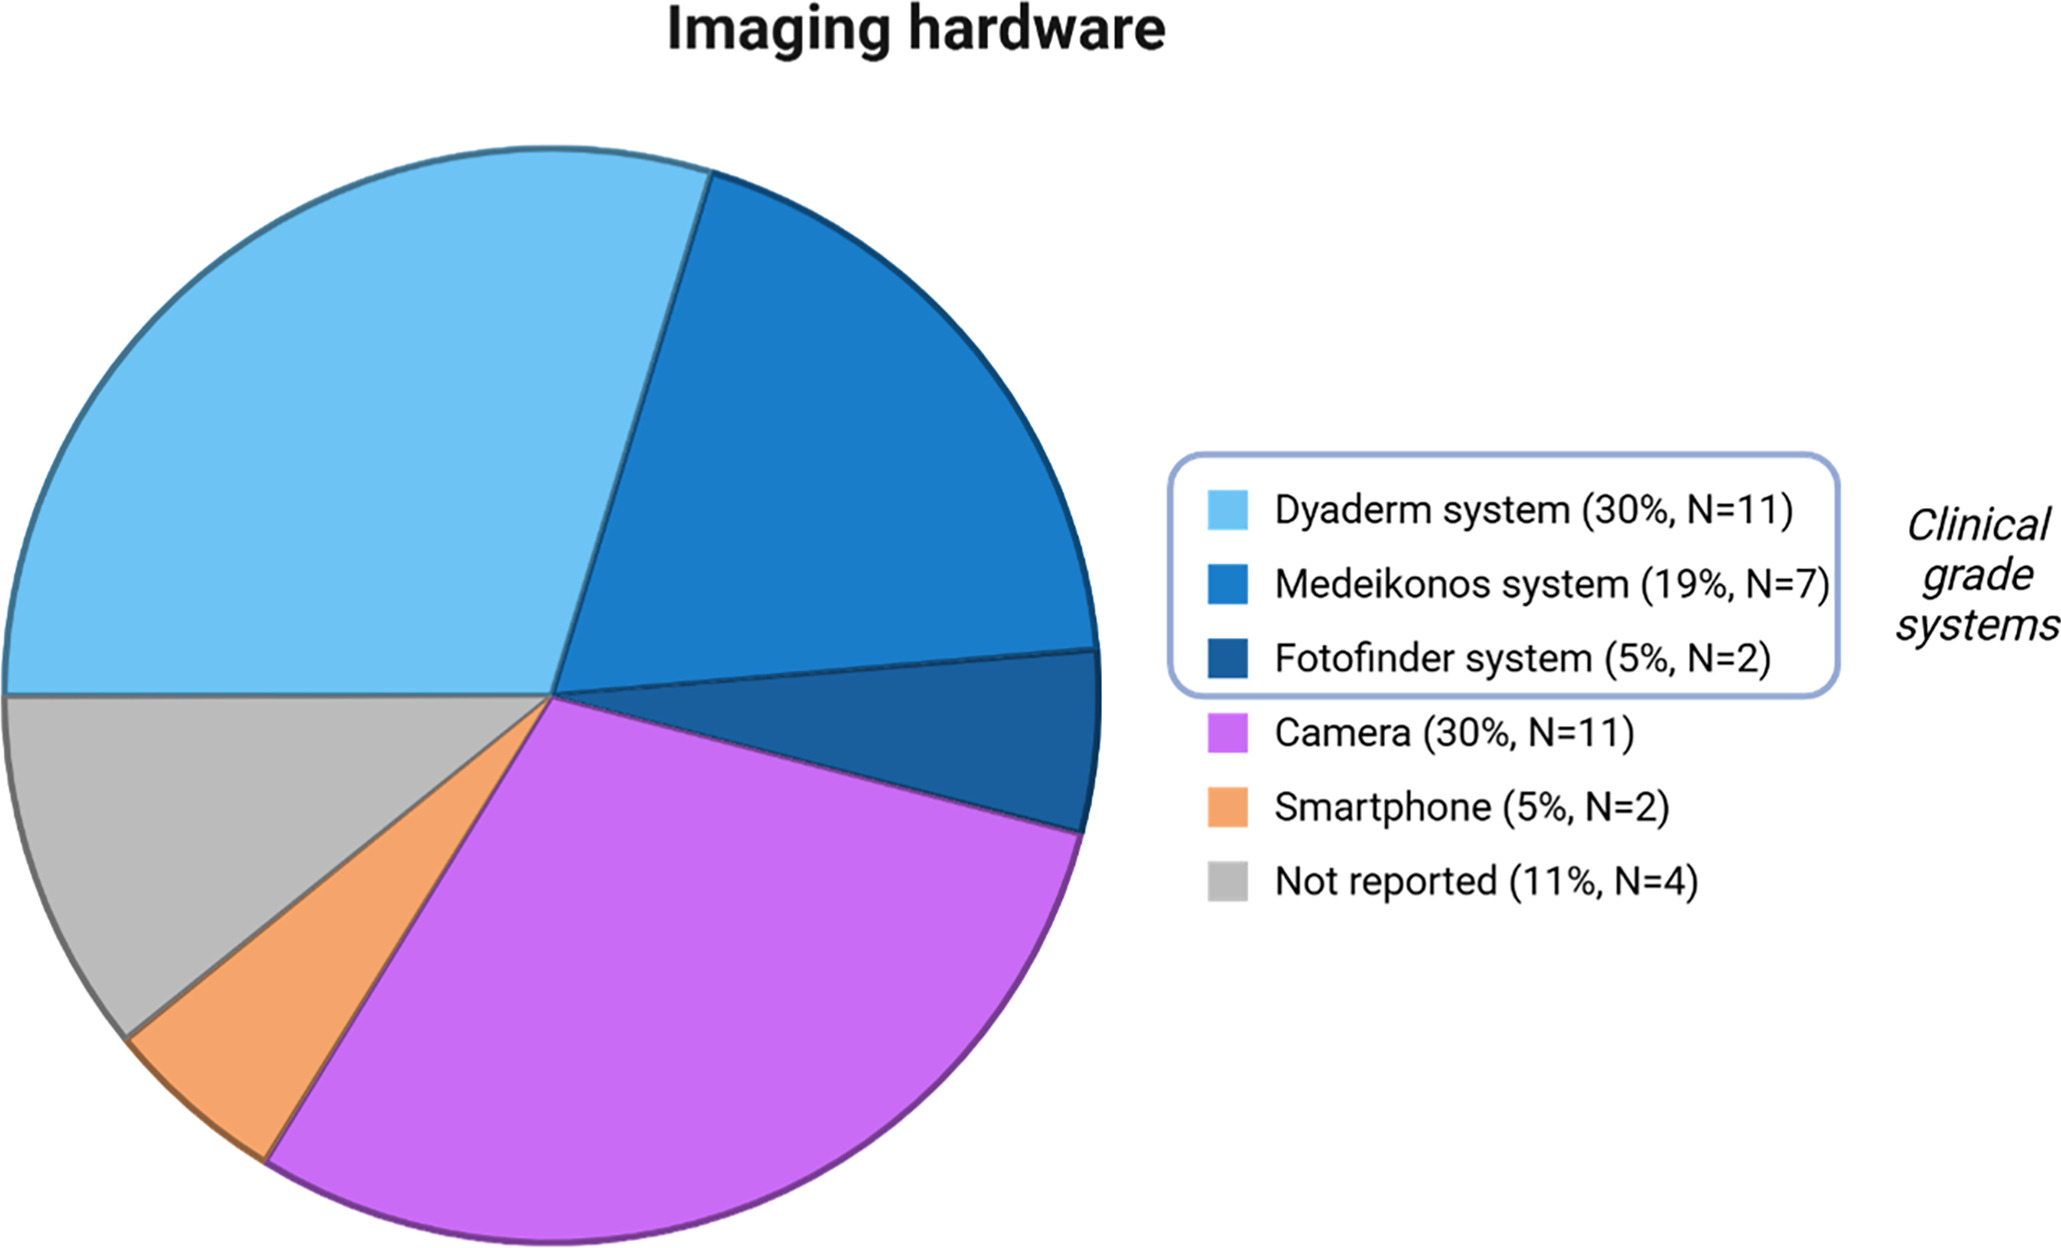
Table II. Summary of technical parameters in studies on PDD of AK (n=37)
| Category | Parameter | Studies n (%) |
|---|---|---|
| Photosensitizer | Methyl aminolevulinate (MAL) | 20 (54%)* |
| Aminolevulinic acid (ALA) | 19 (51%)* | |
| Both MAL and ALA | 2 (5%) | |
| Incubation time | 3 h | 26 (70%) |
| Other (20–1080 min) | 11 (30%) | |
| Excitation source | Source types | |
| Clinical-grade fluorescence system | 20 (54%) | |
| - Dyaderm system | 11 (30%) | |
| - Medeikonos system | 7 (19%) | |
| - FotoFinder system | 2 (5%) | |
| Wood’s lamp | 6 (16%) | |
| UV dermoscope ((e.g.) dermlite DL5) | 1 (3%) | |
| Other blue light ((e.g.) LEDs) | 10 (27%) | |
| Source wavelength | ||
| Wavelength reported as 400–410 nm | 24 (65%) | |
| 365 nm | 2 (5%) | |
| 442 nm | 1 (3%) | |
| Not reported | 10 (27%) | |
| Imaging hardware | Clinical-grade fluorescence system | 20 (54%) |
| Separate camera | 11 (30%) | |
| Smartphone-adapted device | 2 (5%) | |
| Not reported | 4 (11%) | |
| Image treatment | Image processing software used ((e.g.) ImageJ) | 20 (54%) |
| None or not specified | 17 (46%) | |
| Fluorescence assessment | Quantitative fluorescence measurement | 23 (62%) |
| Semi-quantitative or descriptive assessment | 8 (22%) | |
| None or not specified | 6 (16%) | |
| Patient positioning standardization | Protocol described | 3 (8%) |
| None or not specified | 34 (92%) | |
|
Notes: - *Some studies reported more than one photosensitizer, so percentages may exceed 100%. |
||
DISCUSSION
To our knowledge, this is the first systematic review to describe and summarize the technical landscape of photodynamic diagnosis (PDD) for actinic keratosis (AK) and field cancerization.
Across studies, PDD mostly involved (i) incubation with a protoporphyrin IX precursor and (ii) excitation with violet–blue light (400–410 nm), to induce red fluorescence (600 to 700 nm) detectable by cameras or eyes. Subsequent image processing – to quantify signal intensity or enhance lesion visibility – was often described.
Two PDD implementation strategies dominate. On the one hand, commercial systems integrate dedicated blue-light sources, cameras and post-treatment software, offering reproducibility at a high cost. On the other hand, custom-built or “low-cost” set-ups repurpose and combine readily available components ((e.g.) Wood’s lamp, smartphone), enhancing accessibility but at the expense of standardization.
Standardization is a critical barrier to effective comparability. First fluorescence intensity is highly dependent on precursor type, concentration and application volume, all 3 of which unfortunately vary widely across studies. Then, fluorescence intensity is subject to excitation specifications (intensity) that are rarely reported in detail. Finally, fluorescence intensity depends on the source-to-skin distance, camera angle, ambient lighting, yet only 3 studies specified a systematic positioning protocol. This heterogeneity limits meta-analysis and hinders the establishment of reference thresholds.
Understanding these methodological variants can help clinicians tailor PDD to their practice. Where longitudinal or inter-patient comparisons are required, strict protocol harmonization including fixed geometry and calibrated light source is critical and essential. Precise reporting of each procedural step would facilitate the development of a global reference method and accelerate multicentre validation.
Finally, large prospective trials are required to assess the diagnostic performance of PDD compared to histopathology and emerging high-resolution imaging modalities such as line-field confocal optical coherence tomography or reflectance confocal microscopy. Whether PDD ultimately occupies a screening, triage or therapy-monitoring niche will depend on such performance assessment. The current diversity of techniques may signal a lack of consensus, but it also underscores the inherent simplicity of PDD: with minimal equipment, clinically useful fluorescence can be obtained. Custom systems offer affordability, whereas integrated platforms provide reproducibility.
This review has several limitations. First, only English-language studies were included, potentially introducing language bias. Second, the specific clinical rationale for employing PDD was not extracted due to substantial variability across studies, limiting insights into the motivation behind methodological choices. Third, publication bias might exist, meaning the techniques most frequently used in clinical practice could differ from those reported in published literature.
An ideal photodiagnosis device should demonstrate high efficacy with a short incubation time, allowing rapid and practical clinical application. It should enable the assessment of large skin areas – such as the entire scalp – in a single acquisition to enhance efficiency and patient comfort. Ensuring reproducible fluorescence measurements within the same patient over time is critical for reliable longitudinal evaluation. Moreover, a portable system operating independently of ambient lighting conditions would facilitate standardized use across diverse clinical environments and support broader implementation of photodiagnosis techniques in dermatologic practice. The implementation of artificial intelligence to PDD could be highly valuable in terms of fluorescence quantification and discrimination between malignant and benign tissue, independently from user experience.
Other imaging modalities such as LC-OCT could benefit from the combination with PDD, to obtain both anatomical and functional evaluation.
REFERENCES
- Moy RL. Clinical presentation of actinic keratoses and squamous cell carcinoma. J Am Acad Dermatol 2000; 42: 8–10. https://doi.org/10.1067/mjd.2000.103343
- Khanna R, Bakshi A, Amir Y, Goldenberg G. Patient satisfaction and reported outcomes on the management of actinic keratosis. Clin Cosmet Investig Dermatol 2017; 10: 179–184. https://doi.org/10.2147/CCID.S121323
- Richard MA, Amici JM, Basset-Seguin N, Claudel JP, Cribier B, Dreno B. Management of actinic keratosis at specific body sites in patients at high risk of carcinoma lesions: expert consensus from the AKTeamTM of expert clinicians. J Eur Acad Dermatol Venereol 2018; 32: 339–346. https://doi.org/10.1111/jdv.14753
- Rosen T, Lebwohl MG. Prevalence and awareness of actinic keratosis: barriers and opportunities. J Am Acad Dermatol 2013; 68: S2–9. https://doi.org/10.1016/j.jaad.2012.09.052
- Flohil SC, van der Leest RJT, Dowlatshahi EA, Hofman A, de Vries E, Nijsten T. Prevalence of actinic keratosis and its risk factors in the general population: the Rotterdam Study. J Invest Dermatol 2013; 133: 1971–1978. https://doi.org/10.1038/jid.2013.134
- Euvrard S, Kanitakis J, Pouteil-Noble C, Dureau G, Touraine JL, Faure M, et al. Comparative epidemiologic study of premalignant and malignant epithelial cutaneous lesions developing after kidney and heart transplantation. J Am Acad Dermatol 1995; 33: 222–229. https://doi.org/10.1016/0190-9622(95)90239-2
- Malvehy J. A new vision of actinic keratosis beyond visible clinical lesions. J Eur Acad Dermatol Venereol 2015; 29 Suppl 1: 3–8. https://doi.org/10.1111/jdv.12833
- Willenbrink TJ, Ruiz ES, Cornejo CM, Schmults CD, Arron ST, Jambusaria-Pahlajani A. Field cancerization: definition, epidemiology, risk factors, and outcomes. J Am Acad Dermatol 2020; 83: 709–717. https://doi.org/10.1016/j.jaad.2020.03.126
- Glogau RG. The risk of progression to invasive disease. J Am Acad Dermatol 2000; 42: 23–24. https://doi.org/10.1067/mjd.2000.103339
- Marks R, Rennie G, Selwood Thomas S. Malignant transformation of solar keratoses to squamous cell carcinoma. Lancet 1988; 331: 795–797. https://doi.org/10.1016/S0140-6736(88)91658-3
- Huerta-Brogeras M, Olmos O, Borbujo J, Hernández-Núñez A, Castaño E, Romero-Maté A, et al. Validation of dermoscopy as a real-time noninvasive diagnostic imaging technique for actinic keratosis. Arch Dermatol 2012; 148: 1159–1164. https://doi.org/10.1001/archdermatol.2012.1060
- Ulrich M, Maltusch A, Rius-Diaz F, Röwert-Huber J, González S, Sterry W, et al. Clinical applicability of in vivo reflectance confocal microscopy for the diagnosis of actinic keratoses. Dermatol Surg 2008; 34: 610–619. https://doi.org/10.1111/j.1524-4725.2007.34117.x
- Ulrich M, Krueger-Corcoran D, Roewert-Huber J, Sterry W, Stockfleth E, Astner S. Reflectance confocal microscopy for noninvasive monitoring of therapy and detection of subclinical actinic keratoses. Dermatology 2010; 220: 15–24. https://doi.org/10.1159/000254893
- Maier T, Braun-Falco M, Laubender RP, Ruzicka T, Berking C. Actinic keratosis in the en-face and slice imaging mode of high-definition optical coherence tomography and comparison with histology. Br J Dermatol 2013; 168: 120–128. https://doi.org/10.1111/j.1365-2133.2012.11202.x
- Boone MALM, Norrenberg S, Jemec GBE, Del Marmol V. Imaging actinic keratosis by high-definition optical coherence tomography. Histomorphologic correlation: a pilot study. Exp Dermatol 2013; 22: 93–97. https://doi.org/10.1111/exd.12074
- Ogien J, Tavernier C, Fischman S, Dubois A. Line-field confocal optical coherence tomography (LC-OCT): principles and practical use. Ital J Dermatol Venerol 2023; 158: 171–179. https://doi.org/10.23736/S2784-8671.23.07613-2
- Lacarrubba F, Verzì AE, Polita M, Aleo A, Micali G. Line‐field confocal optical coherence tomography in the treatment monitoring of actinic keratosis with tirbanibulin: a pilot study. Acad Dermatol Venereol 2023; 37: e1131–3. https://doi.org/10.1111/jdv.19147
- Yang X, Palasuberniam P, Kraus D, Chen B. Aminolevulinic acid-based tumor detection and therapy: molecular mechanisms and strategies for enhancement. IJMS 2015; 16: 25865–25880. https://doi.org/10.3390/ijms161025865
- Blume JE, Oseroff AR. Aminolevulinic acid photodynamic therapy for skin cancers. Dermatol Clin 2007; 25: 5–14. https://doi.org/10.1016/j.det.2006.09.005
- Ortonne JP, Gupta G, Ortonne N, Duteil L, Queille C, Mallefet P. Effectiveness of cross polarized light and fluorescence diagnosis for detection of sub‐clinical and clinical actinic keratosis during imiquimod treatment. Exp Dermatol 2010; 19: 641–647. https://doi.org/10.1111/j.1600-0625.2009.01047.x
- Braathen LR, Morton CA, Basset‐Seguin N, Bissonnette R, Gerritsen MJP, Gilaberte Y, et al. Photodynamic therapy for skin field cancerization: an international consensus. International Society for Photodynamic Therapy in Dermatology. Acad Dermatol Venereol 2012; 26: 1063–1066. https://doi.org/10.1111/j.1468-3083.2011.04432.x
- Zeitouni NC, Schlesinger T, Kheterpal M, Jolly PS, Jagdeo J. 5-aminolevulinic acid photodynamic therapy for the treatment of basal and squamous cell carcinoma: a systematic review. Photodiagnosis Photodyn Ther 2025; 54: 104649. https://doi.org/10.1016/j.pdpdt.2025.104649
- Kennedy JC, Pottier RH. Endogenous protoporphyrin IX, a clinically useful photosensitizer for photodynamic therapy. J Photochem Photobiol B 1992; 14: 275–292. https://doi.org/10.1016/1011-1344(92)85108-7
- Jeffes EW, McCullough JL, Weinstein GD, Fergin PE, Nelson JS, Shull TF, et al. Photodynamic therapy of actinic keratosis with topical 5-aminolevulinic acid. A pilot dose-ranging study. Arch Dermatol 1997; 133: 727–732.
- Piffaretti F, Zellweger M, Kasraee B, Barge J, Salomon D, van den Bergh H, et al. Correlation between protoporphyrin IX fluorescence intensity, photobleaching, pain and clinical outcome of actinic keratosis treated by photodynamic therapy. Dermatology 2013; 227: 214–225. https://doi.org/10.1159/000353775
- van der Beek N, de Leeuw J, Demmendal C, Bjerring P, Neumann HAM. PpIX fluorescence combined with auto-fluorescence is more accurate than PpIX fluorescence alone in fluorescence detection of non-melanoma skin cancer: an intra-patient direct comparison study. Lasers Surg Med 2012; 44: 271–276. https://doi.org/10.1002/lsm.21134
- Wiegell SR, Petersen B, Wulf HC. Pulse photodynamic therapy reduces inflammation without compromising efficacy in the treatment of multiple mild actinic keratoses of the face and scalp: a randomized clinical trial. Br J Dermatol 2016; 174: 979–984. https://doi.org/10.1111/bjd.14465
- Smits T, Kleinpenning MM, Blokx WAM, van de Kerkhof PCM, van Erp PEJ, Gerritsen MJP. Fluorescence diagnosis in keratinocytic intraepidermal neoplasias. J Am Acad Dermatol 2007; 57: 824–831. https://doi.org/10.1016/j.jaad.2007.06.031
- Rossi A, Garelli V, Pranteda G, Cardone M, Anzalone A, Fortuna MC, et al. Dermoscopy and methyl aminolevulinate: A study for detection and evaluation of field cancerization. J Photochem Photobiol B 2016; 162: 72–76. https://doi.org/10.1016/j.jphotobiol.2016.06.028
- de Leeuw J, van der Beek N, Neugebauer WD, Bjerring P, Neumann HAM. Fluorescence detection and diagnosis of non-melanoma skin cancer at an early stage. Lasers Surg Med 2009; 41: 96–103. https://doi.org/10.1002/lsm.20739
- Tyrrell J, Campbell SM, Curnow A. Monitoring the accumulation and dissipation of the photosensitizer protoporphyrin IX during standard dermatological methyl-aminolevulinate photodynamic therapy utilizing non-invasive fluorescence imaging and quantification. Photodiagnosis Photodyn Ther 2011; 8: 30–38. https://doi.org/10.1016/j.pdpdt.2010.11.001
- Bobyr I, Campanati A, Giacchetti A, Offidani A. Fluorescent photodiagnostic evaluation of field cancerization treated with a medical device containing piroxicam 0.8% and sunscreen SPF 50+ for actinic keratosis. Photoderm Photoimm Photomed 2019; 35: 277–279. https://doi.org/10.1111/phpp.12452
- Tyrrell J, Campbell S, Curnow A. Validation of a non-invasive fluorescence imaging system to monitor dermatological PDT. Photodiagnosis Photodyn Ther 2010; 7: 86–97. https://doi.org/10.1016/j.pdpdt.2010.03.002
- Sorbellini E, Marzani B, Pinto D, Rinaldi F. Actinic keratosis prevention – A double-blind, half-face interventional study with a topical treatment. JST 2018; 9: 1. https://doi.org/10.5430/jst.v9n1p1
- Bartosińska J, Szczepanik-Kułak P, Raczkiewicz D, Niewiedzioł M, Gerkowicz A, Kowalczuk D, et al. Topical photodynamic therapy with different forms of 5-aminolevulinic acid in the treatment of actinic keratosis. Pharmaceutics 2022; 14: 346. https://doi.org/10.3390/pharmaceutics14020346
- Tyrrell J, Paterson C, Curnow A. Regression analysis of protoporphyrin IX measurements obtained during dermatological photodynamic therapy. Cancers 2019; 11: 72. https://doi.org/10.3390/cancers11010072
- Kim BK, Lee NR, Park SY, Eom M, Choi EH. Efficacy of photodynamic therapy with laser pretreatment for actinic keratosis and photorejuvenation as evaluated by fluorescent imaging. Photoderm Photoimm Photomed 2015; 31: 36–43. https://doi.org/10.1111/phpp.12140
- Korecka K, Polańska A, Dańczak-Pazdrowska A, Navarrete-Dechent C. Assessing field cancerization and actinic keratosis using ultraviolet-induced fluorescence dermatoscopy after the application of 5-aminolevulinic acid - an observational study. Photodiagnosis Photodyn Ther 2024; 46: 104056. https://doi.org/10.1016/j.pdpdt.2024.104056
- Jeffes EW, McCullough JL, Weinstein GD, Kaplan R, Glazer SD, Taylor JR. Photodynamic therapy of actinic keratoses with topical aminolevulinic acid hydrochloride and fluorescent blue light. J Am Acad Dermatol 2001; 45: 96–104. https://doi.org/10.1067/mjd.2001.114288
- Togsverd-Bo K, Haak CS, Thaysen-Petersen D, Wulf HC, Anderson RR, Hædersdal M. Intensified photodynamic therapy of actinic keratoses with fractional CO2 laser: a randomized clinical trial. Br J Dermatol 2012; 166: 1262–1269. https://doi.org/10.1111/j.1365-2133.2012.10893.x
- Ericson MB, Sandberg C, Stenquist B, Gudmundson F, Karlsson M, Ros AM, et al. Photodynamic therapy of actinic keratosis at varying fluence rates: assessment of photobleaching, pain and primary clinical outcome. Br J Dermatol 2004; 151: 1204–1212. https://doi.org/10.1111/j.1365-2133.2004.06211.x
- Li L, Li Y, Dong H, Yan J, Zhang Y, Zhang C, et al. Therapeutic and fluorescence evaluation of 20% 5-aminolevulinic acid-mediated photodynamic therapy in actinic keratosis. Photodiagnosis Photodyn Ther 2024; 47: 104100. https://doi.org/10.1016/j.pdpdt.2024.104100
- Willey A. Thermal photodynamic therapy for actinic keratoses on facial skin: a proof-of-concept study. Dermatol Surg 2019; 45: 404–410. https://doi.org/10.1097/DSS.0000000000001702
- Petersen B, Wiegell SR, Wulf HC. Light protection of the skin after photodynamic therapy reduces inflammation: an unblinded randomized controlled study. Br J Dermatol 2014; 171: 175–178. https://doi.org/10.1111/bjd.12882
- Tyrrell JS, Campbell SM, Curnow A. The relationship between protoporphyrin IX photobleaching during real-time dermatological methyl-aminolevulinate photodynamic therapy (MAL-PDT) and subsequent clinical outcome. Lasers Surg Med 2010; 42: 613–619. https://doi.org/10.1002/lsm.20943
- Regin Wiegell S, Hædersdal M, Christian Wulf H. Cold water and pauses in illumination reduces pain during photodynamic therapy: a randomized clinical study. Acta Derm Venereol 2009; 89: 145–149. https://doi.org/10.2340/00015555-0568
- Smits T, Robles CA, van Erp PEJ, van de Kerkhof PCM, Gerritsen MJP. Correlation between macroscopic fluorescence and protoporphyrin IX content in psoriasis and actinic keratosis following application of aminolevulinic acid. J Invest Dermatol 2005; 125: 833–839. https://doi.org/10.1111/j.0022-202X.2005.23843.x
- Wiegell SR, Petersen B, Wulf HC. Topical corticosteroid reduces inflammation without compromising the efficacy of photodynamic therapy for actinic keratoses: a randomized clinical trial. Br J Dermatol 2014; 171: 1487–1492. https://doi.org/10.1111/bjd.13284
- Buinauskaite E, Zalinkevicius R, Buinauskiene J, Valiukeviciene S. Pain during topical photodynamic therapy of actinic keratoses with 5‐aminolevulinic acid and red light source: randomized controlled trial. Photoderm Photoimm Photomed 2013; 29: 173–181. https://doi.org/10.1111/phpp.12044
- Fauteck JD, Ackermann G, Birkel M, Breuer M, Moor ACE, Ebeling A, et al. Fluorescence characteristics and pharmacokinetic properties of a novel self-adhesive 5-ALA patch for photodynamic therapy of actinic keratoses. Arch Dermatol Res 2008; 300: 53–60. https://doi.org/10.1007/s00403-007-0787-0
- Wiegell SR, Skiveren J, Philipsen PA, Wulf HC. Pain during photodynamic therapy is associated with protoporphyrin IX fluorescence and fluence rate. Br J Dermatol 2008; 158: 727–733. https://doi.org/10.1111/j.1365-2133.2008.08451.x
- Fernández-Guarino M, Mavura D, Fernández-González P, Chapa P, Ravazzano C, Jaén L, et al. Daylight photodynamic therapy is an option for the treatment of actinic keratosis in patients with xeroderma pigmentosum in Africa. Photodiagnosis Photodyn Ther 2020; 29: 101631. https://doi.org/10.1016/j.pdpdt.2019.101631
- Kulyk O, Ibbotson SH, Moseley H, Valentine RM, Samuel IDW. Development of a handheld fluorescence imaging device to investigate the characteristics of protoporphyrin IX fluorescence in healthy and diseased skin. Photodiagnosis Photodyn Ther 2015; 12: 630–639. https://doi.org/10.1016/j.pdpdt.2015.10.002
- Neittaanmäki-Perttu N, Grönroos M, Tani T, Pölönen I, Ranki A, Saksela O, et al. Detecting field cancerization using a hyperspectral imaging system. Lasers Surg Med 2013; 45: 410–417. https://doi.org/10.1002/lsm.22160
- Blake E, Allen J, Thorn C, Shore A, Curnow A. Effect of an oxygen pressure injection (OPI) device on the oxygen saturation of patients during dermatological methyl aminolevulinate photodynamic therapy. Lasers Med Sci 2013; 28: 997–1005. https://doi.org/10.1007/s10103-012-1188-y
- Puizina-Ivić N, Zorc H, Vanjaka-Rogosić L, Mirić L, Persin A. Fractionated illumination improves the outcome in the treatment of precancerous lesions with photodynamic therapy. Coll Antropol 2008; 32 Suppl 2: 67–73.
- Szeimies RM, Landthaler M. Photodynamic therapy and fluorescence diagnosis of skin cancers. Recent Results Cancer Res 2002; 160: 240–245. https://doi.org/10.1007/978-3-642-59410-6_28
- Sieroń A, Kawczyk-Krupka A, Cebula MAW, Szyguła M, Zieleżnik W, Gruk M, et al. Photodynamic therapy (PDT) using topically applied δ-aminolevulinic acid (ALA) for the treatment of malignant skin tumors. Photodiagnosis Photodyn Ther 2004; 1: 311–317. https://doi.org/10.1016/S1572-1000(04)00069-9