SHORT COMMUNICATION
How Does a Convolutional Neural Network Trained to Differentiate between Invasive Melanoma and Melanoma In situ Generalize when Assessing Dysplastic Naevi?
Martin GILLSTEDT1,2, Klara SEGERHOLM1, Ludwig MANNIUS1, John PAOLI1,2 and Sam POLESIE1,2
1Department of Dermatology and Venereology, Institute of Clinical Sciences, Sahlgrenska Academy, University of Gothenburg, Gröna stråket 16, SE-413 45 Gothenburg and 2Region Västra Götaland, Sahlgrenska University Hospital, Department of Dermatology and Venereology, Gothenburg, Sweden. *E-mail: sam.polesie@gu.se
Citation: Acta Derm Venereol 2023; 103: adv00891. DOI https://doi.org/10.2340/actadv.v103.4822.
Copyright: © Published by Medical Journals Sweden, on behalf of the Society for Publication of Acta Dermato-Venereologica. This is an Open Access article distributed under the terms of the Creative Commons Attribution 4.0 International License (https://creativecommons.org/licenses/by/4.0/)
Accepted: Feb 20, 2023; Published: Mar 14, 2023
Competing interests and funding: The authors have no conflicts of interest to declare.
INTRODUCTION
It is challenging to predict whether an atypical melanocytic lesion planned for surgical removal will end up being an invasive melanoma or melanoma in situ (MIS) (1–3). In previous investigations, we have explored the usefulness of convolutional neural networks (CNNs) in assessment of melanoma thickness. Based on dermoscopic images alone, these networks perform on par with dermatologists (3, 4). However, when only using clinical close-up images, the combined readers’ assessment outperformed the CNN (5). Importantly, all these investigations have been based on data sets consisting only of MIS and invasive melanomas. Nevertheless, in a real-life and preoperative setting, atypical melanocytic naevi (i.e. dysplastic naevi (DN)) is clearly an important differential diagnosis that frequently needs to be considered. While certain dermoscopic structures are associated with melanoma (6), many features observed in melanomas and DN are overlapping (7). Investigations of how CNNs trained and validated to assess melanoma thickness behave when they are used to interpret images of DN should increase our understanding of how these tools will integrate into clinical practice and will help us to prepare for the design of prospective clinical trials.
This study trained, validated, and tested a CNN based only on images depicting melanoma. The primary objective was to analyse how a CNN trained to differentiate between invasive melanoma and MIS behaved when it was deployed on a set of images including DN.
The secondary aim was to analyse if the level of dysplasia (i.e. low- or high-grade) had any impact on the CNN’s scores.
MATERIALS AND METHODS
The dermoscopic images representing melanomas and DN were excised in the time period 1 January 2016 to 31 December 2021. The images were obtained from the department of dermatology at Sahlgrenska University Hospital in Gothenburg, Sweden. During this time-period, different camera set-ups were used, although the majority of images were taken with an iPhone 8 Plus (Apple Inc., Cupertino, CA, USA) using a DermLite DL4 dermatoscope (3 Gen Inc., San Juan Capistrano, CA, USA). Images with suboptimal quality and lesions that could not be captured by a single image were excluded. Images depicting lesions that were previously biopsied were also excluded. Only 1 dermoscopic image per lesion was included. Lentigo maligna lesions were included in the group of MIS. Artefacts including skin markers and hair were allowed. All lesions had been histopathologically verified by the dermatopathologists at the pathology department at Sahlgrenska University Hospital. To comply with the most recent WHO update for classification of skin tumours from 2018 (8), all DN with moderate to mild dysplasia were merged into the group “low-grade” dysplasia. All DN with severe dysplasia were included in the “high-grade” dysplasia group. The original image resolution ranged from 1,200×1,600 to 4,416×3,312 pixels for the melanoma images and from 768×1,024 to 4,416×3,312 pixels for the DN images.
A de novo CNN model (a model with no pre-trained parameters) was used, with an architecture similar to our previous model (4). The network consisted of 6 convolutional layers (depths 16, 32, 64, 128, 128 and 128) with kernel sizes of 3×3 pixels and a single dense layer (size 128) (Appendices S1–S3). A rectified linear unit (ReLU) activation function was used in all layers except the final sigmoid output. Augmentation (transformations including random rotations, scaling and flips) was used in the training set (Appendix S1). This model achieved an optimal area under the receiver operating characteristic curve (AUC) for the validation set (0.77) after being trained during 41 epochs for 1 h and 41 min (Fig. S1).
The selected model was evaluated on the melanoma and the DN test sets. This evaluation was monitored by MG and SP, and both authors verified that only the selected model was evaluated on the 2 test sets.
Statistical analysis
All data were analysed using R version 3.5.3 (The R Foundation for Statistical Computing). Wilcoxon’s rank sum test was used to compare the sigmoid outputs for different types of lesions (i.e. DN, melanoma in situ, and invasive melanoma). Fisher’s exact test was used to compare proportions. All tests are 2-sided and p < 0.05 was considered as statistically significant.
RESULTS
The final dataset consisted of 1,837 images of melanoma and 1,313 images of DN. A similar proportion of females were included in the DN set (45%) compared with the melanoma set (46%) (p = 0.49). However, patients with melanoma were older (64.7 years, 95% confidence interval (95% CI) 64.0–65.4) compared with patients with DN (55.1 years, 95% CI 54.2–56.1) (p < 0.0001). The localization of the included lesions differed significantly between diagnoses (p < 0.0001) (Fig. 1). Lesions located in the head and neck area and on the extremities were more common among melanomas, whereas truncal lesions were more common among DN.
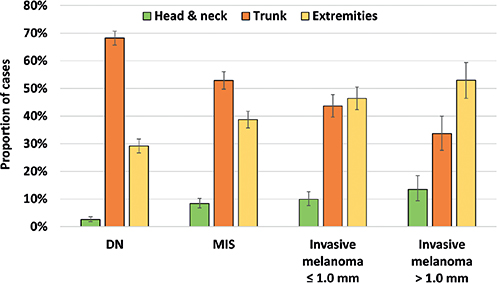
Fig. 1. Distribution of the body location of all included lesions. DN: dysplastic naevi; MIS: melanoma in situ.
All melanoma images (n = 1,837) were randomized into a training (n = 1,237), validation (n = 300) and test set (n = 300). The proportion of MIS (55%), invasive melanoma ≤ 1.0 mm (32%) and > 1.0 mm (13%) was preserved in each set. The AUC for correctly differentiating between invasive melanoma and MIS was 0.78 (95% CI 0.72–0.83) (Fig. 2).
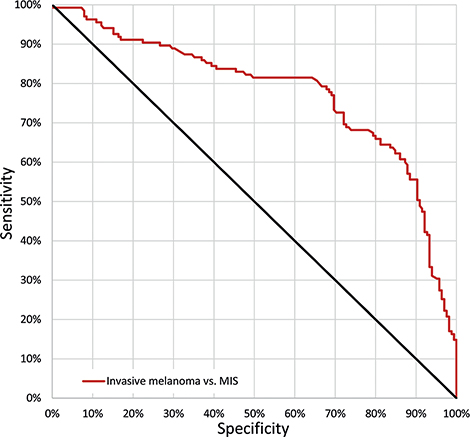
Fig. 2. Receiver operating characteristic (ROC) curve. ROC curve demonstrating the sensitivity and specificity for correctly classifying melanomas as invasive. The area under the curve (AUC) was 0.78 (95% confidence interval (95% CI) 0.72–0.83). The point on the curve where sensitivity and specificity are closest was: sensitivity 73% (95% CI 64–80%) and specificity 72% (95% CI 64–78%). MIS: melanoma in situ.
When this CNN was evaluated on the DN test set, these lesions received scores that aligned with MIS (AUC 0.53, 95% CI 0.48–0.58) (p = 0.18) and there was no significant difference in scores between DN with low- and high-grade dysplasia (AUC 0.52, 95% CI 0.48–0.55) (p = 0.39) (Fig. 3).
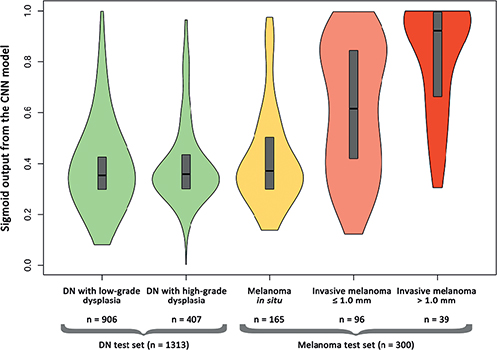
Fig. 3. Violin plot illustrating the distribution of the convolutional neural network (CNN’s) sigmoid outputs ranging from 0–1 for the respective test sets with the respective true labels on the x-axis. The boxes represent 1st and 3rd quartiles and median. Outputs (y-axis) closer to 0 are indicative of melanoma in situ and outputs closer to 1 are indicative of invasive melanoma. Overall, 1,613 lesions are included in the figure, consisting of the melanoma test set (melanoma in situ, invasive melanoma ≤ 1.0 mm and invasive melanoma > 1.0 mm), randomized from the 1,837 melanomas and the DN test set comprised of 1,313 lesions (low-grade and high-grade dysplasia). DN: dysplastic naevi.
DISCUSSION
This hypothesis-generating investigation provides in silico evidence that MIS and DN can be difficult to differentiate based on dermoscopic images alone and confirms the notion that clinical prediction of the grade of dysplasia is particularly challenging.
This study has some noteworthy limitations. Firstly, this was a retrospective and single-centre investigation performed in a population with mainly fair skin types ranging from I to III. Secondly, all included DN from Department of Dermatology and Venereology at Sahlgrenska University Hospital were excised and histopathologically verified, meaning that they generally had a more conspicuous appearance. Thirdly, while dermatopathologists evaluated all melanomas and DN, it is not ruled out that a consensus reporting might have yielded a somewhat different final diagnosis on some cases. Thirdly, this investigation was restricted to dermoscopic images alone, omitting important lesion metadata and clinical risk factors, including previous history of melanoma, hereditary factors, immunosuppressive therapy, and naevus count. Fourthly, the study has a somewhat unconventional design, which was aimed at specifically targeting lesions that were not represented among the training set images. The aim of the current study was not anomaly detection. Finally, the experiment was not repeated multiple times to investigate if the results were consistent. The principal reason for not doing so was that the melanoma test set was randomized (not including the DN test set, since it included all available DN images) before any training and evaluated only for the final model.
The aim of future research is to build a CNN model that also includes DN in the training set. Merging DN that have received a histopathological verification and MIS into a combined group would be appropriate, since this study suggests that this group could be treated visually as a single group. Future models should also be trained on more external datasets. A further aim is to conduct prospective trials to evaluate the usefulness of a CNN model in a clinical setting to provide more reliable preoperative prognostic information and to enable selection of the most appropriate excision margins.
REFERENCES
- Polesie S, Jergeus E, Gillstedt M, Ceder H, Dahlen Gyllencreutz J, Fougelberg J, et al. Can dermoscopy be used to predict if a melanoma is in situ or invasive? Dermatol Pract Concept 2021; 11: e2021079.
- Polesie S, Sundback L, Gillstedt M, Ceder H, Dahlen Gyllencreutz J, Fougelberg J, et al. Interobserver agreement on dermoscopic features and their associations with in situ and invasive cutaneous melanomas. Acta Derm Venereol 2021; 101: adv00570.
- Polesie S, Gillstedt M, Kittler H, Rinner C, Tschandl P, Paoli J. Assessment of melanoma thickness based on dermoscopy images: an open, web-based, international, diagnostic study. J Eur Acad Dermatol Venereol 2022; 36: 2002–2007.
- Gillstedt M, Hedlund E, Paoli J, Polesie S. Discrimination between invasive and in situ melanomas using a convolutional neural network. J Am Acad Dermatol 2022; 86: 647–649.
- Polesie S, Gillstedt M, Ahlgren G, Ceder H, Dahlen Gyllencreutz J, Fougelberg J, et al. Discrimination between invasive and in situ melanomas using clinical close-up images and a de novo convolutional eural network. Front Med (Lausanne) 2021; 8: 723914.
- Verzi AE, Quan VL, Walton KE, Martini MC, Marghoob AA, Garfield EM, et al. The diagnostic value and histologic correlate of distinct patterns of shiny white streaks for the diagnosis of melanoma: a retrospective, case-control study. J Am Acad Dermatol 2018; 78: 913–919.
- Hofmann-Wellenhof R, Blum A, Wolf IH, Piccolo D, Kerl H, Garbe C, et al. Dermoscopic classification of atypical melanocytic nevi (Clark nevi). Arch Dermatol 2001; 137: 1575–1580.
- Elder DE, Massi D, Scolyer RA, Willemze R. WHO classification of skin tumours: WHO classification of tumours, volume 11. Geneva: World Health Organization; 2018.