RESEARCH ARTICLE
Identification of Swedish caries active individuals aged 30–90 years using a life course perspective and SKaPa longitudinal national registry data over a 10-year period
Håkan Flinka,b , Anders Hedenbjörk-Lagerb, Simon Liljeströma, Eva Nohlerta and Åke Tegelberga,b
aCentre for Clinical Research Västerås, Uppsala University, Västerås, Sweden; bFaculty of Odontology, Malmö University, Malmö, Sweden
Abstract
Objective: To describe the occurrence of caries disease from a life course perspective using longitudinal data from the Swedish Quality Registry for Caries and Periodontal Disease (SKaPa).
Material and Methods: Data from seven age cohorts (ages 30–90 years), each followed over 10 years, were retrieved from the SKaPa. Using a three-trajectory model, individuals were divided into three trajectories according to their caries development over time: high (15%), moderate (45%), or low (40%). Caries experience was expressed as the mean decayed, missing, and filled surfaces (DMFS) index.
Results: Significant differences were found for all three trajectories and in all age groups over the 10 years. The mean DMFS index increase was significantly larger for the high trajectory group than for the moderate and low trajectory groups across all age cohorts. An increase in caries experience was observed for the older cohorts across all trajectories.
Conclusions: A three-trajectory model appears useful for identifying and quantifying caries experiences in longitudinal studies. Increased caries disease occurs over time, especially in the highest trajectory group and among older cohorts. These findings emphasise the need for greater attention and more efficient caries prevention methods.
KEYWORDS: Caries experience; caries prevention; disease progression; epidemiology; life course perspective
Citation: ACTA ODONTOLOGICA SCANDINAVICA 2024; VOL. 83: 412–418. DOI: https://doi.org/10.2340/aos.v83.40955.
Copyright: © 2024 The Author(s). Published by MJS Publishing on behalf of Acta Odontologica Scandinavica Society. This is an Open Access article distributed under the terms of the Creative Commons Attribution 4.0 International License (http://creativecommons.org/licenses/by/4.0/), allowing third parties to copy and redistribute the material in any medium or format and to remix, transform, and build upon the material, with the condition of proper attribution to the original work.
Received: 11 March 2024; Accepted: 4 June 2024; Published: 26 June 2024.
CONTACT: Håkan Flink hakan.flink@regionvastmanland.se Centrum för klinisk forskning, Region Västmanland/Uppsala universitet, Västmanlands sjukhus Västerås , 721 89 Västerås, Sweden
Competing interests and funding: The authors report that there are no competing interests to declare.
This work was supported by grants from the Council of Västmanland and Public Dental Care V�stmanland AB, 3006950-5305.
Introduction
The life course perspective is a way to approach the study of chronic disease causes and risks. Throughout the life course and especially during growth, critical periods are essential to the development of tissues and organs and may affect health later in life [1, 2]. Few published studies have focussed on the relations between caries disease and developmental life course factors among adults [3–5], and thus further longitudinal studies are needed to better explain these relationships. This is especially true for individuals with untreated dental caries, the most prevalent non-communicable disease worldwide, which may affect the permanent dentition [6, 7].
The most common method for describing caries experience is the decayed, missing, and filled surfaces (DMFS) index [8]. The prevalence of caries has decreased in many countries and increasing numbers of adults now have few or no caries lesions. Although this pattern is reflected in a decreased DMFS index [9–11], the portion of the population with recurring caries lesions is obscured by the skewed distribution [12, 13].
The longest birth cohort study of caries experience in adulthood was born in Dunedin, New Zeeland, in 1972 [14, 15]. The study population was assigned to one of three caries development trajectories reflecting population differences in caries occurrence [16, 17]. Using group-based trajectory analysis to investigate the natural history of dental caries experience from childhood to middle-age showed that 15% of the population had the highest caries experience, 45% had low or limited caries, and 40% had almost no caries.
The Swedish Quality Registry for Caries and Periodontal Disease (SKaPa) includes data from all adult age groups, offering a unique way to investigate the prevalence of recurring caries disease among adults in Sweden. This is valuable because many countries lack longitudinal caries data for adults.
The SKaPa became operational in 2008 and uses automatic data retrieval directly from electronic patient dental records [18]. The database contains dental care information (including caries and periodontitis) for 7.4 million individuals including longitudinal data spanning over 10 years [10] for much of Sweden’s total population (~ 10 million in 2019) [19].
The three-trajectory caries model described by Broadbent et al. in the Dunedin study [16, 17] was previously used to analyse two cohorts of SKaPa data (the 30- and 40-year-old groups) [20], with consistent findings regarding identifying individuals with the highest caries experience over time.
The remaining question is whether a similar pattern can be discerned in other age cohorts using the three-trajectory caries model. If a general pattern is confirmed in all age cohorts, the model could be used to correlate caries trajectories with other Swedish chronic disease registers (e.g. diabetes, asthma, rheumatic diseases), potentially improving our understanding of comorbidities. A similar approach may also be useful for identifying associations with hyposalivation-causing medication use, which may influence caries disease.
By including age cohorts, the SKaPa offers a unique opportunity to investigate the caries experience within the Swedish population. These longitudinal caries data also allow us to make distinctions between those who are caries-active or caries-inactive, and to compare these data in ways not possible with cross-sectional studies.
Few studies have focussed on ongoing caries progression and its effects on daily living in adult samples [21–23]. The few available studies shows that the common wish and goal among that group is halting caries progression [21, 22]. The trajectory model may provide a way to compare differences in experiences, efforts, wishes, and goals between caries trajectory groups. While gathering detailed information on the group with the highest caries experience have been challenging and difficult, this information is important for both professionals and patients, to better understand how to best prevent caries and stop its progression.
Big data like the SKaPa may be important tools for creating new codes for different treatment methods, providing opportunities to evaluate the effectiveness of preventive strategies over time [24]. This may be especially useful for high trajectory groups. This approach is also important when updating clinical practice guidelines, especially given the lack of randomised controlled trials and ethical problems with conducting such studies of caries disease [25].
Identifying individuals with the greatest caries experience may also better explain their treatment needs and facilitate development of more efficient preventive treatments, tailored to this patient group [26]. A thorough survey and investigation of high caries experience groups may also help to explain the underlying causes of caries disease and provide guidance for oral care planning and targeted preventive efforts.
Thus, the aim of this study was to describe the caries experience from a life course perspective, across seven age cohorts during a 10-year period using the three-trajectory caries model. Our hypothesis was: The same three-trajectory pattern [16, 17, 20] that identifies individuals with different caries experiences over time is reflected within each age cohort.
Materials and methods
Longitudinal caries data were retrieved from the SKaPa, and then classified into seven age cohorts. The study included registry data from 2019 including 273,962 individuals aged 30–90 years whose records contained caries data (Figure 1). Among these, 124,101 individuals did not have a dental examination in both 2010 and 2019. The final 149,861 individuals included in analyses were recall patients at 1,333 general practice dental clinics in Sweden, and they covered most of Sweden’s 23 regions. Study data for each age cohort were retrieved retrospectively, for 10 years (i.e. 2010–2019). The numbers of individuals in each age cohort are shown in Table 1.
| Age cohort, years* | 30 | 40 | 50 | 60 | 70 | 80 | 90 | Total |
| High (15%) | 6,237 | 3,299 | 4,012 | 3,756 | 3,124 | 1,697 | 452 | 22,577 |
| Moderate (45%) | 20,081 | 10,619 | 12,814 | 12,074 | 9,238 | 4,988 | 1,327 | 71,141 |
| Low (40%) | 17,172 | 8,763 | 10,124 | 9,035 | 6,768 | 3,429 | 852 | 56,143 |
| Total | 43,490 | 22,681 | 26,950 | 24,865 | 19,130 | 10,114 | 2,631 | 149,861 |
| * Age in 2019. | ||||||||
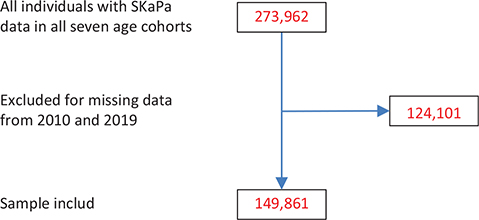
Figure 1. Flow chart of numbers of individuals of eligible (with SKaPa data), excluded (missing SKaPa data for 2010 and 2019), and included in analyses.
Primary outcome variable
The main variable of interest was the DMFS index, which is based on a range of 0–32 teeth, and a maximum of 148 tooth surfaces.
The model
The group-based trajectory modelling used in the Dunedin cohort [16], is a specialised application of finite mixture modelling. This approach simplifies analyses of longitudinal data by identifying developmental trajectory groups on a likelihood basis; this involves approaching a set of individual trajectories by grouping those that closely resemble one another using a probability function. Dealing with few trajectories is less complicated than analysing several hundred individual trajectories [16, 27]. In this study, a similar model was used just adapting the obtained proportions from the analysis of the Dunedin cohort [16]. A reason for this was to be able to compare and evaluate outcome from different populations in a better way.
The mean DMFS index values for each age cohort were assigned to three different trajectories during 2019: high (15% of sample), moderate (45% of sample), and low (40% of sample).
Analysis
The mean DMFS index value for each trajectory was calculated at the start (2010) and end (2019) of the study period, and used to quantify the caries experience over time. The mean increase in DMFS across the study period was the main variable used to quantify caries activity for each trajectory. Two additional variables of interest were the mean numbers of decayed teeth (DT) and decayed tooth surfaces (DS) during the study period. Caries development patterns were compared between the trajectories within each age cohort as well as across all age cohorts for the entire dataset.
The Swedish Ethical Review Authority approved the research project (Dnr 2022-01689-02).
Statistics
Descriptive statistics were used to describe caries development during the study period. Mean values were compared at the group level using the dependent-sample t- test. Because of the large sample sizes, we adopted a more conservative significance level thus p-values of less than or equal to .01 were considered significant.
To help in the interpretation of the results, we also calculated the effect size, which is a standardised measure of the strength of the relationship between, for example, two variables. When two variables are compared, it is appropriate to calculate Cohen’s d effect size [28], which is calculated by dividing the mean difference by the pooled standard deviation. To interpret the effect size d, the values suggested by Cohen were used: 0.2 = small effect, 0.5 = medium effect, and 0.8 = large effect.
Data were analysed using IBM SPSS Statistics version 28 for Windows (IBM Corporation; Armonk, NY, USA).
Results
A total of 149,861 individuals were included in the study. The proportions within the three caries trajectories (15%, 45%, and 40%) are shown in Table 1. Mean DMFS values at the start (2010) and end (2019) of the study period for the trajectory groups in each of the seven cohorts (age range: 30–90 years) and the total sample are shown in Table 2.
| High (15%) | Moderate (45%) | Low (40%) | Total | |
| Age cohort, years* | Mean ± SD | Mean ± SD | Mean ± SD | Mean ± SD |
| 30 | ||||
| DMFS 2010 | 21.9 ± 9.7 | 8.2 ± 5.4 | 1.5 ± 2.9 | 7.5 ± 8.6 |
| DMFS 2019 | 29.8 ± 11.0 | 10.5 ± 4.6 | 1.6 ± 1.4 | 9.8 ± 10.6 |
| 40 | ||||
| DMFS 2010 | 32.3 ± 13.2 | 14.3 ± 6.2 | 3.6 ± 3.2 | 12.8 ± 11.7 |
| DMFS 2019 | 43.5 ±16.1 | 17.7 ± 5.6 | 4.2 ± 2.9 | 16.1 ± 14.0 |
| 50 | ||||
| DMFS 2010 | 45.5 ± 15.7 | 23.8 ± 7.6 | 9.0 ± 4.7 | 21.6 ± 15.0 |
| DMFS 2019 | 57.4 ± 16.5 | 28.1 ± 6.7 | 10.5 ± 4.7 | 25.9 ± 17.6 |
| 60 | ||||
| DMFS 2010 | 68.6 ± 19.5 | 40.4 ± 10.2 | 19.1 ± 7.8 | 36.9 ± 20.1 |
| DMFS 2019 | 81.6 ± 17.4 | 46.4 ± 8.5 | 22.0 ± 7.5 | 42.9 ± 22.2 |
| 70 | ||||
| DMFS 2010 | 96.6 ± 22.4 | 65.3 ± 14.3 | 36.8 ± 13.4 | 60.4 ± 25.8 |
| DMFS 2019 | 111.3 ± 13.6 | 73.4 ± 10.2 | 41.5 ± 12.1 | 68.3 ± 26.4 |
| 80 | ||||
| DMFS 2010 | 115.6 ± 23.1 | 86.1 ± 17.0 | 53.0 ± 17.8 | 79.9 ± 28.6 |
| DMFS 2019 | 128.1 ± 8.5 | 94.2 ± 10.8 | 58.5 ± 15.1 | 87.8 ± 27.1 |
| 90 | ||||
| DMFS 2010 | 122.8 ± 22.4 | 96.9 ± 16.7 | 62.5 ± 19.5 | 90.2 ± 28.4 |
| DMFS 2019 | 134.0 ± 5.1 | 104.9 ± 10.5 | 68.0 ± 15.7 | 97.9 ± 26.0 |
| DMFS: decayed, missing, and filled tooth surfaces; SD: standard deviation. * Age in 2019. |
||||
The mean DMFS index increase during the 10-year study period was significant for all but one of the 21 trajectories across the age cohorts (Table 3). The DMFS index increase was significantly higher in the high trajectory group compared with the low and moderate trajectory groups within the same age cohort. Cohen’s d effect sizes were generally higher in the moderate and high trajectory groups compared with the low trajectory group, reflecting a larger increase in DMFS indexes in both of those groups. The effect sizes were medium to large according to Cohen’s guidelines for interpretation [28].
| High (15%) | Moderate (45%) | Low (40%) | Total | |||||
| Age cohort, years* | d ± sd | d | d ± sd | d | d ± sd | d | d ± sd | d |
| 30 | ||||||||
| 7.9 ± 10.6*** | 0.75 | 2.4 ± 4.2*** | 0.56 | 0.01 ± 2.7 n.s. | 0.01 | 2.2 ± 5.8*** | 0.39 | |
| 40 | ||||||||
| 9.4 ± 11.6*** | 0.81 | 3.5 ± 4.4*** | 0.79 | 0.8 ± 2.3*** | 0.34 | 3.3 ± 6.2*** | 0.53 | |
| 50 | ||||||||
| 10.9 ± 14.0*** | 0.78 | 4.3 ± 5.0*** | 0.85 | 1.5 ± 2.7*** | 0.55 | 4.2 ± 7.3*** | 0.58 | |
| 60 | ||||||||
| 13.0 ± 16.1*** | 0.81 | 6.0 ± 7.1*** | 0.85 | 2.9 ± 4.4*** | 0.67 | 5.9 ± 9.0*** | 0.66 | |
| 70 | ||||||||
| 14.6 ± 20.5*** | 0.71 | 8.1 ± 11.5*** | 0.70 | 4.7 ± 7.6*** | 0.62 | 7.9 ± 12.8*** | 0.62 | |
| 80 | ||||||||
| 12.5 ± 22.0*** | 0.57 | 8.1 ± 14.0*** | 0.58 | 5.4 ± 10.8*** | 0.50 | 7.9 ± 14.9*** | 0.53 | |
| 90 | ||||||||
| 11.2 ± 21.9*** | 0.51 | 7.9 ± 13.6*** | 0.58 | 5.5 ± 13.3*** | 0.42 | 7.7 ± 15.4*** | 0.50 | |
| *** p < 0.001. * Age in 2019. DMFS = decade, missing and filled tooth surfaces. d ± sd = difference between registrations year 2010 and 2019 including the standard deviation. d = Cohen’s effect size |
||||||||
The DMFS index increased steadily in the highest trajectory group for all age cohorts (Table 3 and Figure 2). A peak was observed for those in their 70s, after which it decreased for those in their 80s and 90s. In the moderate trajectory group, a larger DMFS index increase occurred for those in their 60s, 70s, and 80s. This increase was twice that of the moderate trajectory group in the younger age cohorts. A larger increase was also observed in the low trajectory group among those in their 70s, 80s, and 90s, although the increase was smaller compared with the other trajectories. Slightly different patterns of increase in the DMFS index were observed for the three trajectories: Cohen’s d effect sizes peaked for those in their 40s, 50s, and 60s in the high trajectory group, for those in their 50s and 60s in the moderate trajectory group, and for those in their 60s and 70s in the low trajectory group (Table 3).
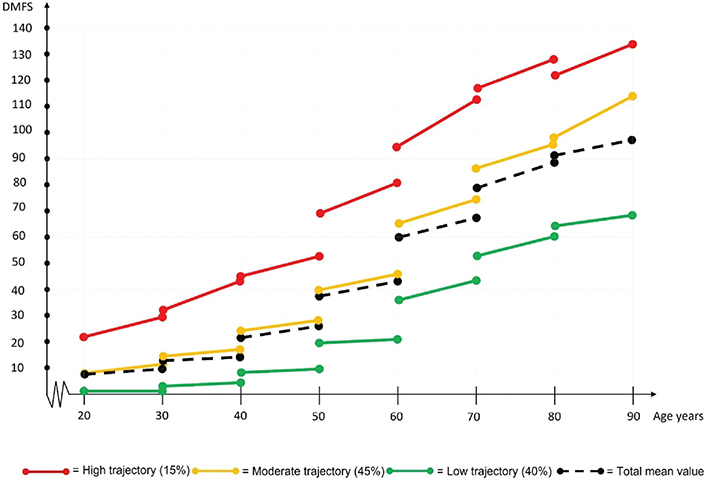
Figure 2. Progression of DMFS indexes for three different trajectories each age cohort during the study period (2010–2019).
DMFS: decayed, missing and filled tooth surfaces.
Changes in caries experience over time between age cohorts were also compared, (i.e. one age cohort during 2010 was compared with a younger age cohort when they were at the same age during 2019). For all compared cohorts, a general decrease in caries experience was seen between 2010 and 2019, except for the high trajectory group in the oldest age group (those in their 90s) (Table 3 and Figure 2). The largest mean decrease in caries experience was for those in their 60s. The DMFS index was 60.4 ± 25.8 for the 70-year age cohort (age 60 years in 2010) and 42.9 ± 22.2 for the 60-year age cohort (age 60 years in 2019). Annual development of DS and DT within the three caries trajectories across each of the seven cohorts during the study period, are shown in Table 4.
| Age cohort, years* | High (15%) | Moderate (45%) | Low (40%) | Total |
| 30 | ||||
| DS/year | 0.45 ± 0.10 | 0.15 ± 0.04 | 0.03 ± 0.01 | 0.21 ± 0.19 |
| DT/year | 0.38 ± 0.09 | 0.14 ± 0.04 | 0.03 ± 0.01 | 0.18 ± 0.16 |
| 40 | ||||
| DS/year | 0.39 ± 0.16 | 0.16 ± 0.06 | 0.05 ± 0.02 | 0.20 ± 0.17 |
| DT/year | 0.32 ± 0.12 | 0.14 ± 0.05 | 0.05 ± 0.02 | 0.17 ± 0.14 |
| 50 | ||||
| DS/year | 0.42 ± 0.08 | 0.17 ± 0.05 | 0.07 ± 0.02 | 0.22 ± 0.16 |
| DT/year | 0.33 ± 0.06 | 0.15 ± 0.04 | 0.06 ± 0.02 | 0.18 ± 0.12 |
| 60 | ||||
| DS/year | 0.34 ± 0.09 | 0.14 ± 0.04 | 0.07 ± 0.02 | 0.18 ± 0.13 |
| DT/year | 0.25 ± 0.06 | 0.12 ± 0.04 | 0.06 ± 0.02 | 0.14 ± 0.09 |
| 70 | ||||
| DS/year | 0.30 ± 0.10 | 0.16 ± 0.07 | 0.10 ± 0.05 | 0.19 ± 0.11 |
| DT/year | 0.22 ± 0.06 | 0.13 ± 0.05 | 0.08 ± 0.04 | 0.14 ± 0.08 |
| 80 | ||||
| DS/year | 0.27 ± 0.07 | 0.19 ± 0.09 | 0.13 ± 0.08 | 0.19 ± 0.10 |
| DT/year | 0.19 ± 0.04 | 0.15 ± 0.06 | 0.11 ± 0.07 | 0.15 ± 0.06 |
| 90 | ||||
| DS/year | 0.31 ± 0.05 | 0.26 ± 0.12 | 0.18 ± 0.13 | 0.25 ± 0.12 |
| DT/year | 0.20 ± 0.02 | 0.19 ± 0.08 | 0.15 ± 0.09 | 0.18 ± 0.07 |
| Values are expressed as mean ± SD. * Age in 2019. |
||||
Discussion
Although dental caries was observed across the 10-year study in all age cohorts, it was significantly more severe in the high trajectory group within each age cohort. In these data from ~149,000 adults aged 30–90 years, the group with the highest caries experience also demonstrated an increased caries burden with age compared with the moderate and low trajectory groups.
A previous study using the three-trajectory caries model with SKaPa data [20] found similarities to the Dunedin study [16, 17]. The aim of this study herein was to replicate that method to analyse data from seven adult age cohorts with a larger, nationwide SKaPa sample. These analyses showed similar results, with the model able to identify groups with the highest caries experience over time in all age cohorts.
A steady DMFS index progression was observed with increasing age, especially in the highest trajectory groups. This DMFS index increase peaked among those in their 70s, after which it levelled off when individuals were in their 80s and 90s. Empirical evidence to guide treatment of dental caries in older adults is scarce compared with that for the treatment of children and adults with coronal caries. The finding herein suggests that improved caries prevention for the highest trajectory group is needed across all age cohorts.
The SKaPa data have been well validated, have satisfactory reliability and accuracy regarding dental caries among children aged 6–12 years, and are considered a reliable source for registry-based research [29, 30].
The SKaPa includes most of the Swedish population (7.4 million of 10 million inhabitants), across a wide range of general dental clinics, including both public and private, which are located throughout Sweden. The sample analysed herein should thus offer very good generalisability of these findings to the broader Swedish populations.
Further on, the three-trajectory caries model used in this study could be useful to identify groups with the highest caries experience and compare populations in SKaPa on national as well as regional and local levels.
This study was not without limitations. Use of the three-trajectory caries model with similar trajectory proportions, based on the Dunedin study, may have been influenced by variations in caries prevalence in different subgroups. Further analyses will be needed to identify alternative trajectories.
When comparing DMFS index values, reasons for the ‘missing’ component vary, and may be difficult to ascertain. They may also be essential to understanding this complex system [31]. Herein, we could not determine reasons for ‘missing’ component, though the SKaPa has previously described causes across ages [10]. Until age 40, caries is the most common reason for extractions. After age 40, pulp conditions and fracture, along with caries, account for >50% of extractions. After age 50, periodontitis accounts for 30% of the missing component. The number of annual extractions increases by age from around 5% in the youngest adult group to around 15% among those in their 90s [10].
Changes in caries experience over time should be considered when comparing longitudinal caries data from different time periods. Herein, a general decrease in caries experience was seen between 2010 and 2019 and was most pronounced among those in their 60s. This decrease may reflect a general increase in use of fluoride products. In 2008, the need for a prescription to buy 0.2% sodium fluoride (NaF) solutions was removed in Sweden, and then the 2011 National Guidelines recommended 0.2% NaF solution use for adults at risk for caries or with early caries that may progress [32]. The number of dispatches of prescribed fluorides from pharmacies was 544,964 in 2010, which increased to 618,226 in 2019 (including 0.2% NaF rinsing solutions and toothpaste with 5,000 ppm fluoride). Though information about over-the-counter fluoride products is more difficult to obtain, data from one of the largest manufacturers reported that 260,000 litres of 0.2% NaF rinsing solutions were sold in 2010, which increased to 2,213,000 litres in 2019. The consequences of this increase on caries development are difficult to determine; however, they might be described by the Common-Sense Model concerning patients’ self-management of healthcare and a system for creating action plans and implementing actions [33]. Individuals are more likely to continue a treatment they perceive to be effective, like arresting caries progression after many years of caries experience.
DMFS indexes differed significantly among the three trajectory groups at start of the study period, even within the youngest age group (Figure 2). This indicates that caries disease begins in younger age [34–36] and then continues, possibly for all cohorts. However, this pattern needs further investigation, by including even younger cohorts.
When longitudinal caries data are unavailable, cross-sectional studies of different age groups can provide information about caries development over the life course. Spending on fee-for-service dental claims and medical spending on oral health care for patients aged 0–89 years have been analysed using very large cross-sectional data sets from the USA-based Medicare and Medicaid programmes [37]. In both systems, average spending among adults increased to a peak at age 65 years, followed by a decrease. Our data showing an increase in caries experience among older groups are consistent with these increases in spending on oral treatments. Recent global demographic and epidemiological changes, such as the increased proportion of older individuals with more remaining teeth, will likely increase the need for targeted treatments for older adults. Although when and how to intervene more effectively with older groups have been discussed, further research is needed. Significantly increased management of root caries through use of highly fluoridated toothpastes or varnishes as well as antimicrobial agents, have been described [38]. Other barriers include better oral health cost coverage, general and oral health comorbidities, patient misconceptions and fear, along with needs for dental health system education [39].
The trend toward increased tooth retention and caries risk factors within the ageing population suggest a possible upsurge in the total burden of caries disease for this demographic group. This will likely pose a challenge for policymakers in designing oral health systems [40]. Studies have described increasing medication prescription for older; this is an issue because many drugs cause hyposalivation as a common side effect, which may increase caries risk [41–45].
Difficulties with reimbursement for preventive oral health measures across healthcare systems have been discussed [46], though there is insufficient evidence to determine whether current preventive interventions improve oral health in those with caries [25, 47]. This may explain why neither Medicare nor Medicaid incentivises adult preventive care [37], and why annual SKaPa data show that caries preventive measure use increases parallel with increased prevalence of fillings, except in the oldest age groups, despite government subsidisation [10]. Older adults may even choose extraction before paying for prevention [48]. This context may also explain why caries experience progressed with age herein, and suggests that effective preventive strategies have not reached those at highest caries risk in Sweden.
In conclusion, the findings herein support our hypothesis that the same three-trajectory pattern identifying those with the greatest caries experience over time is reflected in all age cohorts. The three-trajectory model used here to identify caries experience also appears to be useful for longitudinal studies. Caries experience increased over time within all cohorts, and particularly within the highest trajectory groups within the older cohorts. These trends demand that greater attention be paid to these groups and call for more efficient caries prevention methods.
Acknowledgements
We thank the Swedish Quality Registry for Caries and Periodontal Disease (SKaPa) for providing registry data access. We are also grateful to Desirée Loikas, Ph.D., pharmacist at the Council of Västmanland, for information about nationally prescribed fluoride products. We also thank Sanna Hedman, Brand Manager Flux, and Karo Healthcare for providing 2010 and 2019 national sales statistics.
Availability of data and materials
Study data are available on request to the authors.
Authors’ contributions
The study was designed by HF, AH, EN, and ÅT.
SL, HF, and AH analysed and interpreted the patient data.
HF, ÅT, and AH were major contributors to the writing of the manuscript.
ÅT and EN revised the text.
All authors read and approved the final manuscript.
References
[1] Halfon N, Hochstein M. Life course health development: an integrated framework for developing health, policy, and research. Milbank Q. 2002;80(3):433–79. https://doi.org/10.1111/1468-0009.00019
[2] The implications for training of embracing – a life course approach to health 2000. Available from: https://apps.who.int/iris/bitstream/handle/10665/69400/WHO_NMH_HPS_00.2_eng.pdf
[3] Nicolau B, Thomson WM, Steele JG, Allison PJ. Life-course epidemiology: concepts and theoretical models and its relevance to chronic oral conditions. Community Dent Oral Epidemiol. 2007;35(4):241–9. https://doi.org/10.1111/j.1600-0528.2007.00332.x
[4] Crall JJ, Forrest CB. A life course health development perspective on oral health. In: Halfon N, Forrest CB, Lerner RM, et al., editors. Handbook of life course health development. Cham, Switzerland: Springer International Publishing; 2018. p. 299–320. https://doi.org/10.1007/978-3-319-47143-3_13
[5] Peres KG, Thomson WM, Chaffee BW, Peres MA, Birungi N, Do LG, et al. Oral health birth cohort studies: achievements, challenges, and potential. J Dent Res. 2020;99(12):1321–31. https://doi.org/10.1177/0022034520942208
[6] Marcenes W, Kassebaum NJ, Bernabé E, Flaxman A, Naghavi M, Lopez A, et al. Global burden of oral conditions in 1990–2010: a systematic analysis. J Dent Res. 2013;92(7):592–7. https://doi.org/10.1177/0022034513490168
[7] The challenge of oral disease: a call for global action. The oral health atlas, 16-17: FDI World Dental Federation; 2015. Available from: https://www.fdiworlddental.org/sites/default/files/2021-03/complete_oh_atlas-2_0.pdf
[8] Bodecker CF. The modified dental caries index. J Am Dental Assoc. 1939;26(9):1453–60. https://doi.org/10.14219/jada.archive.1939.0279
[9] Jordan RA, Krois J, Schiffner U, Micheelis W, Schwendicke F. Trends in caries experience in the permanent dentition in Germany 1997–2014, and projection to 2030: morbidity shifts in an aging society. Sci Rep. 2019;9(1):5534. https://doi.org/10.1038/s41598-019-41207-z
[10] Annual report – 2020 The Swedish quality registry for caries and periodontal disease (SKaPa), in Swedish 2021. Available from: http://www.skapareg.se/
[11] Rødseth SC, Høvik H, Schuller AA, Bjertness E, Skudutyte-Rysstad R. Dental caries in a Norwegian adult population, the HUNT4 oral health study; prevalence, distribution and 45-year trends. Acta Odontol Scand. 2022;80:202–10. https://doi.org/10.1080/00016357.2022.2117735
[12] Pitts NB, Grant J, Hinrichs-Krapels S, Mazevet ME, Boulding HF, Mayne C. Towards a cavity free future: how do we accelerate a policy shift towards increased resource allocation for caries prevention and control?. The Policy Institute at King’s 2017. 2017. Available from: https://www.kcl.ac.uk/policy-institute/assets/towards-a-cavity-free-future.pdf.
[13] Spencer AJ. Skewed distributions – new outcome measures. Commun Dent Oral Epidemiol. 1997;25(1):52–9. https://doi.org/10.1111/j.1600-0528.1997.tb00899.x
[14] Hong CL, Broadbent JM, Thomson WM, Poulton R. The Dunedin multidisciplinary health and development study: oral health findings and their implications. J R Soc N Z. 2020;50(1):35–46. https://doi.org/10.1080/03036758.2020.1716816
[15] The Dunedin multidisciplinary health and development study. Available from: https://dunedinstudy.otago.ac.nz/.
[16] Broadbent JM, Thomson WM, Poulton R. Trajectory patterns of dental caries experience in the permanent dentition to the fourth decade of life. J Dent Res. 2008;87(1):69–72. https://doi.org/10.1177/154405910808700112
[17] Broadbent JM, Foster Page LA, Thomson WM, Poulton R. Permanent dentition caries through the first half of life. Br Dent J. 2013;215(7):E12. https://doi.org/10.1038/sj.bdj.2013.991
[18] von Bültzingslöwen I, Östholm H, Gahnberg L, Ericson D, Wennström JL, Paulander J. Swedish quality registry for caries and periodontal diseases – a framework for quality development in dentistry. Int Dent J. 2019;69(5):361–8. https://doi.org/10.1111/idj.12481
[19] Befolkningsstatistik – SCB (in Swedish) – Population statistics – Statistics Sweden. Available from: https://www.scb.se/hitta-statistik/statistik-efter-amne/befolkning/befolkningens-sammansattning/befolkningsstatistik/
[20] Flink H, Hedenbjörk-Lager A, Liljeström S, Nohlert E, Tegelberg Å. Identification of caries-active individuals in longitudinal data a methodological study using a national registry. Acta Odontol Scand. 2023:1–6. https://doi.org/10.1080/00016357.2023.2265474
[21] Chiang HM, Tranaeus S, Sunnegårdh-Grönberg K. Caries as experienced by adult caries active patients: a qualitative study. Acta Odontol Scand. 2018;77(1):15–21. https://doi.org/10.1080/00016357.2018.1493218
[22] Flink H, Tegelberg A, Arnetz JE, Birkhed D. Patient-reported negative experiences related to caries and its treatment among Swedish adult patients. BMC Oral Health. 2017;17(1):95. https://doi.org/10.1186/s12903-017-0384-3
[23] Ruiz B, Broadbent JM, Thomson WM, Ramrakha S, Hong CL, Poulton R. Differential unmet needs and experience of restorative dental care in trajectories of dental caries experience: a birth cohort study. Caries Res. 2023;1: 524-35. https://doi.org/10.1159/000530378
[24] Frantsve-Hawley J, Abt E, Carrasco-Labra A, Dawson T, Michaels M, Pahlke S, et al. Strategies for developing evidence-based clinical practice guidelines to foster implementation into dental practice. J Am Dent Assoc. 2022;153(11):1041–52. https://doi.org/10.1016/j.adaj.2022.07.012
[25] Randall CL. Dissemination and implementation research for oral and craniofacial health: background, a review of literature and future directions. Community Dent Oral Epidemiol. 2023;51(1):119–32. https://doi.org/10.1111/cdoe.12841
[26] Pitts NB, Mayne C. Making cavities history: a global policy consensus for achieving a dental cavity-free future. JDR Clin Trans Res. 2021:264–67. https://doi.org/10.1177/23800844211020298
[27] Nagin DS. Group-based modeling of development. Cambridge, MA:: Harvard University Press; 2005.
[28] Cohen J. Statistical power analysis for the behavioral sciences. 2nd ed. New York: Routledge; 1988. https://doi.org/10.4324/9780203771587
[29] Mensah T, Tranæus S, Cederlund A, Naimi-Akbar A, Klingberg G. Swedish quality registry for caries and periodontal diseases (SKaPa): validation of data on dental caries in 6- and 12-year-old children. BMC Oral Health. 2021;21(1):373. https://doi.org/10.1186/s12903-021-01705-x
[30] Kirkinen T, Naimi-Akbar A, Cederlund A, Tranæus S, Carlson C, Klingberg G. Accuracy of the Swedish quality registry for caries and periodontal diseases (SKaPa) – evaluation in 6- and 12-year-olds in the region of Värmland, Sweden. Acta Odontol Scand. 2023;81(8):615–21. https://doi.org/10.1080/00016357.2023.2235422
[31] Broadbent JM, Thomson WM. For debate: problems with the DMF index pertinent to dental caries data analysis. Community Dent Oral Epidemiol. 2005;33(6):400–9. https://doi.org/10.1111/j.1600-0528.2005.00259.x
[32] National guidelines for adult dental care (Nationella riktlinjer för vuxentandvård): Socialstyrelsen (In Swedish); 2011. Available from: http://www.socialstyrelsen.se/nationalguidelines
[33] Leventhal H, Phillips LA, Burns E. The common-sense model of self-regulation (CSM): a dynamic framework for understanding illness self-management. J Behav Med. 2016;39(6):935–46. https://doi.org/10.1007/s10865-016-9782-2
[34] Alm A. On dental caries and caries-related factors in children and teenagers. Swed Dent J Suppl. 2008 (195):7–63.
[35] Isaksson H, Alm A, Koch G, Birkhed D, Wendt LK. Caries prevalence in Swedish 20-year-olds in relation to their previous caries experience. Caries Res. 2013;47(3):234–42. https://doi.org/10.1159/000346131
[36] Hall-Scullin E, Whitehead H, Milsom K, Tickle M, Su TL, Walsh T. Longitudinal study of caries development from childhood to adolescence. J Dent Res. 2017;96(7):762–7. https://doi.org/10.1177/0022034517696457
[37] Tranby EP, Frantsve-Hawley J, Minter-Jordan M, Thommes J, Jacob M, Monopoli M, et al. A cross-sectional analysis of oral health care spending over the life span in commercial- and Medicaid-insured populations. J Am Dent Assoc. 2022;153(2):101–9. https://doi.org/10.1016/j.adaj.2021.07.028
[38] Paris S, Banerjee A, Bottenberg P, Breschi L, Campus G, Domejean S, et al. How to intervene in the caries process in older adults: a joint ORCA and EFCD expert Delphi consensus statement. Caries Res. 2020;54(5–6):1–7. https://doi.org/10.1159/000510843
[39] de Sam Lazaro SL, Nitschke Durben AM, Kline JJ. Barriers and opportunities to support the oral health of older adults: a rapid review of health policy and systems. Int J Aging Hum Dev. 2023;96(1):51–62. https://doi.org/10.1177/00914150221106098
[40] Tonetti MS, Bottenberg P, Conrads G, Eickholz P, Heasman P, Huysmans M-C, et al. Dental caries and periodontal diseases in the ageing population: call to action to protect and enhance oral health and well-being as an essential component of healthy ageing – consensus report of group 4 of the joint EFP/ORCA workshop on the boundaries between caries and periodontal diseases. J Clin Periodontol. 2017;44(S18):S135–44. https://doi.org/10.1111/jcpe.12681
[41] Flink H, Bergdahl M, Tegelberg Å, Rosenblad A, Lagerlöf F. Prevalence of hyposalivation in relation to general health, body mass index and remaining teeth in different age groups of adults. Community Dent Oral Epidemiol. 2008;36(6):523–31. https://doi.org/10.1111/j.1600-0528.2008.00432.x
[42] Johansson AK, Johansson A, Unell L, Ekback G, Ordell S, Carlsson GE. Self-reported dry mouth in Swedish population samples aged 50, 65 and 75 years. Gerodontology. 2012;29(2):107–15. https://doi.org/10.1111/j.1741-2358.2010.00420.x
[43] Tan ECK, Lexomboon D, Sandborgh-Englund G, Haasum Y, Johnell K. Medications that cause dry mouth as an adverse effect in older people: a systematic review and metaanalysis. J Am Geriatr Soc. 2018;66(1):76–84. https://doi.org//10.1111/jgs.15151
[44] Aliko A, Wolff A, Dawes C, Aframian D, Proctor G, Ekstrom J, et al. World workshop on oral medicine VI: clinical implications of medication-induced salivary gland dysfunction [Review]. Oral Surg Oral Med Oral Pathol Oral Radiol. 2015;120(2):185–206. https://doi.org/10.1016/j.oooo.2014.10.027
[45] Agostini BA, Cericato GO, Silveira ERD, Nascimento GG, Costa FDS, Thomson WM, et al. How common is dry mouth? systematic review and meta regression analysis of prevalence estimates [Meta-Analysis Systematic Review]. Braz Dent J. 2018;29(6):606–18. https://doi.org/10.1590/0103-6440201802302
[46] Listl S. Dental remuneration systems – can we pay for prevention? Br Dent J. 2024;236(2):108. https://doi.org/10.1038/s41415-024-6763-7
[47] Force UPST. Screening and preventive interventions for oral health in adults: US preventive services task force recommendation statement. JAMA. 2023;330(18):1773–9. https://doi.org/10.1001/jama.2023.21409
[48] Mittal R, Loke WM, Seng DOL, Na TM, Yan GLK, Allen PF. Willingness to pay for preventive dental care amongst older adults. Int Dent J. 2022;72(4):499–505. https://doi.org/10.1016/j.identj.2021.11.002