ORIGINAL ARTICLE
Image quality assessment of photon-counting CT for patients with prostate cancer receiving radiotherapy
Cecilie Valet Henneberga,b  , Weronika Elżbieta Olechc, Louis Mathias Dreyer Tellera,d , Gitte Fredberg Perssona,d , Michael Brun Andersenc,d , Felix Christoph Müllerc , Claus Preibisch Behrensa,b , Henriette Klitgaard Mortensena, Vicki Trier Taastie , Stine Elleberg Petersene , Henriette Lindberga , Vibeke Løgagerc and Jens Morgenthaler Edmunda
aDepartment of Oncology, Copenhagen University Hospital – Herlev and Gentofte, Herlev, Denmark; bDepartment of Health Technology, Technical University of Denmark, Kgs. Lyngby, Denmark; cDepartment of Radiology, Copenhagen University Hospital – Herlev and Gentofte, Herlev, Denmark; dDepartment of Clinical Medicine, University of Copenhagen, Copenhagen, Denmark; eDanish Centre for Particle Therapy, Aarhus University Hospital, Aarhus, Denmark
ABSTRACT
Background and purpose: Photon-counting computed tomography (PCCT) offers enhanced image quality, including improvements in contrast, spatial resolution, and noise reduction. In radiotherapy (RT), optimal image quality is critical for accurate tumor and organ-at-risk delineation. However, reconstruction parameter selection often relies on subjective assessment. This study investigates whether quantitative image quality metrics, particularly contrast-to-noise ratio (CNR), can systematically guide PCCT reconstruction parameter optimization for prostate cancer RT planning.
Material and methods: An anthropomorphic abdomen phantom (QRM, Möhrendorf, Germany) and five patients with prostate cancer undergoing RT were scanned on a Naeotom Alpha PCCT (Siemens Healthineers, Forchheim, Germany). Reconstructions were performed across a range of kernel types, sharpness levels, and virtual monoenergetic image (VMI) energies, with the CNR calculated for each reconstruction. Additionally, a multidisciplinary expert panel qualitatively assessed a subset of reconstructions for two patients to compare with the quantitative findings.
Results: Softer kernels, particularly Br36 and Qr36, combined with lower VMI energies of 40 keV, consistently produced the highest CNR values in both phantom and patient datasets. The qualitative assessment generally supported the quantitative results, with minor deviations likely reflecting the experts’ preference for a more familiar image appearance.
Interpretation: Quantitative metrics such as CNR can reliably identify optimal PCCT reconstruction settings for prostate cancer RT, favoring lower VMI energies and softer reconstruction kernels. These findings were consistent across phantom and patient data and were supported by expert evaluations, indicating that a quantitative approach can effectively guide protocol development and reduce reliance on subjective image assessment.
KEYWORDS: tomography; X-ray computed; radiotherapy; image-guided; prostatic neoplasms; image enhancement; phantoms; imaging; radiotherapy; contrast media
Citation: ACTA ONCOLOGICA 2025, VOL. 64, 1176–1184. https://doi.org/10.2340/1651-226X.2025.43988.
Copyright: © 2025 The Author(s). Published by MJS Publishing on behalf of Acta Oncologica. This is an Open Access article distributed under the terms of the Creative Commons Attribution 4.0 International License (http://creativecommons.org/licenses/by/4.0/).
Received: 28 May 2025; Accepted: 20 August 2025; Published: 4 September 2025
CONTACT: Cecilie Valet Henneberg cecilie.valet.henneberg@regionh.dk Department of Oncology, Copenhagen University Hospital – Herlev and Gentofte, Borgmester Ib Juuls Vej 7, 2730 Herlev, Denmark
Supplemental data for this article can be accessed online at https://doi.org/10.2340/1651-226X.2025.43988
Competing interests and funding: This work was supported by a research grant from Varian. GF Persson reports receiving research grants from Varian. MB Andersen reports receiving honoraria for lectures from Siemens Healthineers and Philips Healthcare. The authors report no other conflicts of interest.
Introduction
Spectral computed tomography (CT), based on photon-counting computed tomography (PCCT), offers potential benefits in clinical image quality compared to conventional single-energy computed tomography (SECT) and includes improvements in contrast, spatial resolution, and noise reduction [1–3]. These advancements could potentially improve the delineation accuracy of tumors and organs-at-risk (OARs) in radiotherapy (RT), which directly impacts the treatment quality. However, to fully benefit from these advancements, it is critical to identify the optimal reconstruction parameters for PCCT.
In addition to adjustable reconstruction kernel type and sharpness, which are also available in SECT, PCCT can generate a range of post-processed spectral images, such as virtual monoenergetic images (VMIs) and iodine maps (which can quantify blood perfusion [4]) from a single scan. Both the reconstruction kernel and VMI energy can affect the image quality, where kernels with lower sharpness (i.e. ‘softer’ kernels) reduce noise at the expense of fine detail, while low VMI energies enhance image contrast but increase noise [5]. This flexibility allows reconstruction parameters to be tailored to specific clinical needs, making their optimization an important factor for PCCT-based RT planning.
Several studies have investigated PCCT reconstruction parameters, showing that the choice of kernel sharpness and VMI energy strongly influences image quality and diagnostic accuracy [6]. Sharper kernels improve spatial resolution and are therefore preferred for tasks requiring high detail, such as those benefiting from improved vessel sharpness [7]. In contrast, softer kernels reduce image noise and enhance contrast, which benefits tasks that rely on tissue differentiation, such as detecting hepatocellular carcinoma [8–10]. Low-keV VMIs increase contrast-to-noise ratio (CNR) and signal-to-noise ratio (SNR), which is advantageous in detecting lesions such as pulmonary embolism and hepatocellular carcinoma, with optimal energies generally between 40 and 70 keV depending on the clinical context [11–15]. Higher-keV VMIs (around 100–130 keV) effectively reduce metal artifacts and enhance diagnostic confidence in patients with metallic implants [16–20]. Additionally, specific VMI energy levels have been identified to optimize quantitative imaging markers, such as 45 keV for extracellular volume calculations and 60–70 keV for gliotic lesion contrast [21, 22]. These findings underscore the importance of carefully selecting kernel and VMI parameters tailored to the clinical application to maximize image quality and diagnostic performance.
Currently, the selection of preferred PCCT reconstruction parameters relies heavily on subjective visual assessments by clinicians, which can be time-consuming and prone to bias [23]. Furthermore, the preferred reconstruction parameters vary depending on the clinical application and the anatomical region. VMIs can be generated at any energy between 40 and 190 keV, providing a continuous range of reconstruction settings. Even when restricting the selection to 5 keV increments and combining these with the 50+ currently available kernels, this still yields 1,500+ unique parameter sets. Given the large number of parameter combinations, it is only practically feasible to evaluate a small subset qualitatively. As a result, reconstruction settings are often selected without thorough optimization, which could potentially compromise the treatment quality. Therefore, a systematic quantitative approach may represent an alternative, as it would be able to identify advantageous combinations by searching the full parameter space.
Quantitative image quality metrics offer a more objective and efficient selection of optimal reconstruction parameters from the entire parameter space. Accurate delineation of tumors and OARs depends heavily on image characteristics such as tissue contrast, which improves the visibility of anatomical boundaries, and image noise, which can lead to inconsistent delineation. Image quality metrics, such as CNR, are particularly attractive, as they combine aspects of both contrast and noise into a single value. Although such quantitative metrics are increasingly used in conjunction with qualitative assessments in diagnostic radiology [6, 24–26], conclusions still tend to rely heavily on subjective evaluation. Moreover, the use of these metrics remains inconsistent, and the literature is sparse within the field of RT. To provide an objective yet practical approach for optimizing reconstruction settings, only a few simple, clinically relevant metrics were selected.
This study investigates whether quantitative image quality metrics of PCCT scans can be used to optimize clinically relevant reconstruction settings with the aim of improving future RT delineation for patients with prostate cancer. The aim is to present a systematic, metric-based framework for evaluating PCCT image quality that can replicate or potentially replace subjective visual assessments. To support the study, phantom scans spanning the entire reconstruction parameter space, RT-dedicated PCCT scans of patients with prostate cancer, and qualitative image scoring by a multidisciplinary group of clinicians were included.
Material and methods
Scan protocol
The same CT protocol was used for both the phantom and patient scans. All PCCT scans were performed on a NAEOTOM Alpha PCCT (Siemens Healthineers, Forchheim, Germany) at 140 kVp, with a slice thickness of 0.4 mm, an increment of 0.2 mm, and an in-plane resolution for the patients ranging from 0.85 mm × 0.85 mm to 0.98 mm × 0.98 mm, depending on the necessary field-of-view. These were the lowest settings that allowed the scan to include all relevant OARs and the body outline, which are essential for treatment planning. For the phantom, a pixel size of 0.61 mm × 0.61 mm was used. The Computed Tomography Dose Index (CTDI) for the phantom scan was similar to that of a standard SECT scan in the RT department, with a CTDIvol,32cm of 10.2 mGy. Similarly, the CTDI for all patients was also comparable to their standard SECT equivalent scan, with a CTDIvol,32cm ranging from 6.8 mGy to 19.5 mGy and a maximal deviation of 3 mGy from the standard scan (Supplementary Material Table S1). Quantitative Iterative Reconstruction (QIR) was applied at level 3, which is the standard in our clinic.
All patients underwent contrast-enhanced (CE) scans, with iodine contrast administered using a weight-based dose of 450 mg iodine per kg body weight and an injection time of 30 seconds. Bolus tracking was performed in the descending aorta at the level of L3, with a CT number threshold of 120 HU. Patient scans were performed in the treatment position on a flat tabletop.
The image sets were made directly at the scanner console using ‘syngo CT VB10A’ (Siemens Healthineers, Forchheim, Germany). A total of 140 images, evenly distributed in parameter space, were generated for the phantom by combining five reconstruction kernel types (Qr, Br, Bv, Hr, and Hv), four kernel sharpness levels (36, 48, 60, and 72), and seven VMI energies (50 keV, 70 keV, 90 keV, 110 keV, 130 keV, 150 keV, and 170 keV). All images were retrospectively rebinned to a slice thickness of 2.0 mm, consistent with the clinical SECT protocol used for delineation.
Based on the results from the phantom study, a narrower set of VMIs and reconstruction kernels, covering a smaller range of parameter space but with finer sampling, was selected for the patient scans. This included two reconstruction kernel types (Qr and Br), four kernel sharpness levels (36, 40, 44, and 48), and four VMI energies (40 keV, 50 keV, 60 keV, and 70 keV), resulting in 32 images per patient. A corresponding image set was also made for the phantom for comparison.
Phantom and patients
An anthropomorphic abdomen phantom (QRM, Möhrendorf, Germany) consisting of solid water, soft tissue, liver, spleen, spine (spongiosa and corticalis), and four iodine inserts (2 mg/cm³, 5 mg/cm³, 10 mg/cm³, and 15 mg/cm³) was scanned on the PCCT scanner using the protocol described above. This phantom was selected because it contains materials and iodine concentrations that simulate the range of soft tissue contrasts typically encountered in CE patient scans, making it suitable for evaluating reconstruction settings under realistic conditions. Circular regions-of-interest (ROIs) were manually placed in the 2 mg/cm³ iodine insert (ROI1) and solid water background (ROI2) (Figure 1a), as these areas were expected to reflect typical CT numbers in CE patient scans. Each ROI was placed in a single slice and contained 109 pixels, corresponding to a volume of 81.7 mm3.
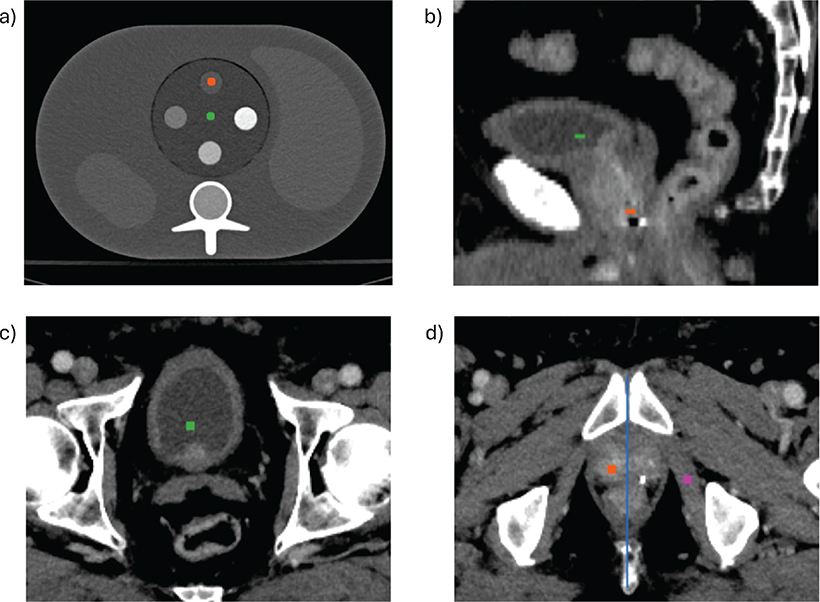
Figure 1. Illustration of the ROI and intensity profile placement, visualized on the 70 keV VMI with the Qr36 reconstruction kernel for patient 4. (a) Phantom with ROI1 in the 2 mg/cm³ iodine insert (orange) and ROI2 in the surrounding solid water (green). (b) Sagittal patient image with ROI1 in the prostate (orange) and ROI2 in the bladder (green). (c) Axial view of the patient scan showing ROI2 in the bladder (green). (d) Axial view showing ROI1 in the prostate (orange), ROI3 in the muscle (magenta), and the location of the prostate-rectum intensity profile (blue). ROI: regions-of-interest; VMI: virtual monoenergetic image.
To translate the phantom-based findings into a clinical context, five patients with prostate cancer (Table 1) scheduled for RT were included in this prospective observational study (ethics approval H-23035686), and a written informed consent was obtained. All patients underwent a CE-PCCT scan in addition to their standard clinical CT scan prior to the first treatment fraction.
Circular ROIs were manually placed in the prostate (ROI1), bladder (ROI2), and obturator internus muscle (ROI3) using consistent anatomical landmarks such as implanted gold seeds (Figure 1b–d). Special care was taken to avoid calcifications in the prostate and artifacts caused by the gold seeds, as artifact minimization was not the focus of this study, and metal artifact reduction (MAR) was not applied. The choice of the bladder as the second ROI was based on the clinical importance of the prostate-bladder border for accurate prostate delineation. A ROI size of 25 pixels was used for the patient scans, corresponding to a volume between 35.8 mm3 and 48.4 mm3.
Quantitative image assessment
The quantitative evaluation included measurements of the CNR, calculated using Equation (1).

Here, ΔS is the contrast, where Sn represents the mean CT number of ROIn. The noise (σ) was estimated using the standard deviation in ROI2 for the phantom and ROI3 for the patients. For the patients, the noise in the muscle was used, as the CT number variation in the prostate is likely due to heterogeneous tissue rather than image noise, and a CT number variation is also expected in the bladder due to uneven distribution of the injected iodine contrast.
Accurate delineation for prostate RT depends not only on tissue contrast but also on the spatial separation of adjacent anatomical structures, such as the prostate and rectum. To assess this, intensity profiles across the prostate-rectum interface (Figure 1b) were analyzed to evaluate how spatial gradients varied across reconstruction settings. This was further quantified by calculating the peak-to-valley difference divided by the noise (PVNR) using Equation (2).

In this equation, Smax is defined as the highest CT number along the intensity profile in the rectum, Smin as the lowest CT number along the intensity profile in the interface region between the rectum and prostate, and σ as the standard deviation of ROI3 in the muscle.
Qualitative image assessment
A qualitative assessment was conducted for two patients using all 32 generated images, with varying VMIs and reconstruction kernels, for each patient. A blinded, multidisciplinary expert panel (5–7 experts in total), consisting of radiation oncologists (two specialized in prostate cancer, one specialized in lung cancer, and one trainee), one radiologist (specialized in prostate cancer), and radiographers (one diagnostic, specialized in PCCT, and one RT technologist) from different institutions assessed the clinical image quality of different kernel/VMI combinations through individual voting. For each of the four VMIs, the panel reviewed all eight reconstruction kernels in a randomized order and individually selected their preferred image. The kernel receiving a majority vote was then shown for all four VMIs, again in a randomized order, and the experts were asked to individually choose their preferred VMI. The panel’s preferred kernel and VMI were identified through this process for both patients and subsequently compared with the quantitative results.
Results
Phantom results
The 140 phantom images, which were evenly spread throughout the entire parameter space, showed a consistent trend, with softer kernels combined with lower VMI energies resulting in higher CNR values (Figure 2a). The softest kernels, Br36 and Qr36, and the lowest evaluated VMI energy of 50 keV yielded the highest CNR (Supplementary Material Figure S1a–b).
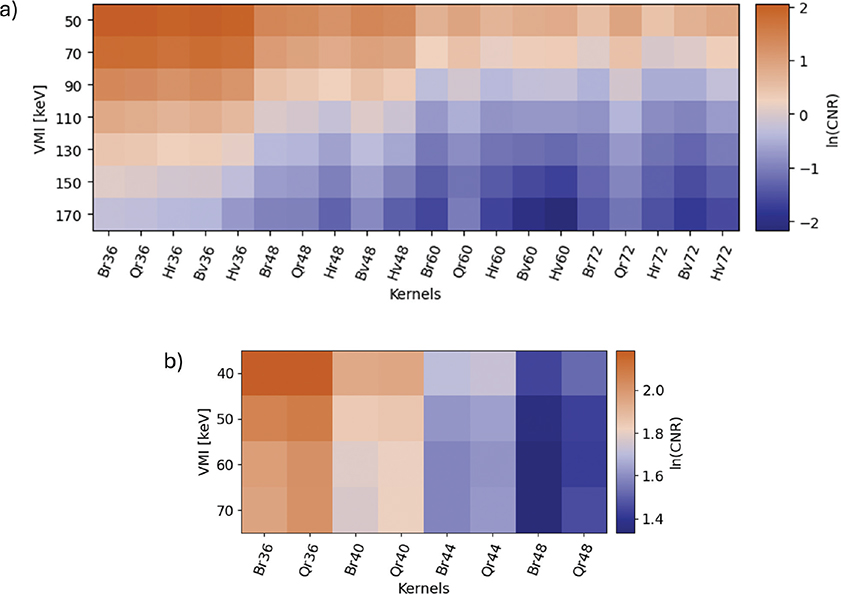
Figure 2. Phantom and patient CNR results for various reconstruction kernels and VMI energies, shown on logarithmic scales. (a) Phantom CNR between the iodine and solid water ROIs for all evaluated combinations of VMI energies and reconstruction kernels from the broad parameter search. (b) Patient CNR between the prostate and bladder ROIs, averaged across all five patients, based on the subsequent narrower parameter search. Individual patient results for the VMI at 40 keV with the Br36 reconstruction kernel are shown in Supplementary Figure S1. CNR: contrast-to-noise ratio; VMI: virtual monoenergetic image; ROI: regions-of-interest.
When looking separately at the contrast (ΔS) and noise (σ) contributions to the CNR, the contrast remained constant over the kernels and increased with decreasing VMI energy (Supplementary Material Figure S2a–b), while the noise varied with both the kernel and the VMI energy (Supplementary Material Figure S2c–d). The lowest noise levels were observed in softer kernels and higher VMI energies.
Patient results
In agreement with the phantom results, the highest CNR values across all patients were found for the softest kernels, Br36 and Qr36 (Figure 2b, columns 1 and 2), and the lowest VMI energy of 40 keV (Figure 2b, row 1). The same trend was observed for the patients individually (Supplementary Material Figure S1c–d). When looking at the contrast and the noise individually, the parameters follow the same pattern as for the phantom, with contrast increasing at lower VMI energies and noise decreasing with softer kernels and higher VMI energies (Supplementary Material Figure S3). There was a substantial variation in the body weight of the five patients, with patients 1 and 3 being considerably heavier than the other three (Table 1). However, as seen in the individual patient results (Supplementary Material Figures S1c–d and S3), this did not have any clear effect on the outcomes.
Comparing the CNR values from the phantom with the mean CNR values for the five patients for identical parameter settings, the observed trends were broadly consistent (Figure 3). Although smaller differences in the CNR magnitude were noted, the phantom results reliably reflected the relative performance observed in the patient scans.
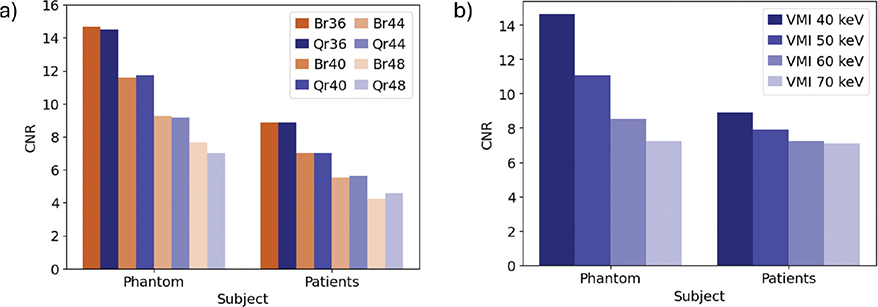
Figure 3. Comparison of phantom CNR values with patient CNR values averaged across the five patients. (a) The evaluated reconstruction kernels at the 40 keV VMI. (b) The evaluated VMI energies using the Br36 kernel. Results for the individual patients are provided in Supplementary Figure S1 for reference. CNR: contrast-to-noise ratio; VMI: virtual monoenergetic image.
The intensity profiles across the prostate-rectum border showed results similar to those of the CNR. The lowest VMI energy at 40 keV showed the clearest difference between the border itself and the tissue on each side, while changes in the reconstruction kernels only seemed to have a limited effect on the shape of the intensity profile (Figure 4a–b). However, based on the PVNR values, there was a clear preference for lower VMI energies and softer kernels, in agreement with the CNR results (Figure 4c).
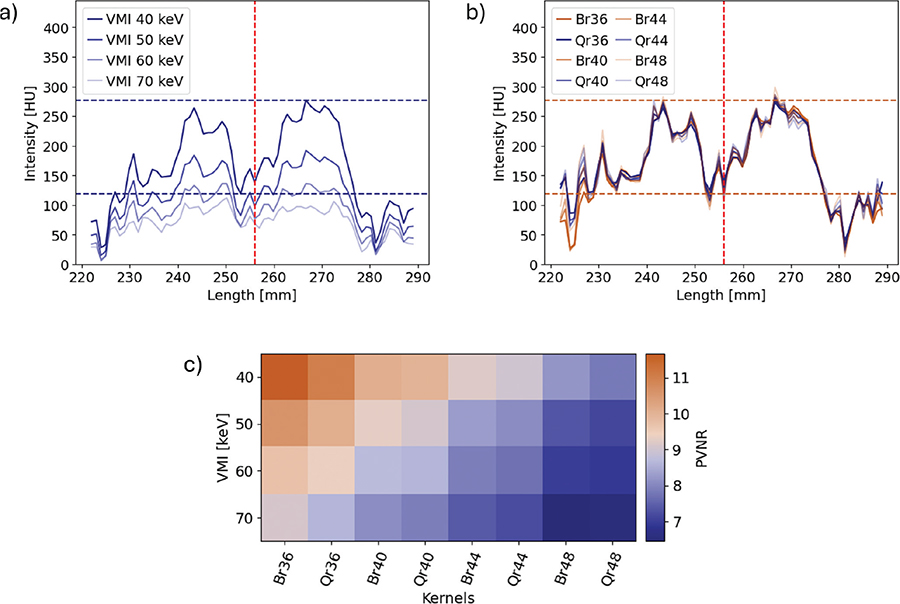
Figure 4. Intensity profiles across the prostate-rectum border in patient 4, directly above the most caudally positioned gold seed. (a) Intensity profiles for the evaluated VMI energies using the Br36 kernel. (b) Intensity profiles for the evaluated reconstruction kernels at 40 keV VMI. In both plots, the vertical line marks the approximate position of the prostate-rectum border. The horizontal lines indicate the peak and valley values for 40 keV in a and Br36 in b. (c) Peak-to-valley difference divided by the noise (PVNR) across all VMI and kernel combinations, where the noise was defined as the standard deviation within the muscle ROI. VMI: virtual monoenergetic image; ROI: regions-of-interest.
Across the images assessed by the expert panel, higher CNR values were generally associated with a larger proportion of expert panel votes (Figure 5). Although some variation in VMI energy preference was observed, the overall trend supported the use of lower VMI energies and softer kernels, which is consistent with the objective image quality metrics. The improvement in CNR between the 70 keV VMI image with the Qr40 kernel, which closely resembles the standard 120 kVp SECT scan routinely used in clinical delineation [27], and the 40 keV VMI image with the Br36 kernel, which were the preferred parameters, is also clearly visible when comparing the images, after adjusting the window level to display similar contrast between the two images (Figure 6). With contrast equalized, the remaining difference in image quality is primarily due to noise, clearly demonstrating the superior CNR of the preferred image.
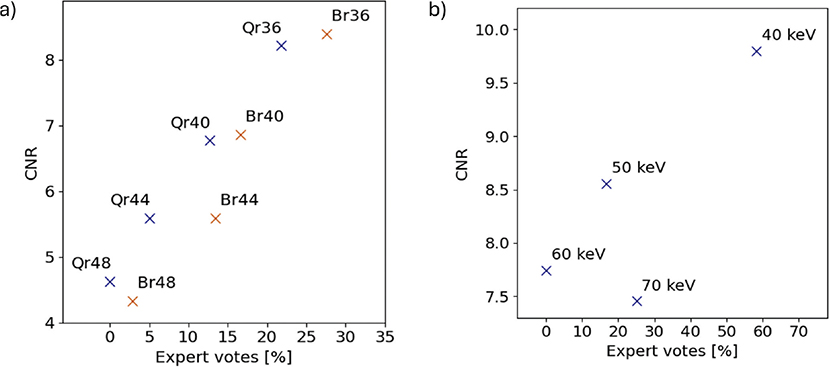
Figure 5. CNR between the prostate and bladder ROIs, averaged over patients 4 and 5, plotted against expert panel scores. (a) Reconstruction kernels averaged over all evaluated VMI energies. (b) VMI energies evaluated at the preferred kernel, Br36. CNR: contrast-to-noise ratio; VMI: virtual monoenergetic image; ROI: regions-of-interest.
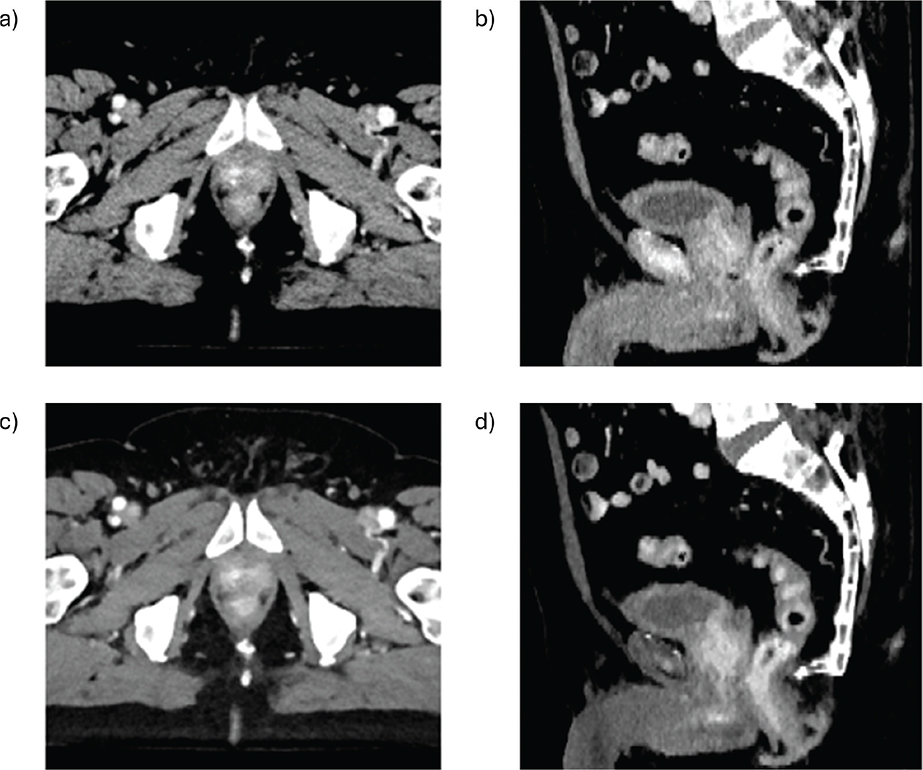
Figure 6. Comparison of two reconstruction parameter settings for patient 4. Axial views (a, c) are positioned just above the most caudally placed gold marker, and sagittal views (b, d) are centered on the prostate and bladder. (a–b) The 70 keV VMI with the Qr40 reconstruction kernel, which closely resembles the conventional SECT scan used as the standard for these patients. (c–d) The 40 keV VMI with the Br36 reconstruction kernel, identified as the preferred parameters. The window level settings were adjusted to achieve approximately equal contrast across the images, so the primary visible difference is the relative level of image noise. VMI: virtual monoenergetic image; SECT: single-energy computed tomography.
Discussion and conclusion
The results confirmed that quantitative metrics like image contrast and noise were strongly influenced by parameters such as the VMI energy and the reconstruction kernel, emphasizing the need to optimize these settings for improved clinical image quality.
The contrast and noise variations across kernel and VMI settings (Supplementary Material Figures S2 and S3) behaved as expected in both the phantom and patient datasets. Softer kernels reduced the noise without affecting the contrast notably, whereas lower VMI energies improved the contrast at the expense of increased noise, illustrating the inherent trade-offs between contrast enhancement and noise suppression in PCCT reconstruction. Lower VMI energies enhance tissue contrast because they increase the contribution of the photoelectric effect, which causes x-ray attenuation to vary more strongly with atomic number. However, lower VMI energies also increase image noise since these images give greater weight to the low-energy photon data, which has inherently higher quantum noise. Soft reconstruction kernels address this by applying image smoothing, reducing noise at the expense of spatial resolution.
The highest CNR values were consistently achieved using the softest kernels, Br36 and Qr36, in combination with the lowest VMI energies at 40–50 keV for both the phantom and patients with prostate cancer (Figure 2). These findings are consistent with previous results from diagnostic prostate cancer imaging using dual-energy CT [28, 29] as well as diagnostic liver imaging using PCCT [7]. Furthermore, Siemens’ dual-energy CT guideline for prostate delineation supports these results [30]. While this guideline reported no variation in CNR across different VMI energies, they noted that this is highly dependent on the choice of the reference ROI. In their case, the contrast was calculated relative to fat, whereas we used the bladder, which may explain the difference in CNR behavior.
Quantitative results alone, however, may not fully capture clinical preferences. Therefore, a qualitative assessment was performed on a subset of the patient data (Figure 6). While images with the highest CNR generally received the most votes from the panel of experts, one clear discrepancy was observed. The VMI at 70 keV, which is very similar to the SECT scan routinely used in clinical delineation, was rated higher than indicated by its CNR. This is not unexpected, as some degree of familiarity bias is thought to influence clinicians’ preferences, allowing them to overlook issues they are accustomed to seeing [31–33]. Nonetheless, the VMI at 40 keV was still preferred over the VMI at 70 keV, both quantitatively and qualitatively, indicating alignment between objective metrics and expert preference. Regarding the choice of reconstruction kernels, it is important to note that softer kernels reduce spatial resolution in order to minimize noise [34]. Despite this trade-off, the expert panel consistently regarded the noise reduction as beneficial, highlighting the clinical value of noise suppression over maximal spatial detail in this context. Furthermore, although the CNR values did not consistently favor either the Br or Qr kernels, the expert panel showed a clear preference for the Br kernels.
The strong agreement between the phantom and patient results (Figure 4) supports the use of standardized phantom evaluations as a proxy for patient-based assessments. Phantom studies offer a more controlled and reproducible environment for testing a wide range of parameters without patient-specific variability. This agreement, however, may be somewhat dependent on the materials used for the ROIs, supporting the use of 2 mg/cm³ iodine and solid water as suitable surrogates to assess preferred reconstruction settings for imaging the prostate and adjacent organs with PCCT.
This study was limited by the small patient cohort (n = 5) and the qualitative assessment based on only two cases. The limited number of qualitatively assessed cases was due to the time-consuming nature of the task and the involvement of a relatively large group of both local and external specialists, making additional assessment unfeasible. Future studies with larger patient cohorts and expanded qualitative feedback are required to further support the findings indicated here. Furthermore, due to the large number of possible reconstruction parameters, investigating the full parameter space was approximated by including evenly distributed points over the parameter space, with increased resolution in the areas with the highest CNR.
In conclusion, lower VMI energies and softer reconstruction kernels were found to improve the CNR in both phantom and patient data, which were closely aligned. The agreement between the phantom and patient data suggests that phantom-based evaluations could serve as a reliable and reproducible substitute for the optimization of reconstruction parameters. The clinical relevance of these quantitative findings was supported by the qualitative assessment by a multidisciplinary expert panel, confirming the preference for lower VMI energies and softer kernels. The results highlight the potential of using the CNR as an objective tool for optimizing PCCT reconstruction parameters for delineation in patients with prostate cancer receiving RT.
Acknowledgments
This work was supported by a research grant from Varian – a Siemens Healthineers company, Palo Alto, CA, USA. BIGART 2025 was financially supported by the Acta Oncologica Foundation.
Data availability statement
The imaging data used in this study involved patient CT scans, which are considered sensitive personal data and cannot be shared publicly due to ethical and legal restrictions.
Ethics declarations & trial registry information
This study was approved by the regional ethics committee (approval number H-23035686), and a written-informed consent was obtained from all participants.
Author contributions
JM Edmund designed the study. WE Olech and HK Mortensen set up the scan protocol and performed the scans. LMD Teller recruited the patients. MB Andersen and FC Müller conducted the subjective assessments. GF Persson, SE Petersen, H Lindberg, V Løgager, LMD Teller, HK Mortensen, and WE Olech participated in the expert panel. CV Henneberg performed the data analysis. CV Henneberg, CP Behrens, and JM Edmund drafted the manuscript. All authors reviewed, edited, and approved the final manuscript.
References
[1] Shah KD, Zhou J, Roper J, Dhabaan A, Al-Hallaq H, Pourmorteza A, et al. Photon-counting CT in cancer radiotherapy: technological advances and clinical benefits. Phys Med Biol. 2025;70(10):10TR01. https://doi.org/10.1088/1361-6560/add4ba
[2] Flohr T, Petersilka M, Henning A, Ulzheimer S, Ferda J, Schmidt B. Photon-counting CT review. Phys Med. 2020;79:126–36. https://doi.org/10.1016/j.ejmp.2020.10.030
[3] Nehra AK, Rajendran K, Baffour FI, Mileto A, Rajiah PS, Horst KK, et al. Seeing more with less: clinical benefits of photon-counting detector CT. Radiographics. 2023;43(5):e220158. https://doi.org/10.1148/rg.220158
[4] Kikano EG, Rajdev M, Salem KZ, Laukamp K, Felice CD, Gilkeson RC, et al. Utility of iodine density perfusion maps from dual-energy spectral detector CT in evaluating cardiothoracic conditions: a primer for the radiologist. Am J Roentgenol. 2020;214(4):775–85. https://doi.org/10.2214/AJR.19.21818
[5] Gallo P, D’Alessio A, Pascuzzo R, Gallo S, Fumagalli ML, Ortenzia O, et al. Enhancing soft tissue differentiation with different dual-energy CT systems: a phantom study. Appl Sci. 2024;14(5):1724. https://doi.org/10.3390/app14051724
[6] van der Bie J, van der Laan T, van Straten M, Booij R, Bos D, Dijkshoorn ML, et al. Photon-counting CT: an updated review of clinical results. Eur J Radiol. 2025;190:112189. https://doi.org/10.1016/j.ejrad.2025.112189
[7] Yang Y, Fink N, Emrich T, Graafen D, Richter R, Bockius S, et al. Optimization of kernel type and sharpness level improves objective and subjective image quality for high-pitch photon counting coronary CT angiography. Diagnostics. 2023;13(11):1937. https://doi.org/10.3390/diagnostics13111937
[8] Graafen D, Müller L, Halfmann MC, Stoehr F, Foerster F, Düber C, et al. Soft reconstruction kernels improve HCC imaging on a photon-counting detector CT. Acad Radiol 2023;30(1):S143–54. https://doi.org/10.1016/j.acra.2023.03.026
[9] Milos RI, Röhrich S, Prayer F, Strassl A, Beer L, Heidinger BH, et al. Ultrahigh-resolution photon-counting detector CT of the lungs: association of reconstruction kernel and slice thickness with image quality. AJR Am J Roentgenol. 2023;220(5):672–80. https://doi.org/10.2214/AJR.22.28515
[10] Rajagopal JR, Schwartz FR, McCabe C, Farhadi F, Zarei M, Ria F, et al. Technology characterization through diverse evaluation methodologies: application to thoracic imaging in photon-counting computed tomography. J Comput Assist Tomogr. 2025;49(1):113–24. https://doi.org/10.1097/RCT.0000000000001608
[11] Estler A, Nikolaou K, Schönberg SO, Bamberg F, Froelich MF, Tollens F, et al. Is there still a role for two-phase contrast-enhanced CT and virtual monoenergetic images in the era of photon-counting detector CT? Diagnostics. 2023;13(8):1454. https://doi.org/10.3390/diagnostics13081454
[12] Schade KA, Mergen V, Sartoretti T, Alkadhi H, Euler A. Pseudoenhancement in cystic renal lesions – impact of virtual monoenergetic images of photon-counting detector CT on lesion classification. Acad Radiol. 2023;30(Suppl. 1):S305–13. https://doi.org/10.1016/j.acra.2023.04.005
[13] Chamberlin JH, Toth A, Hinen S, O’Doherty J, Baruah D, Maisuria D, et al. Optimisation of virtual monoenergetic reconstructions for the diagnosis of pulmonary embolism using photon-counting detector computed tomography angiography. Pol J Radiol. 2024;89:e63–9. https://doi.org/10.5114/pjr.2024.134905
[14] Yalynska T, Polacin M, Frauenfelder T, Martini K. Impact of photon counting detector CT derived virtual monoenergetic images on the diagnosis of pulmonary embolism. Diagnostics. 2022;12(11):2715. https://doi.org/10.3390/diagnostics12112715
[15] Jungblut L, Abel F, Nakhostin D, Mergen V, Sartoretti T, Euler A, et al. Impact of photon counting detector CT derived virtual monoenergetic images and iodine maps on the diagnosis of pleural empyema. Diagn Interv Imaging. 2023;104(2):84–90. https://doi.org/10.1016/j.diii.2022.09.006
[16] Rau A, Straehle J, Stein T, Diallo T, Rau S, Faby S, et al. Photon-counting computed tomography (PC-CT) of the spine: impact on diagnostic confidence and radiation dose. Eur Radiol. 2023;33(8):5578–86. https://doi.org/10.1007/s00330-023-09511-5
[17] Marth AA, Goller SS, Kajdi GW, Marcus RP, Sutter R. Photon-counting detector CT: clinical utility of virtual monoenergetic imaging combined with tin prefiltration to reduce metal artifacts in the postoperative ankle. Invest Radiol. 2024;59(8):545–53. https://doi.org/10.1097/RLI.0000000000001058
[18] Patzer TS, Grunz JP, Huflage H, Hennes JL, Pannenbecker P, Gruschwitz P, et al. Ultra-high resolution photon-counting CT with tin prefiltration for bone-metal interface visualization. Eur J Radiol. 2024;170:111209. https://doi.org/10.1016/j.ejrad.2023.111209
[19] Popp D, Sinzinger AX, Decker JA, Braun F, Bette S, Risch F, et al. Spectral metal artifact reduction after posterior spinal fixation in photon-counting detector CT datasets. Eur J Radiol. 2023;165:110946. https://doi.org/10.1016/j.ejrad.2023.110946
[20] Schreck J, Laukamp KR, Niehoff JH, Michael AE, Boriesosdick J, Wöltjen MM, et al. Metal artifact reduction in patients with total hip replacements: evaluation of clinical photon counting CT using virtual monoenergetic images. Eur Radiol. 2023;33(12):9286–95. https://doi.org/10.1007/s00330-023-09879-4
[21] Gnasso C, Pinos D, Schoepf UJ, Vecsey-Nagy M, Aquino GJ, Fink N, et al. Impact of reconstruction parameters on the accuracy of myocardial extracellular volume quantification on a first-generation, photon-counting detector CT. Eur Radiol Exp. 2024;8(1):70. https://doi.org/10.1186/s41747-024-00469-7
[22] Schoenbeck D, Sacha A, Niehoff JH, Moenninghoff C, Borggrefe J, Kroeger JR et al. Imaging of hypodense gliotic lesions in photon counting computed tomography using virtual monoenergetic images. Neuroradiol J. 2024;37(3):336–41. https://doi.org/10.1177/19714009241240056
[23] Chen J, Gandomkar Z, Reed WM. Investigating the impact of cognitive biases in radiologists’ image interpretation: a scoping review. Eur J Radiol. 2023;166:111013. https://doi.org/10.1016/j.ejrad.2023.111013
[24] Sartoretti T, McDermott M, Mergen V, Euler A, Schmidt B, Jost G, et al. Photon-counting detector coronary CT angiography: impact of virtual monoenergetic imaging and iterative reconstruction on image quality. Br J Radiol. 2023;96(1143):20220466. https://doi.org/10.1259/bjr.20220466
[25] Vattay B, Boussoussou M, Vecsey-Nagy M, Kolossváry M, Juhász D, Kerkovits N, et al. Qualitative and quantitative image quality of coronary CT angiography using photon-counting computed tomography: standard and ultra-high resolution protocols. Eur J Radiol. 2024;175:111426. https://doi.org/10.1016/j.ejrad.2024.111426
[26] Dillinger D, Overhoff D, Booz C, Kaatsch HL, Piechotka J, Hagen A, et al. Impact of CT photon-counting virtual monoenergetic imaging on visualization of abdominal arterial vessels. Diagnostics. 2023;13(5):938. https://doi.org/10.3390/diagnostics13050938
[27] Edmund J, Feen Rønjom MF, van Overeem Felter M, Maare C, Margrete Juul Dam A, Tsaggari E, et al. Split-filter dual energy computed tomography radiotherapy: from calibration to image guidance. Phys Imaging Radiat Oncol. 2023;28:100495. https://doi.org/10.1016/j.phro.2023.100495
[28] Fan N, Chen X, Li Y, Zhu Z, Chen X, Yang Z, et al. Dual-energy computed tomography with new virtual monoenergetic image reconstruction enhances prostate lesion image quality and improves the diagnostic efficacy for prostate cancer. BMC Med Imaging. 2024;24(1):212. https://doi.org/10.1186/s12880-024-01393-3
[29] Zopfs D, Laukamp KR, Pinto dos Santos D, Sokolowski M, Hokamp NG, Maintz D, et al. Low-keV virtual monoenergetic imaging reconstructions of excretory phase spectral dual-energy CT in patients with urothelial carcinoma: a feasibility study. Eur J Radiol. 2019;116:135–43. https://doi.org/10.1016/j.ejrad.2019.05.003
[30] Siemens Healthcare GmbH. Dual energy CT cookbook: a guide to monoenergetic plus imaging in RT. 2020. Available from: https://marketing.webassets.siemens-healthineers.com/45b718b41759787a/a8fa3ffa6e46/siemens-healthineers-ct_Dual_Energy_Cookbook.pdf
[31] Lenga L, Czwikla R, Wichmann JL, Leithner D, Albrecht MH, D’Angelo T, et al. Dual-energy CT in patients with abdominal malignant lymphoma: impact of noise-optimised virtual monoenergetic imaging on objective and subjective image quality. Clin Radiol. 2018;73(9):833.e19–27. https://doi.org/10.1016/j.crad.2018.04.015
[32] Martin SS, Kolaneci J, Czwikla R, Booz C, Gruenewald LD, Albrecht MH, et al. Dual-energy CT for the detection of portal vein thrombosis: improved diagnostic performance using virtual monoenergetic reconstructions. Diagnostics. 2022;12(7):1682. https://doi.org/10.3390/diagnostics12071682
[33] Lam S, Gupta R, Levental M, Yu E, Curtin HD, Forghani R. Optimal virtual monochromatic images for evaluation of normal tissues and head and neck cancer using dual-energy CT. Am J Neuroradiol. 2015;36(8):1518–24. https://doi.org/10.3174/ajnr.A4314
[34] Schaller S, Wildberger JE, Raupach R, Niethammer M, Klingenbeck-Regn K, Flohr T. Spatial domain filtering for fast modification of the tradeoff between image sharpness and pixel noise in computed tomography. IEEE Trans Med Imaging. 2003;22(7):846–53. https://doi.org/10.1109/TMI.2003.815073