REVIEW ARTICLE
Revisiting insulin resistance in human cancer cachexia – a systematic review and meta-analysis
Jonas Sørensena  , Anna Hammershøia , Joan Miquel Màrmolb , Louise Lang Lehrskovc,d , Ole Nørgaarde and Lykke Sylowa
aDepartment of Biomedical Sciences, Faculty of Health and Medical Sciences, University of Copenhagen, Copenhagen, Denmark; bDepartment of Nutrition, Exercise, and Sports, Faculty of Science, University of Copenhagen, Copenhagen, Denmark; cCenter for Physical Activity Research (CFAS), Centre for Cancer and Organ Diseases, Copenhagen University Hospital – Rigshospitalet, Copenhagen, Denmark; dDepartment of Oncology, Copenhagen University Hospital – Herlev and Gentofte, Herlev, Denmark; eDepartment of Education, Danish Diabetes Knowledge Center, Copenhagen University Hospital – Steno Diabetes Center Copenhagen, Herlev, Denmark
ABSTRACT
Background: In patients with cancer, unintentional weight loss and cancer-associated cachexia (CAC) reduce overall survival and impair the quality of life. Because of insulin’s anabolic effects, insulin resistance could contribute to CAC progression. However, the role of insulin resistance in CAC remains unclear, and this study aimed to investigate the association between insulin resistance and CAC. Addressing this knowledge gap may help identify treatable targets to improve patient outcomes.
Methods: We performed a systematic review and meta-analysis. By including studies reporting both fasting levels of circulating insulin and glucose in patients with cancer and CAC according to the internationally accepted CAC definition, we calculated the HOMA-IR (Homeostatic Model Assessment for Insulin Resistance) index to estimate the level of insulin resistance (defined as HOMA-IR above 2.0) in patients with CAC. A subgroup analysis was conducted from studies reporting a HOMA-IR index both from a group of patients with CAC and a group without CAC (nonCAC).
Results: Seventeen studies were included, with a total of 197 patients. The mean HOMA-IR of all studies was 1.84 (95% confidence interval [CI]: 1.77–1.91). Twelve studies found HOMA-IR below 2.0. Five of the 17 studies also reported HOMA-IR from a group of patients with cancer without CAC. We observed a mean difference of −0.42 (95% CI: −2.24 to 1.40) in favour of a lower HOMA-IR in patients with CAC compared to nonCAC, and thus no statistically significant difference between the groups.
Interpretation: This systematic review suggests no clear association between insulin resistance and CAC. However, the limited sample sizes and study heterogeneity highlight the need for larger, longitudinal investigations.
KEYWORDS: Cancer; cachexia; insulin resistance; metabolism; weight loss
Citation: ACTA ONCOLOGICA 2025, VOL. 64, 1648–1656. https://doi.org/10.2340/1651-226X.2025.44280.
Copyright: © 2025 The Author(s). Published by MJS Publishing on behalf of Acta Oncologica. This is an Open Access article distributed under the terms of the Creative Commons Attribution 4.0 International License (http://creativecommons.org/licenses/by/4.0/).
Received: 1 July 2025; Accepted: 19 November 2025; Published: 9 December 2025
CONTACT: Lykke Sylow Lykkesylow@sund.ku.dk University of Copenhagen, BMI, MT2, Blegdamsvej 3B, 2200 Copenhagen, Denmark
Competing interests and funding: The authors report there are no competing interests to declare.
Supplemental data for this article can be accessed online at https://doi.org/10.2340/1651-226X.2025.44280
Introduction
Cancer-associated weight loss – termed cancer-associated cachexia (CAC) – lowers tolerance to anticancer treatment, reduces quality of life and impairs survival [1–3]. CAC is estimated to directly contribute to one in five cancer-related deaths [4], yet no U.S. Food and Drug Administration (FDA) or the European Medicines Agency (EMA)-approved drug to treat CAC is available. The underlying metabolic disturbance of CAC is not fully understood but involves the rapid depletion of both adipose tissue and skeletal muscle mass [5–7]. Insulin is a major inhibitor of adipose tissue lipolysis and controls muscle proteolysis and therefore could play a role in tissue wasting processes. While certain rodent studies indicate that insulin resistance contributes to CAC [8, 9], human data remain scarce, and the potential association between insulin resistance and CAC requires further investigation.
We recently established that patients with various cancers were markedly insulin-resistant [10]. Insulin resistance is a primary defect in type 2 diabetes, and accordingly, patients with cancer have an increased risk of new-onset type 2 diabetes after their cancer diagnosis [11, 12].
The development of CAC could be related to insulin resistance, as preexisting diabetes is related to a greater weight loss in patients with colorectal and pancreatic cancer compared to patients without diabetes [13]. However, that study did not directly assess insulin resistance and thus could not address whether there was an association between insulin resistance and CAC. Another study, which documented insulin resistance in patients with cancer using the gold standard hyperinsulinaemic euglycaemic clamp method, did not include information on weight loss [10], making it difficult to conclude on the association between insulin resistance and CAC. Molecularly, insulin’s effect on muscle protein synthesis is reduced in lung cancer patients with CAC compared to healthy controls, although no nonCAC cancer control patients were included [14]. Other clinical studies have aimed to untangle the role of insulin resistance in CAC using fasting insulin as a surrogate measure, but the findings are inconclusive and inconsistent [15, 16]. It therefore remains an unresolved question whether the documented association between cancer and insulin resistance [10] is related to the development of CAC. Such effort is challenging because the direct measurement of insulin sensitivity in humans requires a hyperinsulinaemic euglycaemic clamp that is invasive and time-consuming. Nonetheless, insulin resistance leads to elevated circulating insulin levels with, or without, an increase in blood glucose levels. These changes can be assessed using the Homeostatic Model Assessment of Insulin Resistance (HOMA-IR). Although HOMA-IR primarily estimates hepatic insulin resistance [17], it serves as a surrogate measure of whole-body insulin resistance [18] and demonstrates correlation with the hyperinsulinaemic–euglycaemic clamp [19]. Lower HOMA-IR values reflect lower blood glucose levels in relation to circulating insulin, indicating enhanced insulin sensitivity, whereas higher values suggest increased insulin resistance.
Altogether, it remains uncertain whether the documented association between cancer and insulin resistance is connected to the development of CAC. This study aimed to investigate whether insulin resistance was associated with CAC, potentially being a driver hereof. We hypothesised that higher insulin resistance is associated with CAC and conducted a systematic review of studies measuring fasting glucose and insulin to calculate HOMA-IR.
Patients/material and methods
This systematic review was guided by the Preferred Items for Systematic Review and Meta-Analyses (PRISMA) statement [20] and PRISMA Checklist (Table S1). A review protocol was published before data extraction and can be accessed on https://www.researchregistry.com (#1869).
Search strategy
The databases MEDLINE (via Ovid), Embase (via Ovid) and Cochrane Central Register of Controlled Trials (CENTRAL) were searched on 4 June 2024. The search was developed around three concepts – (1) cancer in humans, (2) cachexia and (3) insulin resistance expressed by the HOMA-IR index – using a combination of subject terms from the available controlled vocabularies (Medical Subject Headings and Emtree) as well as free-text terms. No restrictions were applied to publication type or language. The final search string was constructed for MEDLINE and subsequently translated to Embase and CENTRAL (Table S2 A-C) by an information specialist (O.N.). In addition, the reference lists of the included studies (backward citation) as well as studies citing the included studies (forward citation) were screened using the online tool Citation Chaser [21].
Eligibility criteria
Studies were included based on the following criteria: (1) patients with cancer aged 18 years or older; and (2) studies that report data on weight loss and sarcopenia, sufficient for the diagnosis of CAC. The diagnostic criterion for CAC was more than 5% loss of stable body weight over the past 6 months OR a BMI less than 20 kg/m² and ongoing weight loss of more than 2% OR sarcopenia and ongoing weight loss of more than 2% without entering the refractory stage [6]. Sarcopenia is here defined as L3 CT-derived skeletal muscle index (SMI) (cm2/m2) < 43/41 for normal or underweight men/women and < 53/41 for overweight and obese men/women [3]; and (3) studies that report data on fasting blood glucose and plasma/serum insulin levels, including glucose and plasma/serum insulin levels obtained during an OGTT. Studies were excluded based on the following criteria: (1) studies only on non-cancer patients; (2) studies only on patients with haematologic malignancies; (3) studies without specific weight loss data; (4) studies without specific fasting glucose and insulin data; (5) studies with patients with documented diabetes, reported use of anti-diabetic medication or daily use of steroids or no specific information on diabetes or use of antidiabetic drugs; (6) studies including cancer survivors or studies that did not specify the cancer status of the patients; (7) studies reusing data from previously included studies, thus reanalysing the same patients; and (8) studies on animals.
Study selection
To select studies that both included data on CAC and fasting blood glucose and insulin, three authors (J.S., A.H. and L.L.L.) independently double-screened the titles and abstracts of all identified records for eligibility. Full-text reports of the remaining studies were double-screened by the same three authors. Discrepancies were resolved through discussions and consensus. The screening process was conducted in EPPI-Reviewer Web [22].
Data extraction
The following data were extracted from each study and are summarised in Table 1: first author (reference), year of publication, population country, target population, number of eligible patients in the study, population sex distribution, population age, weight loss %, fasting glucose, fasting insulin and calculated HOMA-IR.
| First author | Year | Country | Cancer site | Patient, n (F/M) | Patient, age mean (SD) | Weight loss (%) | Glucose mean, mmol/L (SD) | Insulin mean, mU/L (SD) | HOMA-IR |
| Bennegård K et al. [1] | 1982 | Sweden | Various | 19 (NS) | 59 (± 2) | 19 | 5.26 (± 0.33) | 7 (± 1) | 1.64 |
| Bennegård K et al. [2] | 1983 | Sweden | Various | 8 (NS) | 54 (± 6) | 18 | 5.02 (± 0.2) | 7 (± 1) | 1.56 |
| Burt ME et al. | 1983 | US | Esophageal | 6 (1/5) | 65 (± 3) | 19.9 | 3.45 (± 0.11) | 5.3 (± 1.3) | 0.81 |
| Eden E et al. | 1984 | Sweden | Various | 8 (NS) | 55 (± 5) | 15 | 4.92 (± 0.2) | 7 (± 1) | 1.53 |
| Holroyde c et al. | 1984 | US | Colorectal | 12 (NS) | 68 (NS) | 10 | 5 (± 0.12) | 14.9 (± 2) | 3.31 |
| Heber D et al. | 1985 | US | Lung | 38 (NS) | 59 (± 2) | 16 | 5.16 (± 0.1) | 16 (± 2) | 3.67 |
| Bennegård K et al. [3] | 1986 | Sweden | Various | 5 (NS) | 60 (± 2) | 18 | 4 (± 0.61) | 5 (± 2) | 0.89 |
| Selberg o et al. | 1990 | UK | Various | 4 (NS) | 56 (NS) | 10 | 4.86 (± 1.21) | 4.9 (± 1.22) | 1.06 |
| Cersosimo E et al. | 1991 | US | Gastrointestinal | 5 (2/3) | 52 (± 5) | 15 | 5.44 (± 0.16) | 9 (± 2) | 2.18 |
| Heslin M et al. | 1992 | US | Various | 8 (3/5) | 55 (± 2) | 18 | 5 (± 0.16) | 8 (± 1) | 1.78 |
| McCall J et al. | 1992 | New Zealand | Gastrointestinal | 3 (NS) | (NS) | 14.3 | 4.73 (± 1.18) | 12.63 (± 3.1) | 2.65 |
| Pisters P et al. | 1992 | US | Gastrointestinal | 6 (NS) | 56 (NS) | 17.5 | 5.17 (± 0.16) | 11 (± 3) | 2.55 |
| Rofe A et al. | 1994 | Astralia | Various | 35 (NS) | (NS) | 13 | 5.11 (± 0.1) | 7.8 (± 0.2) | 1.77 |
| Yoshikawa T et al. | 1994 | Japan | Various | 5 (NS) | (NS) | 8.6 | 4.77 (± 0.06) | 8.3 (± 3.2) | 1.78 |
| Barber MD et al. | 2000 | UK | Pancreatic | 16 (NS) | 63 (± 4) | 17.7 | 5.5 (± 0.81) | 3.3 (± 2.22) | 0.81 |
| Leij-Halfwerk S et al. | 2000 | The Netherlands | Lung | 9 (NS) | 67 (NS) | 12 | 5.8 (± 0.3) | 5.85 (± 2) | 1.51 |
| Agustsson T et al. | 2007 | Sweden | Gastrointestinal | 15 (3/12) | 65 (± 5) | 20 | 6.4 (± 1.6) | 6.7 (± 3.3) | 1.90 |
| F/M: female/male; SD: standard deviation; NS: not stated; HOMA-IR: Homeostatic Model Assessment of Insulin Resistance; %: percentage; mmol: millimole; mU: milliunits; L: litre. | |||||||||
Quality assessment
Two review authors (J.S., A.H.) independently assessed the methodological quality of the included studies using appropriate checklists provided by Joanna Briggs Institute (JBI) critical appraisal tools [23] (Supporting Information S3–19). All eligible studies were included regardless of methodological quality, but their limitations were considered in the interpretation of results [24].
Data analysis
The research was synthesised in a systematic manner. The data extracted from the reviewed studies were based on (1) insulin sensitivity (IR) reported as HOMA-IR = (insulin × glucose)/22.5 for the glucose concentration in mmol/L, or HOMA-IR = (insulin × glucose)/405 for glycaemia in mg/dL; in both cases, the insulin is in mU/L or uU/ml; and (2) weight loss% (WL%) is reported in the most detailed version possible.
Insulin resistance has been defined as a HOMA-IR cut-off of 2.0, representing 25% of the population with the highest fasting insulin concentrations [18, 25]. This cut-off was applied, and the prevalence of insulin resistance in the CAC patients was calculated.
Following meta-analytic methods, we calculated a pooled mean HOMA-IR, and through its standard deviation (SD), a 95% confidence interval (CI) was calculated using the inverse variance method and a random-effects model. Heterogeneity detected by the I square (I2) test, significant heterogeneity was defined as I2 > 50% with a P < 0.05. Subgroup analysis was performed to discover the source of heterogeneity. We used the Cohen statistic and investigated the influence of each study on pooled effect size.
Results
Eligible studies
Our search yielded 3,138 records. After removal of 382 duplicates, 2,756 records remained for title and abstract screening (Figure 1). Following this screening, 52 records remained for full-text screening. It was possible to retrieve all the full-text articles. Thirty-eight records were excluded for not meeting our eligibility criteria (see reasons for exclusion in Table S20). Additionally, three reports were identified through citation searching. In total, 17 studies including 197 patients with cancer and CAC reported measures on fasting glucose and insulin and were included in the analysis. Studies were published from 1982 to 2007.
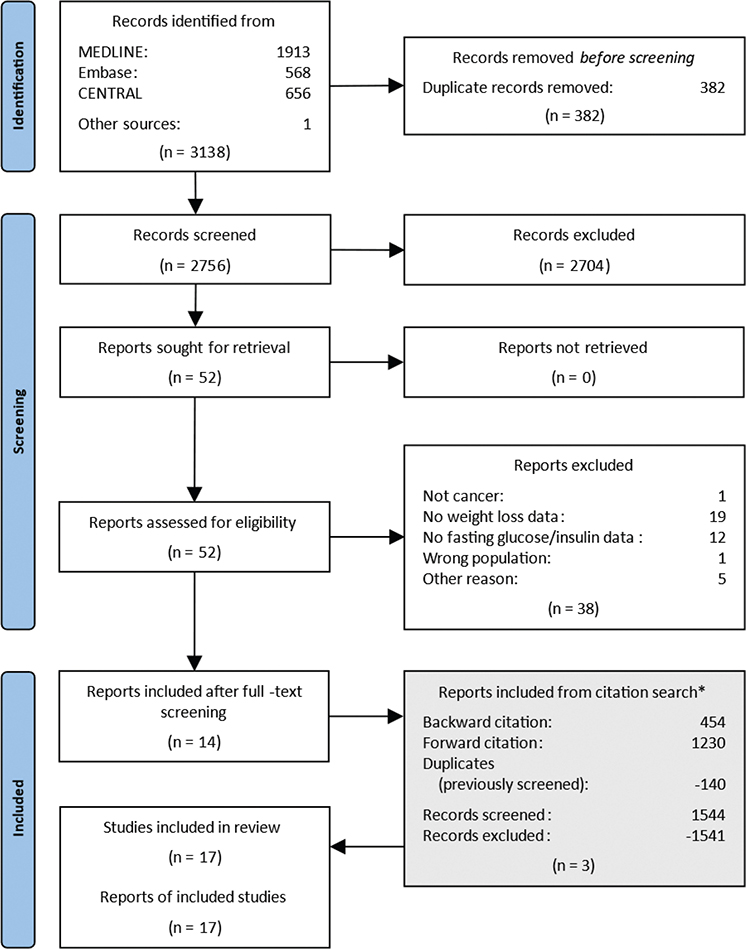
Figure 1. Flow diagram of study selection. *The reports identified from the citation search are located at the bottom to maintain a chronological flow in the diagram. However, they have gone through the same process of deduplication, title and abstract screening, and full text screening.
For all eligible studies, direct personal contact was attempted by contacting the authors via email. In two cases, a personal reply from the 1st author resulted in individual values from three patients [26] and four patients [16], respectively. No other authors were able to share individual values on fasting glucose and insulin. For that reason, individual values for each patient in this review were not available, and therefore one mean HOMA-IR value was used per study. Studies reporting blood glucose and insulin values from arterial blood levels were accepted [27, 28]; because of the fasting and resting condition of the patients, the arterial-venous difference was assumed to be zero [29]. In two studies, it was possible from a manuscript figure to determine the mean values of glucose [30] and insulin [31], respectively, by using the tool PlotDigitizer [32]. In these two studies, the SD was estimated as one-quarter of the mean. Where glucose and insulin levels were reported with SE (standard error), SD was calculated by multiplying SE by the square root of the sample size. One study reported glucose and insulin in median/IQR [33] – here we assumed normal distribution (mean = median) and estimated SD = IQR/1.35. SD for the calculated HOMA-IR could be calculated as the square root of the HOMA-IR variance, and 95% CI = mean ± 1.96 × SD/√n.
Study characteristics
Table 1 summarises the main characteristics of the included studies. Of the 17 studies included with a total of 197 patients with CAC, the HOMA-IR values ranged from 0.81 to 3.67. All studies except three [26, 34, 35] reported the mean age, ranging from 52 to 68 years. Five studies reported on the distribution between females and males in patients with CAC [16, 36-39]. The sample size in each study ranged from three to 38 patients. One study [39] included two separate groups of patients with CAC – one with and one without secondary nutrition impact symptoms, for example, anorexia. Without contradicting the inclusion criteria, these two CAC groups were merged into one.
Two studies included solely patients with lung cancer [31, 40]; seven studies included patients with gastrointestinal cancers, oesophageal cancer [36], colorectal cancer [30], upper gastrointestinal cancer [41], gastrointestinal cancers not otherwise specified [26, 37, 39], pancreatic cancer [33]; and eight studies included patients with various cancer diagnoses [15, 16, 27, 28, 34, 35, 38, 42]. Eight studies reported that all included patients were untreated for their cancer [15, 27, 28, 33, 37, 39, 41, 42]. Two studies reported that a fraction of the patients included were pretreated for the cancer [31, 38]. One study reported that included patients did not have any anticancer treatment three months prior to the study [26]. One study reported that patients were included immediately prior to the next line of treatment [34]. One study stated that all patients were pretreated for the cancer [30]. Eight studies reported that some or all patients had advanced disease [26–28, 30, 31, 34, 35, 42]. Two studies reported that patients included only had local disease [36, 41]. None of the studies reported clearly about ethnicity in the patients included. All but one study [35] were performed in the US, Europe, Australia or New Zealand.
Meta-analyses
The mean HOMA-IR of the 17 studies with patients with CAC was 1.84 (95% CI: 1.77–1.91). Figure 2 shows a forest plot with individual HOMA-IR and 95% CI depicted along a vertical line representing the cut-off value of 2.0 (see Data analysis section). In five studies, the patients had a mean HOMA-IR higher than the defined cut-off of 2.0 [26, 30, 37, 40, 41]. In 12 studies, the patients had a mean HOMA-IR below 2.0; four below 1.1 [15, 16, 33, 36]; and in eight of the studies, the mean HOMA-IR was between 1.5 and 2.0 [27, 28, 31, 34, 35, 38, 39, 42]. Thus, overall, we did not find indications of insulin resistance in 12 of the 17 included studies, challenging the notion that insulin resistance is associated with CAC.
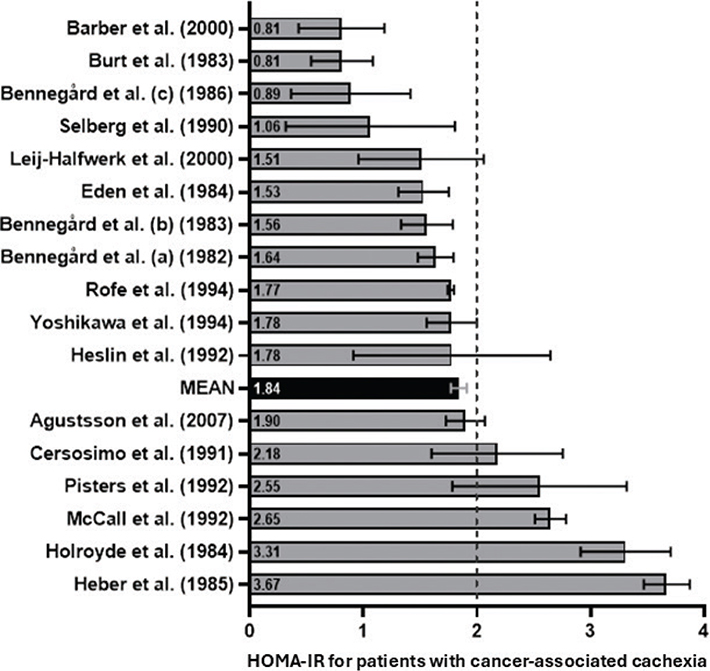
Figure 2. Homeostatic Model Assessment of Insulin Resistance for studies on patients with cancer-associated cachexia. Studies are lined up according to the individual calculated HOMA-IR values, including 95% confidence interval. A vertical dotted line represents the HOMA-IR cut-off value of 2.0. A mean HOMA-IR for all 17 studies including a 95% confidence interval is shown in black. HOMA-IR: Homeostatic Model Assessment of Insulin Resistance.
Next, we aimed to compare HOMA-IR between patients with cancer and CAC and those with nonCAC. However, not all studies provided data allowing comparisons with a cancer population without CAC, limiting a direct assessment of the difference in HOMA-IR between the two groups. Nevertheless, we identified five out of 17 included studies that reported HOMA-IR values for a nonCAC group, defined as having no weight loss or weight loss of < 5% in the last 6 months [6] (Table 2). A secondary analysis of these studies was therefore possible [26, 31, 35, 38, 39] and we analysed HOMA-IR from five studies including 37 patients with CAC and 49 patients with nonCAC (Figure 3). Here we observed a mean difference of −0.42 (95% CI: −2.24 to 1.40). In the CAC and nonCAC groups, the HOMA-IR index ranged from 1.51 to 2.65 and 0.89 to 4.72, respectively (Figure 3). Thus, this separate meta-analysis showed a mean difference of −0.42 in favour of a lower HOMA-IR in patients with CAC compared to patients with nonCAC (Figure 3). However, the 95% CI crosses zero, and our analysis cannot demonstrate a significant association between CAC and insulin resistance.
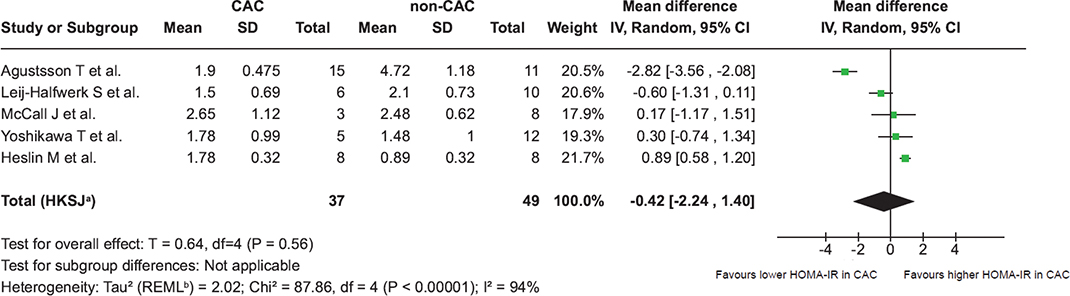
Figure 3. Forest plot comparing Homeostatic Model Assessment of Insulin Resistance stratifying patients with and without cancer-associated cachexia. Forest plot comparing HOMA-IR in the five studies (mean) stratifying patients with CAC and nonCAC. CAC: patients with cancer-associated cachexia; nonCAC: patients without cancer-associated cachexia; SD: standard deviation; CI: confidence interval; IV: inverse variance; HOMA-IR: Homeostatic Model Assessment of Insulin Resistance. A Random effect model is used to account for both within study and between-study variability. a 95% CI calculated by Hartung-Knapp-Sidik-Jonkman method. b Tau2 calculated by Restricted Maximum-Likelihood method.
Quality assessment
The results of the methodological quality assessment of the studies included using the JBI Critical Appraisal Tools (Supplemental materials S3–19). We observed significant heterogeneity between the studies with I2 = 94% with a P < 0.05. A funnel plot assessing publication bias was opted out because of the low sample size of five studies in the subgroup analysis.
Discussion and conclusion
To our knowledge, this is the first systematic review examining the association between CAC and insulin resistance, assessed by HOMA-IR. A total of 17 studies comprising 197 patients with cancer and CAC were included. Our results indicate that most patients with cancer and CAC are within the normal insulin sensitivity reference range.
We showed that most patients with cancer and CAC fall within the normal insulin sensitivity range, suggesting that insulin resistance is not a primary driver of CAC. These results appear to contradict previous evidence and the prevailing belief that insulin resistance is associated with CAC. Notably, patients with cancer in general exhibit insulin resistance as documented in a recent meta-analysis [10] and accordingly have a higher risk of developing type 2 diabetes [11, 12]. Moreover, patients with cancer have been reported to respond to elevated glucose levels in a diabetic manner with reduced glucose disposal curves [43, 44]. While documenting insulin resistance and dysregulated glucose metabolism, none of those studies stratified patients with CAC, which was done in our study. These present results challenge the prevailing notion that insulin resistance serves as a driving factor for CAC.
In contrast to the overall normal fasting blood glucose in all but two studies one reporting hypoglycaemia of 3.45 mmol/L [36] and one reporting hyperglycaemia of 5.8 mmol/L [31]), we observed great variation in fasting insulin levels between studies. There is no international standard normal range for fasting insulinaemia in a non-diabetic population, but a normo-insulinaemic range from 2 to 15 mU/L is accepted [25, 45]. Five studies were found in the low-normal end with insulin levels < 6 mU/L [15, 16, 31, 33, 36]. Five studies with normal to high insulin levels (≥ 9 mU/L) were identified, all of which also had a calculated HOMA-IR > 2.0 [26, 30, 37, 40, 41].
While most studies reported that patients with cancer and CAC fall within the normal insulin sensitivity range, we did identify five studies with a mean HOMA-IR > 2.0 [26, 30, 37, 40, 41], indicative of insulin resistance (Figure 2). In all five studies, the high HOMA-IR was driven by normal-high insulinaemia and not hyperglycaemia. Hyperinsulinaemia in the presence of euglycaemia is a hallmark of prediabetes that is primarily because of peripheral insulin resistance of the muscle [17]. Unfortunately, peripheral insulin resistance was not determined in this study but is highly common in the general cancer patient population [10]. No common features in relation to cancer types, treatment status, degree of weight loss, age or sex distribution from the five studies with HOMA-IR > 2.0 can be extracted besides all being conducted in the US or New Zealand. Thus, no confounding factors were identified that could explain the association or lack thereof between CAC and insulin resistance.
The findings from the meta-analysis did not have the statistical power to show a significant difference in HOMA-IR between CAC and nonCAC patients. Other studies have shown that in response to a glucose challenge, the insulin response is lower in patients with cancer and CAC compared to nonCAC [46, 47], indicative of increased insulin sensitivity in patients with CAC. Accordingly, underweight patients with cancer exhibited greater insulin sensitivity compared to their normal-weight counterparts, as estimated in response to intravenous glucose infusion [48].
Supported by our main finding, that most patients with cancer and CAC are within the normal insulin sensitivity reference range, the mentioned studies [46–48] could suggest that while patients with cancer generally exhibit insulin resistance and metabolic dysregulation, patients with CAC appear to either preserve insulin sensitivity or counteract the insulin-resistance-inducing effects of cancer to some extent.
The underlying biological mechanisms were not identified in the present study but could include several factors.
Firstly, lower insulin resistance in patients with CAC, compared to the general cancer population, may be attributed to malnutrition. Both low body weight and reduced food intake are generally associated with increased insulin sensitivity and low insulin levels in humans [48] and preclinical models [49]. Consistently, five of our included studies reported fasting insulin levels within the low-normal range in patients with CAC [15, 16, 31, 33, 36]. Therefore, the well-documented cancer-associated insulin resistance in humans [10] may be partially counteracted by malnutrition and/or progressive weight loss in patients with CAC.
Secondly, increased glucose disposal into highly glycolytic tumours may contribute to overall improved whole-body glycaemic control, leading to a lower HOMA-IR. However, it remains unclear whether tumours that induce CAC exhibit higher metabolic rates and consequently utilise more glucose compared to nonCAC-inducing tumours.
Thirdly, metabolic reprogramming in tissues undergoing wasting may contribute to the observed absence of insulin resistance in patients with CAC compared to the general cancer population. Cancer and cancer-secreted factors can induce profound metabolic disruptions, as documented in numerous preclinical [9, 50-52] and clinical studies [53-55]. In the context of CAC, the activation of catabolic pathways and the disruption of energy homeostasis in adipose and muscle tissue may paradoxically enhance insulin sensitivity or induce glucose uptake via insulin-independent pathways [56]. This metabolic reprogramming, characteristic of CAC, could play a key role in mitigating insulin resistance.
This study has several limitations that should be considered when interpreting the findings. The study populations are heterogeneous, with variations in treatment regimens, unreported comorbidities, unreported stages of the cancers and concurrent therapies. This introduced confounding factors and reduced the internal validity. The considerable heterogeneity between the studies indicates that the true effect size varies considerably, making it more difficult to interpret pooled results. To reduce the heterogeneity in the studied populations, we decided to include studies on patients with solid tumours and excluded studies on patients with haematological malignancies, a group of patients less well studied in relation to CAC and known to have a prevalence of CAC below 40% [57, 58]. This decision reduced the number of studies included and is therefore a limitation to our study. Additionally, the 17 studies were conducted across different institutions over a span of 25 years, with inconsistencies in insulin assays and sample handling that may have influenced HOMA-IR measurements. Furthermore, individual fasting glucose and insulin levels were unavailable, requiring reliance on mean values to calculate HOMA-IR at the group level for each study. Our meta-analysis on a subgroup of studies was underpowered and could not show a statistically significant difference in HOMA-IR between CAC and nonCAC patients. A large systematic review clearly stating the CAC status of all patients and reporting individual levels of insulin sensitivity obtained from a hyperinsulinaemic euglycaemic clamp, measuring whole-body insulin sensitivity, would be the optimal design; unfortunately, the details are not available [10]. Given these limitations and the high heterogeneity of the included studies, it is difficult to draw firm conclusions, underscoring the need for further research. We encourage future studies to reduce heterogeneity in the studied populations and to include CAC status when performing hyperinsulinaemic euglycaemic clamps on patients with cancer.
Despite these limitations, this is the first comprehensive analysis of studies measuring HOMA-IR in patients with cancer and CAC, indicating that insulin resistance is less pronounced in CAC compared to nonCAC cancer populations.
Further research, particularly longitudinal human studies directly assessing insulin sensitivity, is essential to uncover the biological mechanisms. As our understanding of CAC-associated metabolic alterations advances, exciting discoveries may change our approach to cancer metabolism and its complications.
Conclusion
The role of insulin resistance as a driver of cachexia in humans has remained unclear. Our findings suggest no clear association between insulin resistance and CAC. The limited sample sizes and study heterogeneity highlight the need for larger, longitudinal investigations, which are needed to uncover molecular disturbances during treatment and identify potential therapeutic targets. Such investigations may reshape our understanding of the complex relationship between insulin resistance and CAC.
Acknowledgements
L.S. is funded by the Novo Nordisk Foundation, The Danish Cancer Society, The Carlsberg Foundation and Independent Research Fund Denmark. O.N. is employed at Copenhagen University Hospital – Steno Diabetes Center Copenhagen, a public hospital and research institution under the Capital Region of Denmark, which is partly funded by a grant from the Novo Nordisk Foundation.
Data availability statement
The data that support the findings of this study are available from the corresponding author, J.S., upon reasonable request.
Ethics declarations and trial registry information
All studies stated clearly that all patients gave their informed consent prior to their inclusion in the study. This manuscript complies with the ethical guidelines for authorship and publishing in the Acta Oncologica.
Author contributions
Conceptualization: J.S. and L.S. Screening and data extraction: J.S., A.H. and L.L.L. Formal analysis: J.M.M. and J.S. Methodology: all authors. Supervision: L.S. Validation: all authors. Writing draft: J.S. and L.S. Writing review and editing: all authors.
References
[1] Mytelka DS, Li L, Benoit K. Post‐diagnosis weight loss as a prognostic factor in non‐small cell lung cancer. J Cachexia Sarcopenia Muscle. 2018 Feb 4;9(1):86–92. https://doi.org/10.1002/jcsm.12253
[2] Sánchez-Lara K, Turcott JG, Juárez E, Guevara P, Núñez-Valencia C, Oñate-Ocaña LF, et al. Association of nutrition parameters including bioelectrical impedance and systemic inflammatory response with quality of life and prognosis in patients with advanced non-small-cell lung cancer: a prospective study. Nutr Cancer. 2012 May;64(4):526–34. https://doi.org/10.1080/01635581.2012.668744
[3] Martin L, Birdsell L, MacDonald N, Reiman T, Clandinin MT, McCargar LJ, et al. Cancer cachexia in the age of obesity: skeletal muscle depletion is a powerful prognostic factor, independent of body mass index. J Clin Oncol. 2013 Apr 20;31(12):1539–47. https://doi.org/10.1200/JCO.2012.45.2722
[4] Argilés JM, López-Soriano FJ, Stemmler B, Busquets S. Cancer-associated cachexia – understanding the tumour macroenvironment and microenvironment to improve management. Nat Rev Clin Oncol. 2023 Apr 20;20(4):250–64. https://doi.org/10.1038/s41571-023-00734-5
[5] Pryce BR, Oles A, Talbert EE, Romeo MJ, Vaena S, Sharma S, et al. Muscle inflammation is regulated by NF-κB from multiple cells to control distinct states of wasting in cancer cachexia. Cell Rep. 2024 Nov;43(11):114925. https://doi.org/10.1016/j.celrep.2024.114925
[6] Fearon K, Strasser F, Anker SD, Bosaeus I, Bruera E, Fainsinger RL, et al. Definition and classification of cancer cachexia: an international consensus. Lancet Oncol. 2011 May;12(5):489–95. https://doi.org/10.1016/S1470-2045(10)70218-7
[7] Sørensen J. Lung cancer cachexia: can molecular understanding guide clinical management? Integr Cancer Ther. 2018;17(3):1000-1008. https://doi.org/10.1177/1534735418781743
[8] Miksza DR, Biazi GR, Frasson IG, de Souza Galia WB, Ferraz LS, Diaz BF, et al. Insulin in combination with pioglitazone prevents advanced cachexia in 256-Walker tumor-bearing rats: effect is greater than treatment alone and is associated with improved insulin sensitivity. Pharmacol Rep. 2023 Dec 7;75(6):1571–87. https://doi.org/10.1007/s43440-023-00533-w
[9] Raun SH, Ali MS, Han X, Henríquez‐Olguín C, Pham TCP, Meneses‐Valdés R, et al. Adenosine monophosphate‐activated protein kinase is elevated in human cachectic muscle and prevents cancer‐induced metabolic dysfunction in mice. J Cachexia Sarcopenia Muscle. 2023 Aug 16;14(4):1631–47. https://doi.org/10.1002/jcsm.13238
[10] Màrmol JM, Carlsson M, Raun SH, Grand MK, Sørensen J, Lang Lehrskov L, et al. Insulin resistance in patients with cancer: a systematic review and meta-analysis. Acta Oncol. 2023 Apr 12;(62)364–71. https://doi.org/10.1080/0284186X.2023.2197124
[11] Hwangbo Y, Kang D, Kang M, Kim S, Lee EK, Kim YA, et al. Incidence of diabetes after cancer development: a Korean National Cohort Study. JAMA Oncol. 2018 Aug 1;4(8):1099–105. https://doi.org/10.1001/jamaoncol.2018.1684
[12] Sylow L, Grand MK, von Heymann A, Persson F, Siersma V, Kriegbaum M, et al. Incidence of new-onset type 2 diabetes after cancer: a Danish cohort study. Diabetes Care. 2022 Jun 2;45(6):e105–6. https://doi.org/10.2337/dc22-0232
[13] Chovsepian A, Prokopchuk O, Petrova G, Gjini T, Kuzi H, Heisz S, et al. Diabetes increases mortality in patients with pancreatic and colorectal cancer by promoting cachexia and its associated inflammatory status. Mol Metab. 2023 Jul;73:101729. https://doi.org/10.1016/j.molmet.2023.101729
[14] Chevalier S, Farsijani S. Cancer cachexia and diabetes: similarities in metabolic alterations and possible treatment. Appl Physiol Nutr Metab. 2014 Jun;39(6):643–53. https://doi.org/10.1139/apnm-2013-0369
[15] Bennegård K, Lundgren F, Lundholm K. Mechanisms of insulin resistance in cancer associated malnutrition. Clin Physiol. 1986 Dec;6(6):539-47. https://doi.org/10.1111/j.1475-097x.1986.tb00787.x
[16] Selberg O, McMillan DC, Preston T, Carse H, Shenkin A, Burns HJG. Palmitate turnover and its response to glucose infusion in weight-losing cancer patients. Clin Nutr. 1990 Jun;9(3):150–6. https://doi.org/10.1016/0261-5614(90)90047-v
[17] Matsuda M, DeFronzo RA. Insulin sensitivity indices obtained from oral glucose tolerance testing: comparison with the euglycemic insulin clamp. Diabetes Care. 1999 Sep 1;22(9):1462–70. https://doi.org/10.2337/diacare.22.9.1462
[18] Hedblad B, Nilsson P, Janzon L, Berglund G. Relation between insulin resistance and carotid intima‐media thickness and stenosis in non‐diabetic subjects. Results from a cross‐sectional study in Malmö, Sweden. Diabet Med. 2000 Apr 13;17(4):299–307. https://doi.org/10.1046/j.1464-5491.2000.00280.x
[19] Bonora E, Targher G, Alberiche M, Bonadonna RC, Saggiani F, Zenere MB, et al. Homeostasis model assessment closely mirrors the glucose clamp technique in the assessment of insulin sensitivity: studies in subjects with various degrees of glucose tolerance and insulin sensitivity. Diabetes Care. 2000 Jan 1;23(1):57–63. https://doi.org/10.2337/diacare.23.1.57
[20] Page MJ, McKenzie JE, Bossuyt PM, Boutron I, Hoffmann TC, Mulrow CD, et al. The PRISMA 2020 statement: an updated guideline for reporting systematic reviews. BMJ. 2021 Mar 29:372:n71. https://doi.org/10.1136/bmj.n71
[21] Haddaway NR, Grainger MJ, Gray CT. Citationchaser: a tool for transparent and efficient forward and backward citation chasing in systematic searching. Res Synth Methods. 2022 Jul 7;13(4):533–45. https://doi.org/10.1002/jrsm.1563
[22] Thomas J, Graziosi S, Brunton J, Ghouze Z, O’Driscoll P, Bond M, Koryakina A. EPPI-Reviewer: advanced software for systematic reviews, maps and evidence synthesis. EPPI Centre, UCL Social Research Institute, University College London, London, UK, 2023.
[23] Available from: https://jbi.global/critical-appraisal-tools
[24] Higgins JPT, Thomas J, Chandler J, Cumpston M, Li T, Page MJ, et al. Cochrane handbook for systematic reviews of interventions version 6.5 (updated August 2024). Cochrane; 2024. [accessed Feb 12 2025] Available from: www.training.cochrane.org/handbook
[25] Balkau B, Charles MA. Comment on the provisional report from the WHO consultation. Diabet Med. 1999 May 24;16(5):442–3. https://doi.org/10.1046/j.1464-5491.1999.00059.x
[26] McCall JL, Tuckey JA, Parry BR. Serum tumour necrosis factor alpha and insulin resistance in gastrointestinal cancer. Br J Surg. 1992 Dec 8;79(12):1361–3. https://doi.org/10.1002/bjs.1800791240
[27] Bennegård K, Edén E, Ekman L, Scherstén T, Lundholm K. Metabolic balance across the leg in weight-losing cancer patients compared to depleted patients without cancer. Cancer Res. 1982 Oct;42(10):4293–9.
[28] Bennegård K, Edén E, Ekman L, Scherstén T, Lundholm K. Metabolic response of whole body and peripheral tissues to enteral nutrition in weight-losing cancer and noncancer patients. Gastroenterology. 1983 Jul;85(1):92–9. https://doi.org/10.1016/S0016-5085(83)80234-0
[29] Bell DM. Femoral arteriovenous sugar differences in fasting human beings. J Lab Clin Med. 1952 Sep;40(3):337–41.
[30] Holroyde CP, Skutches CL, Boden G, Reichard GA. Glucose metabolism in cachectic patients with colorectal cancer. Cancer Res. 1984 Dec;44(12 Pt 1):5910–3.
[31] Leij-Halfwerk S, van den Berg JW, Sijens PE, Wilson JH, Oudkerk M, Dagnelie PC. Altered hepatic gluconeogenesis during L-alanine infusion in weight-losing lung cancer patients as observed by phosphorus magnetic resonance spectroscopy and turnover measurements. Cancer Res. 2000 Feb 1;60(3):618–23.
[32] Available from: https://plotdigitizer.com/app
[33] Barber MD, McMillan DC, Preston T, Ross JA, Fearon KC. Metabolic response to feeding in weight-losing pancreatic cancer patients and its modulation by a fish-oil-enriched nutritional supplement. Clin Sci (Lond). 2000 Apr;98(4):389–99. https://doi.org/10.1042/cs0980389
[34] Rofe AM, Bourgeois CS, Coyle P, Taylor A, Abdi EA. Altered insulin response to glucose in weight-losing cancer patients. Anticancer Res. 1994 Mar-Apr;14(2B):647–50.
[35] Yoshikawa T, Noguchi Y, Matsumoto A. Effects of tumor removal and body weight loss on insulin resistance in patients with cancer. Surgery. 1994 Jul;116(1):62–6.
[36] Burt ME, Aoki TT, Gorschboth CM, Brennan MF. Peripheral tissue metabolism in cancer-bearing man. Ann Surg. 1983 Dec;198(6):685–91. https://doi.org/10.1097/00000658-198312000-00003
[37] Cersosimo E, Pisters PW, Pesola G, Rogatko A, Vydelingum NA, Bajorunas D, et al. The effect of graded doses of insulin on peripheral glucose uptake and lactate release in cancer cachexia. Surgery. 1991 Apr;109(4):459–67.
[38] Heslin MJ, Newman E, Wolf RF, Pisters PW, Brennan MF. Effect of systemic hyperinsulinemia in cancer patients. Cancer Res. 1992 Jul 15;52(14):3845–50.
[39] Agustsson T, Rydén M, Hoffstedt J, van Harmelen V, Dicker A, Laurencikiene J, et al. Mechanism of increased lipolysis in cancer cachexia. Cancer Res. 2007 Jun 1;67(11):5531–7. https://doi.org/10.1158/0008-5472.CAN-06-4585
[40] Heber D, Byerly LO, Chlebowski RT. Metabolic abnormalities in the cancer patient. Cancer. 1985 Apr 25;55(1 Suppl):225–9. https://doi.org/10.1002/1097-0142(19850101)
[41] Pisters PW, Cersosimo E, Rogatko A, Brennan MF. Insulin action on glucose and branched-chain amino acid metabolism in cancer cachexia: differential effects of insulin. Surgery. 1992 Apr 23;111(3):301–10.
[42] Eden E, Edström S, Bennegård K, Scherstén T, Lundholm K. Glucose flux in relation to energy expenditure in malnourished patients with and without cancer during periods of fasting and feeding. Cancer Res. 1984 Apr 25;44(4):1718–24.
[43] Heber D, Chlebowski RT, Ishibashi DE, Herrold JN, Block JB. Abnormalities in glucose and protein metabolism in noncachectic lung cancer patients. Cancer Res. 1982 Nov;42(11):4815–9.
[44] Norton JA, Maher M, Wesley R, White D, Brennan MF. Glucose intolerance in sarcoma patients. Cancer. 1984 Dec 15;54(12):3022–7. https://doi.org/10.1002/1097-0142(19841215)54:12<3022::aid-cncr2820541234>3.0.co;2-k
[45] Li C, Ford ES, McGuire LC, Mokdad AH, Little RR, Reaven GM. Trends in hyperinsulinemia among nondiabetic adults in the U.S. diabetes care. 2006 Nov 1;29(11):2396–402. https://doi.org/10.2337/dc06-0289
[46] Jasani B, Donaldson LJ, Ratcliffe JG, Sokhi GS. Mechanism of impaired glucose tolerance in patients with neoplasia. Br J Cancer. 1978 Aug;38(2):287–92. https://doi.org/10.1038/bjc.1978.200
[47] Lundholm K, Holm G, Scherstén T. Insulin resistance in patients with cancer. Cancer Res. 1978 Dec;38(12):4665–70.
[48] Tayek JA, Manglik S, Abemayor E. Insulin secretion, glucose production, and insulin sensitivity in underweight and normal-weight volunteers, and in underweight and normal-weight cancer patients: a clinical research center study. Metabolism. 1997 Feb;46(2):140–5. https://doi.org/10.1016/s0026-0495(97)90291-2
[49] Grace CJ, Swenne I, Kohn PG, Strain AJ, Milner RD. Protein-energy malnutrition induces changes in insulin sensitivity. Diabete Metab. 1990 Dec;16(6):484–91.
[50] Das SK, Eder S, Schauer S, Diwoky C, Temmel H, Guertl B, et al. Adipose triglyceride lipase contributes to cancer-associated cachexia. Science. 2011 Jul 8;333(6039):233–8. https://doi.org/10.1126/science.1198973
[51] Morigny P, Zuber J, Haid M, Kaltenecker D, Riols F, Lima JDC, et al. High levels of modified ceramides are a defining feature of murine and human cancer cachexia. J Cachexia Sarcopenia Muscle. 2020 Dec 8;11(6):1459–75. https://doi.org/10.1002/jcsm.12626
[52] Han X, Raun SH, Carlsson M, Sjøberg KA, Henriquez-Olguín C, Ali M, et al. Cancer causes metabolic perturbations associated with reduced insulin-stimulated glucose uptake in peripheral tissues and impaired muscle microvascular perfusion. Metabolism. 2020 Apr;105:154169. https://doi.org/10.1016/j.metabol.2020.154169
[53] Op den Kamp CM, Langen RC, Snepvangers FJ, de Theije CC, Schellekens JM, Laugs F, et al. Nuclear transcription factor κ B activation and protein turnover adaptations in skeletal muscle of patients with progressive stages of lung cancer cachexia. Am J Clin Nutr. 2013 Sep;98(3):738–48. https://doi.org/10.3945/ajcn.113.058388
[54] Yule MS, Thompson J, Leesahatsawat K, Sousa MS, Anker SD, Arends J, et al. Biomarker endpoints in cancer cachexia clinical trials: systematic review 5 of the cachexia endpoint series. J Cachexia Sarcopenia Muscle. 2024 Jun;15(3):853–67. https://doi.org/10.1002/jcsm.13491
[55] Ebhardt HA, Degen S, Tadini V, Schilb A, Johns N, Greig CA, et al. Comprehensive proteome analysis of human skeletal muscle in cachexia and sarcopenia: a pilot study. J Cachexia Sarcopenia Muscle. 2017 Aug 15;8(4):567–82. https://doi.org/10.1002/jcsm.12188
[56] Langer HT, Rohm M, Goncalves MD, Sylow L. AMPK as a mediator of tissue preservation: time for a shift in dogma? Nat Rev Endocrinol. 2024 Sep 17;20(9):526–40. https://doi.org/10.1038/s41574-024-00992-y
[57] Hébuterne X, Lemarié E, Michallet M, de Montreuil CB, Schneider SM, Goldwasser F. Prevalence of malnutrition and current use of nutrition support in patients with cancer. J Parenter Enteral Nutr. 2014 Feb 23;38(2):196–204. https://doi.org/10.1177/0148607113502674
[58] Tinsley-Vance SM, Mason TM, Komrokji RS. An integrative review of cancer-related cachexia and sarcopenia: a different focus in malignant hematology. Health Sci Rev. 2024 Dec;13:100205. https://doi.org/10.1016/j.hsr.2024.100205