REVIEW ARTICLE
Change in skeletal muscle mass during systemic cancer treatment: a systematic review and meta-analysis
Lukas Svendsena,b,c  , Sandra Jensend , Stine Hansend, Victor Sørensene , Christoffer Johansend,f , Charlotte Suettaf,g , Helle Pappotf,h , Casper Simonseni , Lars Hermann Tangj , Susanne Oksbjerg Daltona,b,c,f , Gunn Ammitzbølla,b,c* and Bolette Skjødt Rafnd,f*
aDepartment of Clinical Oncology & Palliative Care, Zealand University Hospital, Naestved, Denmark; bDanish Research Center for Equality in Cancer (COMPAS), Naestved, Denmark; cCancer Survivorship, Danish Cancer Institute, Copenhagen, Denmark; dDepartment of Oncology, Danish Cancer Society National Cancer Survivorship and Late Effects Research Center (CASTLE), Rigshospitalet, Copenhagen, Denmark; eMental Health Center Glostrup, Centre for Applied Research in Mental Health Care (CARMEN), University of Copenhagen, Copenhagen, Denmark; fInstitute of Clinical Medicine, Faculty of Health, University of Copenhagen, Copenhagen, Denmark; gGeriatric and Palliative Department, Copenhagen University Hospital, Bispebjerg and Frederiksberg Copenhagen, Denmark; hDepartment of Oncology, Rigshospitalet, University Hospital of Copenhagen, Copenhagen, Denmark; iCentre for Physical Activity Research, Rigshospitalet, Copenhagen, Denmark; jThe research and implementation unit PROgrez, Department of Physiotherapy and Occupational Therapy, Naestved-Slagelse-Ringsted Hospitals & The Department of Regional Health Research, University of Southern Denmark, Odense, Denmark
ABSTRACT
Background and purpose: Loss of skeletal muscle mass (SMM) is common during systemic cancer treatment, but the magnitude and variability across cancer and treatment types remain uncertain. We aimed to describe changes in SMM during systemic cancer treatment supported by pooled quantitative estimates.
Patients/material and methods: We systematically searched PubMed, Embase, and Web of Science until April 2025 for longitudinal studies reporting SMM during chemotherapy and/or immunotherapy (± targeted therapy) in patients with cancer (PROSPERO CRD42022308388). Standardized mean changes (SMC) were pooled in random-effects meta-analyses using the restricted maximum-likelihood estimator with Hartung–Knapp adjustment. Heterogeneity was assessed using I2. Risk of bias was assessed with the NIH Quality Assessment Tool for Observational Cohort and Cross-Sectional Studies.
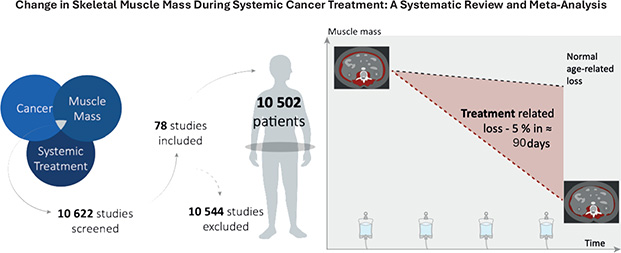
Results: Seventy-eight studies (n = 10,502; 52% male; median age 64 years [interquartile range, IQR: 34–77]) were included. Meta-analysis across cancers showed an association between systemic cancer treatment and decline in SMM (59 studies; n = 6,373; SMC = −0.24, 95% confidence interval [CI]: −0.29 to −0.20; I2 = 92%), corresponding to −5% over a median interval of 90 (IQR: 71–129) days among studies (62%) reporting assessment intervals. Declines were most pronounced during chemotherapy (± targeted therapy).
Interpretation: Declines in SMM are frequently observed during systemic cancer treatment, particularly during chemotherapy (± targeted therapy), although effect sizes were generally small per Cohen’s thresholds. However, substantial heterogeneity limits interpretation of a single pooled estimate. Prospective studies with standardized methods are needed to clarify trajectories, mechanisms and clinical implications of SMM loss.
KEYWORDS: Sarcopenia; skeletal muscle mass; neoplasms; drug therapy; meta-analysis
Citation: ACTA ONCOLOGICA 2026, VOL. 65, 493–510. https://doi.org/10.2340/1651-226X.2026.45726 .
Copyright: © 2026 The Author(s). Published by MJS Publishing on behalf of Acta Oncologica. This is an Open Access article distributed under the terms of the Creative Commons Attribution 4.0 International License (http://creativecommons.org/licenses/by/4.0/).
Received: 21 March 2026; Accepted: 7 May 2026; Published: 27 May 2026
CONTACT: Lukas Svendsen Lusv@regionsjaelland.dk Department of Clinical Oncology and Palliative Care, Zealand University Hospital, Rådmandsengen 5, Naestved, 4700, Denmark
Supplemental data for this article can be accessed online at https://doi.org/10.2340/1651-226X.2026.45726
*Shared last authorship.
Competing interests and funding: The authors report there are no competing interests to declare.
Introduction
With increasing cancer survival, clinical priorities have shifted from tumor control alone toward also preserving physical function and quality of life during treatment and survivorship [1]. Across cancer types, skeletal muscle mass (SMM) has emerged as a key determinant of these outcomes and a potent factor influencing treatment tolerance and prognosis [2, 3].
Low SMM, often termed sarcopenia [4], is present in approximately one-third of patients with cancer [5, 6] and has consistently demonstrated clinical relevance. Low SMM at time of diagnosis is associated with shorter overall survival [7–10], shorter progression-free survival [11], higher treatment-related toxicity [12], postoperative complications [13], and reduced quality of life and depression [14]. Collectively, these findings demonstrate that low SMM is an important prognostic biomarker that could be incorporated into clinical evaluations and research [15]. However, while the baseline SMM could be clinically useful, particularly in settings where longitudinal imaging is unavailable, emerging evidence shows that changes in SMM during systemic therapy offer additional and often stronger prognostic information across cancer types [16–19]. In a multicohort study including patients with advanced non-small cell lung cancer (n = 1,791), less SMM decline was associated with a 26–54% lower mortality risk (Hazard Ratio [HR]: 0.46–0.74) [20]. Similarly, SMM loss during treatment was associated with poorer overall survival as in colorectal (n = 67; ≥ 9% SMM loss, HR: 4.47, 95% confidence interval [CI]: 2.21–9.05) [21], biliary tract (n = 524; SMM loss; HR: 2.58, 95% CI: 1.86–3.58) [22] and pancreatic cancer (n = 127; ≥ 7.9% SMM loss; HR: 4.02, 95% CI: 1.87–8.97) [23]. Collectively, these findings suggest that while baseline SMM is informative, the trajectory of SMM during treatment captures prognostic information that is not evident from a single time point.
Despite this, existing studies are heterogeneous with respect to cancer populations, treatment regimens, measurement methods, and timing of assessments, which complicates direct comparison and limits the ability to derive a single, generalizable estimate of treatment-associated SMM change. The body of literature describing treatment-related SMM loss therefore remains insufficiently characterized in terms of its magnitude, timing, and variability across clinical contexts.
This study aimed to systematically describe changes in SMM during systemic cancer treatment supported by quantitative pooled estimates and to explore if changes vary across cancer types and treatment modalities by conducting a systematic review and meta-analysis of SMM changes during chemotherapy and/or immunotherapy (± targeted therapy).
Material and methods
This systematic review and meta-analysis was reported according to the Cochrane Handbook [24] and to the Preferred Reporting Items for Systematic Reviews and Meta-Analysis (PRISMA) guidelines [25] (Table S1). The protocol was pre-registered at PROSPERO (CRD42022308388).
Search strategy
An initial systematic literature search was performed in PubMed, Embase, and Web of Science on May 17, 2023. A subsequent updated search was conducted on April 11, 2025, to ensure identification of all relevant studies. The search combined controlled vocabulary terms and free-text keywords organized into three concept blocks: cancer, muscle mass or sarcopenia, and chemotherapy or immunotherapy. The complete search strategies for all databases are provided in Table S2.
Eligibility criteria
Studies were eligible if they were published in peer-reviewed journals, included adults with cancer receiving chemotherapy or immunotherapy between baseline and follow-up assessments of SMM or prevalence of low SMM, and reported absolute values at both timepoints. To be included in the meta-analysis, studies also had to provide corresponding measures of variability (e.g. standard deviation [SD] or range). Combination regimens with targeted agents were accepted; studies in which ≥ 10% of patients received targeted therapy were classified as chemotherapy + targeted therapy or immunotherapy + targeted therapy. Eligible studies were required to quantify SMM using an objective method – computed tomography (CT), magnetic resonance imaging (MRI), dual-energy X-ray absorptiometry (DXA), or bioelectrical impedance analysis (BIA). Studies involving surgery or radiotherapy between SMM assessments were excluded to isolate the effects of systemic therapy. Studies not obtainable in English or a Scandinavian language, or those involving structured physical exercise or nutritional interventions, were excluded. Complete inclusion and exclusion criteria are provided in Table S3.
Selection of studies
The selection of studies was performed using Covidence software. After duplicate removal, two independent reviewers (LS, SH, SJ, VS, GA, and BSR) screened titles and abstracts, followed by full-text assessment according to eligibility criteria. Disagreements were resolved through discussion or consultation with a third reviewer until consensus was reached. Interrater reliability between reviewers was assessed using Cohen’s kappa coefficient (κ), which ranges from 0 to 1, with values of 0.01–0.20 indicating slight, 0.21–0.40 fair, 0.41–0.60 moderate, 0.61–0.80 substantial, and 0.81–1.00 almost perfect agreement.
Data extraction
Data were extracted using a standardized Microsoft© Excel spreadsheet by two independent reviewers (LS, SH, SJ, VS, GA, and BSR). Disagreements were resolved through discussion or consultation with a third reviewer. When essential data were missing, two contact attempts by email were made to obtain additional information. The following data were extracted: author, year, study design, country, patient setting, sample size, sex, age, cancer type and stage, treatment regimen and number of cycles, SMM assessment method and anatomical site (e.g. skeletal muscle index [SMI] and area [SMA], pectoralis muscle area [PEMA], psoas muscle index [PMI] and area [PMA], and lumbar muscle volume [LMV]), time between assessments, outcome type and cut-off values, baseline and follow-up SMM, correlation coefficient between baseline and follow-up, low SMM prevalence, corresponding p-values and confidence intervals, data source, and funding.
Risk of bias
Risk of bias was assessed independently by at least two reviewers using the National Heart, Lung, and Blood Institute (NHLBI) Quality Assessment Tool for Observational Cohort and Cross-Sectional Studies [26]. Individual items were rated as ‘yes’, ‘no’, or ‘other’ (not reported, not applicable, or not determinable). An overall study rating was then assigned based on the proportion of criteria rated ‘yes’: ≥ 75% indicates good quality, 50–74% fair quality, and < 50% poor quality [27]. We tailored the risk-of-bias assessment to the specific objective of this review, which addressed within-patient changes in SMM rather than exposure–outcome associations. Therefore, items related to confounding (of the exposure-outcome association) were considered not applicable in terms of risk of bias relevant to the data we extracted for this review. Further, sample size justification was considered not applicable due to the retrospective population-based study designs, and loss to follow-up was not relevant due to availability of two measurements being an inclusion criterion for this review. However, we recognize that the study designs included in this review combined with inclusion criteria of two available SMM measurements carry considerable risk of bias, which we highlight in the discussion section.
Statistics
Random-effects meta-analyses were conducted using the restricted maximum-likelihood (REML) estimator with Hartung–Knapp adjustment. A random-effects model was chosen because substantial clinical and methodological heterogeneity was expected across cancer types, treatment regimens, and body composition assessment methods. Continuous outcomes were synthesized as standardized mean changes (SMC) with 95% confidence intervals (CI), relative to the baseline SD. Effect sizes were interpreted according to Cohen’s thresholds (0.2 = small, 0.5 = moderate, 0.8 = large). Because the standard error (SE) depends on the correlation between baseline and follow-up values, we calculated the mean correlation coefficient from studies that reported it and imputed this value to studies without available data. To assess robustness, sensitivity analyses were performed using correlation coefficients of 0.1, 0.5, and 0.9. Studies reporting medians with interquartile ranges (IQR) or ranges, means, and SDs were estimated using the method described by Wan and colleagues [28]. Between-study variance (τ2) was estimated using REML. Statistical heterogeneity was further quantified using I2, with thresholds of 0–40% (might not be important), 30–60% (may represent moderate heterogeneity), 50–90% (may represent substantial heterogeneity), and 75–100% (considerable heterogeneity). Potential sources of heterogeneity were explored through predefined subgroup analyses (cancer type, treatment type, treatment setting, assessment tool, and sex) followed by sensitivity analyses (estimated means, non-small trials, imputed correlation coefficient, and study design). Prediction intervals were calculated to illustrate the expected range of true effects in future comparable studies. Publication bias was assessed by visual inspection of funnel plots and with Egger’s test. Percentage change in SMM was calculated from reported baseline and follow-up values when not explicitly provided in the original studies, using the formula: percentage change = ((follow-up − baseline)/baseline) × 100. All analyses were conducted in R (version 4.4.1; RStudio version 2025.09.0, Posit Software) using the meta package.
Results
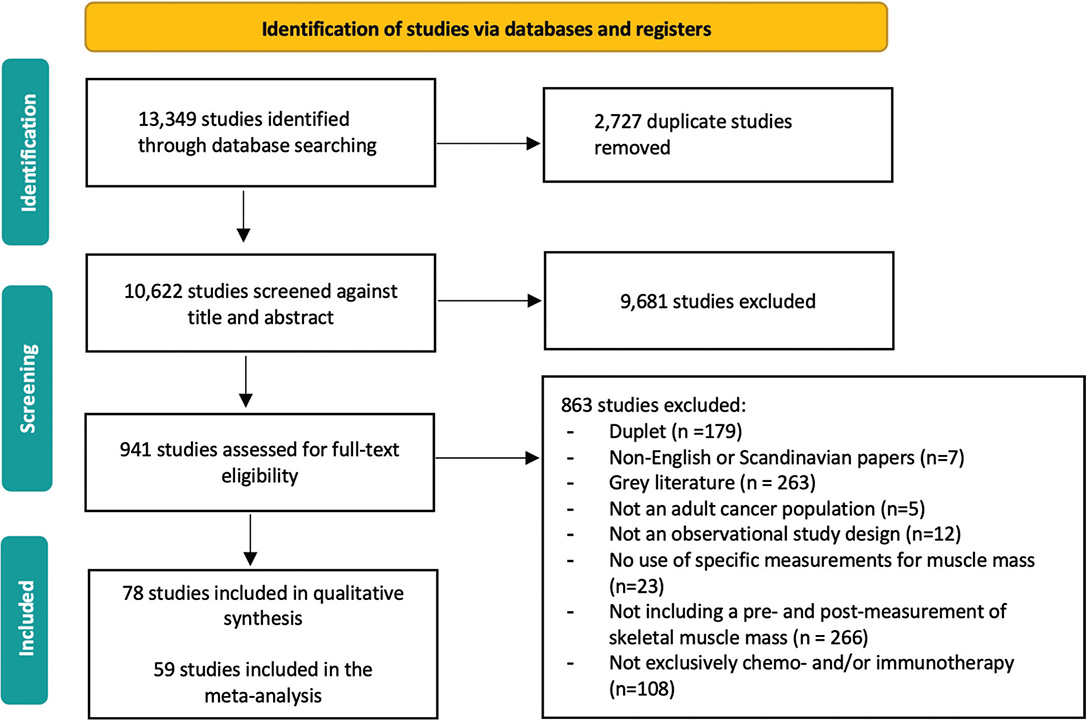
The search yielded 13,349 records. After removal of duplicates and exclusion of ineligible studies, 78 studies were included (Figure 1). Study characteristics are summarized in Table 1 and Table S4. Seventy-eight studies (n = 10,502; 52% male; median age 64 years, IQR: 34–77) were included. Most studies (n = 65, 83%) were retrospective cohorts, and publications spanned from 2007 to 2025, with 58 (74%) published between 2019 and 2025. Interrater reliability was moderate for title and abstract screening (Cohen’s κ = 0.43) and substantial for full-text screening (Cohen’s κ = 0.79). Most studies were of good methodological quality (median rating 91%) (Table S5).
| Author (year)/country | Study design | N (male/ female) | Age (± SD) or min-maxa | Cancer type | Cancer stage (TNM unless otherwise specified) | Setting | Planned treatment regimen | Cycle(s) | |
| Pancreatic cancer | |||||||||
| Chemotherapy | |||||||||
| Shimura (2023) [51]/Japan | Retro | 75 (40/35) | 67 (± 8) | Pancreatic cancer | UICC 8th stage: I: 17, II: 34, III: 7, IV: 16 |
Neo | Gemcitabine + S-1 | 1 | |
| Jin (2021) [52]/ China | Retro | 119 (59/60) | 60 (± 8) | Pancreatic cancer | NR | Neo | Nab-paclitaxel + gemcitabine; gemcitabine-based; FOLFIRINOX (multi-agent) | NR | |
| Griffin (2019) [53]/ Ireland | Retro | 78 (37/41) | 64 (± 8) | Pancreatic cancer | Tumor stage: I: 6, II:2, III:17, IV: 0 |
Neo | FOLFIRINOX; nab-paclitaxel + gemcitabine; gemcitabine monotherapy; gemcitabine + platinum | NR | |
| Lee (2024) [40]/ South Korea | Retro | 456 (272/184) | 61 (± 10) | Pancreatic cancer | Metastatic | Palliative | FOLFIRINOX or gemcitabine + nab-paclitaxel (multi-agent) | NR | |
| Rollins (2016) [54]/ UK | Retro | 98 (55/44) | 65 (± 9) | Pancreatic cancer | Locally advanced: 60, Metastatic: 38 | Palliative | Gemcitabine-based | NR | |
| Aberle (2025) [55]/Netherlands | Retro | 52 (31/21) | 64 (± 13) | Pancreatic cancer | Locally advanced: 27, Metastatic: 25 | NR | FOLFIRINOX (multi-agent) | 4 | |
| Davis (2025) [56]/ USA | Retro | 103 (58/45) | 68 (± 11) | Pancreatic cancer | I:5, II:35, III:15, IV:43 | NR | Single-agent irinotecan/gemcitabine/oxaliplatin/paclitaxel; combinations incl. gemcitabine + paclitaxel ± irinotecan/oxaliplatin | NR | |
| Uemura (2020) [23]/Japan | Retro | 69 (38/31) | 63 (38–74) | Pancreatic cancer | IV | NR | FOLFIRINOX (multi-agent) | Every 2 weeks | |
| Lee (2019) [41]/ South Korea | Retro | 57 (32/25) | 61 (38–78) | Pancreatic cancer | (first line) II:12, III:11, IV:34 |
NR | FOLFIRINOX (multi-agent) | 4 (3–6) | |
| Urological cancer | |||||||||
| Chemotherapy | |||||||||
| Miyake (2018) [57]/ Japan | Retro | 14 (12/2) | 73 (64–77) | Advanced urothelial cancer | Clinical T II:8, III:3, IV:3 |
Neo | Gemcitabine + cisplatin/carboplatin (GC/GCa, platinum-based) | 3 | |
| MacDonald (2024)/Canada [58] | Retro | 70 (59/11) | 65 (± 8) | Muscle-invasive bladder cancer | Clinical T cT1:9, cT2:50, cT3:6, cT4:5 | Neo | Gemcitabine + cisplatin (97%) or gemcitabine + carboplatin (3%) (platinum-based) | 2 | |
| Rimar (2018) [59]/ USA | Retro | 26 (19/7) | 67 (40–82) | Muscle-invasive bladder cancer | Clinical T T2:18, T3:8, N1:8 |
Neo | MVAC; gemcitabine + cisplatin; gemcitabine + carboplatin (platinum-based) | 3–5 | |
| Lyon (2019) [60]/ USA | Retro | 183 (155/28) | 65 (57–72) | Muscle-invasive bladder cancer | Clinical T II:98, III:54, IV:18 |
Neo | Gemcitabine + cisplatin (majority); MVAC or related regimens (platinum-based) | 4 (1–4) | |
| Takai (2021) [38]/ Japan | Retro | 44 (44/0) | 37 (19–80) | Testicular cancer | II:10, III:9, IV:18 | Adjuvant | BEP/EP; VIP/TIP/VeIP; GEMOX; other cisplatin-based regimens | 4 (1–14) | |
| Mitsui (2019) [61]/ Japan | Retro | 50 (50/0) | 34 (16–67) | Testicular cancer | Clinical S 0:1, I: 17, II :17, III: 8 |
NR | NR | 2–4 | |
| Semerad (2022) [62]/ Czhechia | Pro | 30 (30/0) | 37 (22–60) | Testicular cancer | I: 7, II: 9, III: 7 | NR | BEP (bleomycin, etoposide, cisplatin) (platinum-based) | 3 (2–4) | |
| Buxton (2024) [63]/ USA | Retro | 182 (182/0) | 31 (26–39) | Testicular cancer | Stage 1–IS:33; II–IIC:74; III–IIIC:71; Unknown:4 | NR | BEP, EP, VIP, or related cisplatin-based regimens | 3 | |
| Lung cancer and pleural mesothelioma | |||||||||
| Chemotherapy | |||||||||
| Goncalves (2018) [37]/USA | Retro | 88 (42/46) | 65 (55–71) | Non-Small Cell Lung cancer | I:12, II:15, III:58, IV:3 | Neo | Taxane- or gemcitabine-based; N = 7, 8% received bevacizumab |
2–6 | |
| Stene (2015) [64]/Norway | Pro | 35 (18/17) | 67 (± 7) | Non-Small Cell Lung cancer | IIIB: 6 IV: 29 |
Palliative | Carboplatin; vinorelbine; gemcitabine (platinum-based) | 1–3 | |
| Kazemi-Bajestani (2019) [65]/Canada | Pro | 50 (24/26) | 65 (± 8) | Non-Small Cell Lung cancer | IV | Palliative | Carboplatin doublets: with vinorelbine, gemcitabine, paclitaxel, or pemetrexed (platinum-based) | 1–4 | |
| Nattenmüller (2017) [66]/Germany | Retro | 200 (130/70) | 62 (± 10) | Non-Small Cell Lung cancer | UICC I:3, II:10, III: 43, IV: 144 |
NR | Carboplatin/cisplatin with gemcitabine, vinorelbine, etoposide, pemetrexed, or others (platinum-based) | 1–8 | |
| Kidd (2024) [67]/UK | Retro | 111 (91/20) | 69 (63–72) | Pleural mesothelioma | I:45, II:22, III:12, IV:19 | NR | Cisplatin or carboplatin with pemetrexed (platinum-based) | NR | |
| Kakinuma (2018) [35]/Japan | Retro | 44 (31/13) | 67 (± 8) | Non-Small Cell Lung cancer | IV | NR | (Only chemotherapy cohort) Carboplatin or cisplatin with pemetrexed, gemcitabine, paclitaxel/nab-paclitaxel | NR | |
| Immunotherapy | |||||||||
| Khan (2023) [68]/Australia | Retro | 97 (55/42) | 68 (± 10) | Non-Small Cell Lung cancer | III:15 IV:81 |
Palliative | Immune checkpoint inhibitors | NR | |
| Chemotherapy + immunotherapy | |||||||||
| Chaunzwa (2024) [20]/USA | Retro | 1,791 (913/878) | 65 (26–84) | Non-Small Cell Lung cancer | Advanced or metastatic | Palliative | Chemotherapy (SOC); chemo-immunotherapy; or immunotherapy monotherapy | NR | |
| Chemotherapy + targeted therapy | |||||||||
| Cortellini (2018) [69]/Italy | Retro | 81 (53/28) | 68 (39–90) | Non-Small Cell Lung cancer | IV | NR | Platinum doublets (pemetrexed, gemcitabine, paclitaxel + bevacizumab); or single agents (carboplatin, docetaxel, vinorelbine) (platinum-based) | NR | |
| Gastric, esophagogastric and esophageal cancers | |||||||||
| Chemotherapy | |||||||||
| Sato (2024) [70]/Japan | Pro | 50 (39/11) | 64 (38–75) | Locally advanced gastric cancer | cStage (14th) II:1, III:27, IV:22 |
Neo | Docetaxel + cisplatin + S-1 (DCS, platinum-based) | 2 | |
| Juez (2024) [71]/Spain | Retro | 61 (34/27) | 68 (± 9) | Locally advanced gastric cancer | AJCC I:10, II:30, III:21 |
Neo | FLOT (docetaxel, oxaliplatin, leucovorin, 5-FU) | 4 | |
| Li (2024) [17]/China | Retro | 345 (109/236) | 61 (± 12) | Advanced gastric cancer | II:189, III:156 | Neo | SOX (S-1 + oxaliplatin), XELOX (capecitabine + oxaliplatin), or FOLFOX (5-FU + leucovorin + oxaliplatin) | 4–6 | |
| Mirkin (2017) [72]/USA | Retro | 36 (13/23) | 65 (NR) | Advanced gastric cancer | NR | Neo | Epirubicin + cisplatin + 5-FU (epirubicin-based) | NR | |
| Matsuura (2020) [73]/Japan | Retro | 41 (28/13) | 72 (48–82) | Advanced gastric cancer | II:9, III:25, IV:7 | Neo | S-1 + cisplatin; S-1 + docetaxel + cisplatin; or S-1 + oxaliplatin (platinum-based) | 2 (1–4) | |
| Horii (2022) [74]/Japan | Retro | 38 (28/10) | 64 (44–78) | Advanced gastric cancer | Clinical stage (stage J) II: 18, III: 13: IV:7 |
Neo | DCS (S-1 + cisplatin + docetaxel), DS (S-1 + docetaxel), XP (capecitabine + cisplatin), SP (S-1 + cisplatin, platinum-based) | 2 | |
| Sugiyama (2018) [16]/Japan | Retro | 118 (69/48) | 64 (27–84) | Advanced gastric cancer | Metastatic | Palliative | Fluoropyrimidine + cisplatin; oxaliplatin (platinum-based) | NR | |
| Park (2020) [39]/Korea | Retro | 111 (80/31) | 65 (31–87) | Advanced gastric cancer | IV | Palliative | S-1 + cisplatin; XP; FOLFOX/XELOX; S-1 or capecitabine alone; N = 11, 9.9% received trastuzumab + XP |
NR | |
| Palmela (2017) [75]/Portugal | Retro | 47 (32/15) | 68 (± 10) | Esophagogastric cancer | III:5, IV:42 | Neo | ECF, EOF, EOX, ECX, XELOX, FOLFOX, capecitabine, or DCF | 2 | |
| den Boer (2020) [76]/ NR | Retro | 199 (158/41) | 66 (28–80) | Esophagogastric cancer | Clinical T T1:1, T2:62, T3:107, T4: 28 | Neo | ECX, CX, or related platinum–fluoropyrimidine regimens | 1–4 | |
| Rinninella (2021) [77]/Italy | Retro | 26 (18/8) | 63 (± 11) | Esophagogastric cancer | Pathologic stage: 0: 0, 1: 4, 2: 5, 3: 6, 4: 9, missing: 2 |
Neo | FLOT (perioperative regimen) | 4 | |
| Fujihata (2021) [78]/Japan | Retro | 99 (89/10) | 68 (61–72) | Esophagogastric cancer | Pathologic stage 0:3, I:12, II:41, III:43 | Neo | 5-FU + cisplatin (FP) or docetaxel + cisplatin + 5-FU (DCF, platinum-based) | 1–2 | |
| Dijksterhuis (2019) [79]/Netherlands | Retro | 88 (66/22) | 63 (56–69) | Esophagogastric cancer | Metastatic | Palliative | Capecitabine + oxaliplatin (CAPOX, platinum-based) | 1–6 | |
| Hacker (2022) [80]/Germany | Pro | 509 (387/122) | < 65: 375 ≥ 65: 134 |
Esophagogastric cancer | Metastatic | Palliative | Platinum–fluoropyrimidine chemotherapy (platinum-based) | NR | |
| Awad (2012) [81]/ UK | Retro | 47 (34/17) | 63 (± 12) | Esophagogastric cancer | T3 N0/1: 23, T2 N0/1: 10, T3 N2/3: 5, T1 N0: 5, T4 N1: 1, Tis N0: 1, No residual tumor: 2 | Neo | Epirubicin + cisplatin + 5-FU; cisplatin + 5-FU; capecitabine + cisplatin; epirubicin + oxaliplatin | 1–4 | |
| Onishi (2024) [82]/ Japan | Retro | 215 (178/37) | 67 (40–81) | Esophageal cancer | DCF: II:11, III:58; CF: II:80, III:66 | Neo | Docetaxel + cisplatin + 5-FU (DCF) or cisplatin + 5-FU (CF, platinum-based) | 2–3 | |
| Harada (2025) [83]/Japan | Retro | 69 (53/16) | 73 (4) | Esophageal cancer | Clinical stage IB, II, III, or IV without distant organ metastasis | Neo | Cisplatin + 5-FU (FP), FOLFOX, or DCF (platinum-based) | 2–4 | |
| Yip (2014) [84]/ UK | Retro | 35 (30/5) | 63 (34–78) | Esophageal cancer | II:10, III:23, IV:2. | Neo | ECF/ECX (epirubicin, cisplatin, 5-FU/capecitabine) (platinum-based) | 3 (1–6) | |
| Miyata (2017) [85]/ Japan | Retro | 94 (76/18) | 64 (± 9) | Esophageal cancer | I:5, II:24, III:54, IV:11 | Neo | Adriamycin + cisplatin + 5-FU (ACF) or docetaxel + cisplatin + 5-FU (DCF, platinum-based) | 2 (1–3) | |
| Ishida (2019) [86]/Japan | Retro | 165 (144/21) | 65 (NR) | Esophageal cancer | Clinical T I+II:14; III+IV:29 | Neo | DCF vs. ACF (platinum-based) | 2 | |
| Chemotherapy + immunotherapy | |||||||||
| Zhao (2024) [87]/China | Retro | 85 (69/16) | 67 (59–71) | Esophageal cancer | II:37, III:40, IV:8 | Neo | PD-1 inhibitor (camrelizumab) + platinum + paclitaxel (platinum-based) | 2–4 | |
| Ying (2025) [88]/China | Retro | 83 (81/2) | 68 (49–87) | Esophageal cancer | Lymph node metastasis: 98% Distant metastasis: 37% |
NR | PD-1 inhibitor + chemotherapy | NR | |
| Ovarian cancer | |||||||||
| Chemotherapy | |||||||||
| Wood (2023) [89]/USA | Retro | 174 (0/174) | 64 (± 10) | Ovarian cancer | II:1, III:108, IV:65 | Neo | NR | NR | |
| Ubachs (2020) [90]/Netherlands | Retro | 212 (0/212) | 61 (± 8) | Ovarian cancer | FIGO III:212 |
Neo | Carboplatin + paclitaxel. | 2 | |
| Yoshino (2020) [91]/Japan | Retro | 60 (0/60) | 64 (43–81) | Ovarian cancer | FIGO III:36, IV:24 |
Neo | Carboplatin + paclitaxel/docetaxel/irinotecan (platinum-based) | 4 (2–6) | |
| Del Grande (2021) [92]/Switzerland | Retro | 25 (0/25) | 65 (± 11) | Ovarian cancer | FIGO I: 1, II:3, III:45, IV:20. |
Neo | Platinum-based | NR | |
| Van der Zanden (2021) [93]/Netherlands | Retro | 111 (0/111) | 77 (74–79) | Ovarian cancer | FIGO III:73, IV:38 |
Neo | Platinum-based | 2 | |
| Studies including multiple cohorts with multiple cancers | |||||||||
| Chemotherapy | |||||||||
| Toama (2022) [94]/ USA | Retro | 474 (161/313) | 61 (53–68) | Breast cancer (n = 192) Lymphoma (n = 184) Sarcoma (n = 98) |
I:49, II:73, III:84, IV:234, Missing: 34 | NR | Anthracycline-based chemotherapy | NR | |
| Immunotherapy | |||||||||
| Loosen (2021) [19]/Germany | Pro | 88 (48/42) | 67 (34–87) | Lung: 39.8% Malignant melanoma: 15.9% Urothelial cancer: 13.6% GI cancer: 13.6% Head and neck cancer: 8.0% Others: 9.1% |
UICC III: 7%, UICC IV: 93% | NR | Nivolumab, pembrolizumab, nivolumab + ipilimumab, or others | NR | |
| Chemotherapy + immunotherapy | |||||||||
| Roeland (2021) [95]/USA | Pro | 38 (20/18) | 62 (± 2) | Gastrointestinal: 71% Lung: 13% Gynecologic: 8% Head and neck: 8% Other: 5% |
Metastatic | NR | NR | NR | |
| Chemotherapy + targeted therapy | |||||||||
| Oflazoglu (2020) [96]/Turkey | Pro | 276 (122/154) | 57 (± 11) | Breast: 33.7% Colorectal: 26.8% Pancreaticobiliary: 10.9% Urological: 8.7% Gastroesophageal: 7.6% Lung: 3.6% Head and neck: 2.5% Others: 6.2% |
Metastasis status: No: 229 Yes: 47 |
NR | Site-specific regimens: breast (AC + paclitaxel ± trastuzumab), colorectal (XELOX, FOLFOX ± bevacizumab/panitumumab, capecitabine), pancreaticobiliary (cisplatin-based, gemcitabine, FOLFIRINOX), urological (platinum-based), gastroesophageal (cisplatin-based, XELOX), lung (cisplatin-based, carboplatin + paclitaxel), head & neck (cisplatin-based), others | NR | |
| Melanoma | |||||||||
| Immunotherapy | |||||||||
| Daly (2017) [97]/Ireland | Retro | 84 (52/32) | 54 (43–66) | Melanoma | M1a: 9, M1b: 9 , M1c: 66 | NR | Ipilimumab (CTLA-4 inhibitor) | 4 | |
| Liver cancer | |||||||||
| Immunotherapy | |||||||||
| Chen (2025) [98]/China | Retro | 85 (68/17) | 62 (± 12) | Intermediate and advanced liver cancer | Child-Pugh score: A: 48, B: 31, C: 6 |
NR | PD-1 inhibitors (sintilimab, tislelizumab, camrelizumab, pembrolizumab) or PD-L1 inhibitors (atezolizumab, durvalumab) | NR | |
| Immunotherapy + targeted therapy | |||||||||
| Shigefuku (2024) [99]/Japan (ATZ-BEV) | Retro | 56 (45/11) | 74 (69–80) | Advanced liver cancer | Child–Pugh score: 5: 52, 6: 37, 7: 7, 8: 1 |
NR | Atezolizumab + bevacizumab | NR | |
| Colorectal cancer | |||||||||
| Chemotherapy | |||||||||
| Okuno (2019) [100]/USA | Retro | 169 (97/72) | 56 (± 12) | Colorectal cancer | NR | Neo | Oxaliplatin-based; irinotecan-based; multiple regimens (platinum-based) | 6 (2–24) | |
| Chemotherapy + targeted therapy | |||||||||
| Nozawa (2021) [101]/Japan | Retro | 98 (58/40) | 65 (28–88) | Colorectal cancer | IV | Neo Conversion Palliative |
FOLFOX; CAPOX; SOX; FOLFIRI; FOLFOXIRI; IRIS (platinum- or irinotecan-based ± targeted) | NR | |
| Palle (2016) [102]/Denmark | Pro | 18 (10/8) | 67 (± 6) | Colorectal cancer | Patients with tumor stage T3–4, N0–N1 and/or V0–V1. | Adjuvant | Capecitabine; capecitabine + oxaliplatin; capecitabine + oxaliplatin + bevacizumab (platinum-based) | 1–8 | |
| Huemer (2019) [103]/Austria | Retro | 10 (6/4) | 65 (42–81) | Colorectal cancer | Metastatic | NR | TAS-102 (trifluridine/tipiracil); regorafenib | NR | |
| Blauwhoff-Buskermolen (2016) [21]/Netherlands | Pro | 67 (42/25) | 66 (± 11) | Colorectal cancer | Metastatic | Palliative | CAPOX ± bevacizumab; FU + oxaliplatin ± bevacizumab; capecitabine + irinotecan; irinotecan monotherapy; capecitabine ± bevacizumab (platinum-based) | NR | |
| Gallois 2021 [104]/France | Pro | 149 (82/67) | 70 (NR) | Colorectal cancer | Metastatic | NR | 5-FU-based regimens: oxaliplatin-based; irinotecan-based; single agent; doublet; triplet; ± bevacizumab; ± cetuximab/panitumumab (platinum/irinotecan-based) | NR | |
| Breast cancer | |||||||||
| Chemotherapy | |||||||||
| Jang (2022) [105] (AC-T)/South Korea | Retro | 214 (0/214) | 53 (± 11) | Breast cancer | I:3, II:153, III:51 | Neo | Anthracycline–cyclophosphamide → taxane (AC-T) | 6 | |
| Campbell (2007) [106]/Canada | Pro | 10 (0/10) | 47 (± 6) | Breast cancer | I: 2, II-IIIA: 8 | Adjuvant | CEF or AC (anthracycline-based) | 5 | |
| Jung (2020) [107]/South Korea | Pro | 37 (0/37) | 51 (± 9) | Breast cancer | I:13, II:22, III:2 | Adjuvant | AC or TC (docetaxel + cyclophosphamide) | NR | |
| Chemotherapy + immunotherapy (+ targeted therapy) | |||||||||
| Camilleri (2024) [108]/France | Retro | 111 (0/111) | 60 (12) | Breast Cancer | Metastatic | Palliative | Not otherwise specified | NR | |
| Chemotherapy + targeted therapy | |||||||||
| Zhang (2024) [109]/China | Retro | 43 (0/43) | 51 (± 10) | Breast cancer | II-III | Neo | Taxanes and anthracyclines. HER2-positive received targeted therapy with trastuzumab and pertuzumab. | 6–8 | |
| Rossi (2023) [110]/Italy | Retro | 52 (0/52) | 37 (± 5) | Breast cancer | NR | Neo | Epirubicin + cyclophosphamide (EC) → paclitaxel; some with carboplatin + paclitaxel; HER2+ with trastuzumab | 4 | |
| Karaca (2024) [111]/Turkey | Retro | 226 (0/226) | 50 (± 12) | Breast cancer | II–III | Neo | Anthracycline–cyclophosphamide → paclitaxel/docetaxel; HER2+ with trastuzumab/pertuzumab | NR | |
| Amitani (2022) [18]/Japan | Retro | 141 (0/141) | 53 (± 10) | Breast cancer | II:89, III:52 | Neo | FEC/EC → taxane (docetaxel or paclitaxel); HER2+ with trastuzumab | 4 | |
| Lee (2021) [112]/ South Korea | Retro | 246 (0/246) | 48 (42–54) | Breast cancer | I:9, II:123, III:114 | Neo | AC ± paclitaxel; subset with trastuzumab | NR | |
| Rossi (2020) [113]/ Italy | Retro | 101 (0/21) | 56 (± 11) | Breast cancer | NR | Neo | EC → paclitaxel; subset with pertuzumab + trastuzumab | 4–6 | |
| Mazzuca (2018) [114]/ Italy | Retro | 21 (0/21) | 54 (39–72) | Breast cancer | I:7, II:11, III:3 | Adjuvant | FEC/EC; EC + taxane; ~43% with trastuzumab | 4 | |
| Lymphoma | |||||||||
| Chemotherapy + targeted therapy | |||||||||
| Xiao (2016) [115]/ USA | Retro | 342 (331/11) | 63 (± 11) | Diffuse large B-cell lymphoma | Clinical stage I+II:145; III+IV:195, 2: missing | NR | CHOP (cyclophosphamide, doxorubicin, vincristine, prednisone) ± rituximab (R-CHOP) | NR | |
| TNM: Tumor, Node, and Metastasis; N: number of participants at baseline; SD: standard deviation; NR: not reported; Neo: neoadjuvant treatment; Adjuvant: adjuvant chemotherapy; Retro: Retrospective cohort; Pro: prospective cohort. arounded to the nearest whole number. | |||||||||
Across cancer types, systemic treatment with chemotherapy and/or immunotherapy (± targeted therapy) was associated with a decline in SMM (59 studies; n = 6,373; SMC = –0.24, 95% CI: –0.29 to –0.20; I2 = 92%), corresponding to an unweighted median of −5% (IQR: −7 to −2) over a median interval of 90 (IQR: 71–129) days. A total of 30 (38%) studies did not report the interval between SMM assessments. The 95% prediction interval (–0.56 to 0.08) indicated between-study variability in the magnitude and direction of effects (Figure 2 and Table 2). Most studies (n = 70, 89%) assessed SMM using CT imaging, predominantly at the third lumbar vertebra (L3) (n = 63, 73%). The SMI was the most common outcome measure, reported in 51 (65%) studies. Assessment methods and outcomes are presented in Table 3. No evidence of publication bias was identified by Egger’s test (p = 0.229) or visual inspection of the funnel plot (Figure S1). Among the five studies [28–32] reporting the correlation coefficient between repeated measurements, the mean correlation was 0.88. Sensitivity analyses using assumed correlations of 0.1, 0.5, and 0.9 yielded nearly identical pooled estimates, with only slight increases in SE.
| Meta-analyses | N | SMC (95% CI) | Comparisons | I2 | P | ||
| Primary analysis | 6,373 | −0.24 (−0.29 to −0.20) | 59 [16–19, 21, 23, 35, 37–41, 53, 54, 56–59, 61–63, 65–68, 71,, 73–83, 85–87, 89–91, 93–95, 97, 98, 100, 104–111, 114] | 92% | - | ||
| Subgroup analysesa | |||||||
| Treatment type | |||||||
| Chemotherapy | 5,169 | −0.27 (−0.32 to −0.22) | 45 [16, 17, 23, 35, 37–41, 53, 54, 56–59, 61–63, 65–67, 71, 73–83, 85, 86, 89–91, 93, 94, 100, 105–107] | 92% | - | ||
| IO | 287 | −0.15 (−0.30 to 0.01) | 4 [19, 68, 97, 98] | 63% | - | ||
| Chemo-IO | 234 | −0.05 (−0.13 to 0.04) | 3 [87, 95, 108] | 0% | - | ||
| Chemo-TT | 683 | −0.23 (−0.38 to −0.08) | 7 [18, 21, 104, 109–111, 114] | 91% | - | ||
| Treatment setting | |||||||
| Neoadjuvant | 3,321 | −0.22 (−0.28 to −0.17) | 32 [17, 18, 23, 37, 53, 56–59, 71, 73–78, 81–83, 85–87, 89–91, 93, 100, 105, 109–111] | 90% | - | ||
| Adjuvant | 102 | −0.14 (−0.61 to 0.33) | 4 [38, 106, 107, 114] | 91% | - | ||
| Palliative | 1,393 | −0.31 (−0.47 to −0.16) | 10 (21, 39–41, 54, 65, 68, 79, 80, 108) | 95% | - | ||
| Not reported | 1,557 | −0.25 (−0.34 to −0.17) | 13 [16, 19, 35, 61–63, 66, 67, 94, 95, 97, 98, 104] | 86% | - | ||
| Assessment tool | |||||||
| CT SMI (cm/m2) | 4,670 | −0.23 (−0.29 to −0.18) | 39 [16–19, 23, 35, 38–40, 53, 54, 56–59, 63, 66–68, 71, 75–80, 82, 83, 87, 89, 90, 93, 98, 100, 104, 105, 108, 114] | 92% | - | ||
| CT SMA (cm2) | 424 | −0.25 (−0.42 to −0.08) | 8 [21, 41, 61, 65, 81, 91, 95, 97] | 89% | - | ||
| CT PMI (cm/m2) | 718 | −0.27 (−0.49 to −0.05) | 4 [73, 74, 86, 94] | 93% | - | ||
| CT PMA (cm2) | 269 | −0.40 (−0.66 to −0.15) | 2 [109, 111] | 0% | |||
| BIA (kg) | 154 | −0.09 (−0.49 to 0.29) | 3 [62, 85, 107] | 67% | - | ||
| Sensitivity analyses | |||||||
| Estimated meansb | 3,968 | −0.22 (−0.27 to −0.17) | 40 [16, 18, 21, 23, 35, 38, 53, 54, 56, 58, 59, 62, 65, 66, 68, 75–77, 79–83, 85, 86, 89, 90, 95, 97, 98, 100, 104–111] | 88% | - | ||
| Non-small trialsc | 2,286 | −0.24 (−0.32 to −0.16) | 20 [16–18, 39, 40, 63, 66, 76, 80, 82, 86, 89, 90, 93, 94, 100, 104, 105, 108, 111) | 96% | - | ||
| Correlation coefficient estimationd | 6,373 | −0.25 (−0.29 to −0.20) | 59 [16–19, 21, 23, 35, 37–41, 53, 54, 56–59, 61–63, 65–68, 71, 73–83, 85–87, 89–91, 93–95, 97, 98, 100, 104–111, 114] | 72% | - | ||
| Prospective study design | 917 | −0.18 (−0.27 to −0.09) | 9 [19, 21, 62, 65, 80, 95, 104, 106, 107] | 61% | - | ||
| By sex (male) | 438 | −0.21 (−0.42 to −0.01) | 8 [16, 21, 39, 55, 79, 101, 102, 104] | 92% | |||
| By sex (female) | 263 | −0.40 (−0.69 to −0.12) | 8 [16, 21, 39, 55, 79, 101, 102, 104] | 93% | |||
| Funnel plot asymmetry | 0.229 | ||||||
| N: number with complete data; SMC: standardized mean change; CI: confidence interval; I2, heterogeneity; Chemo: chemotherapy; TT: targeted therapy; IO: immunotherapy; Multiple: studies combining multiple diagnoses; CT: computed tomography; CM: centimeter; SMI: Skeletal Muscle Index; SMA: Skeletal Muscle Area; PMI: Psoas (or Pectoralis) Muscle Index; PMA: Psoas (or Pectoralis) Muscle Area; BIA: bioimpedance analysis; Kg.: kilograms. aOnly subgroups with ≥ 2 studies are presented. bEstimated means: Sensitivity analysis excluding studies where means and SDs were derived from medians/IQRs using Wan et al.’s method. cNon-small studies: Sensitivity analysis excluding studies with n ≤ 100. dCorrelation coefficient estimation: Sensitivity analysis with imputed correlation coefficient (r = 0.5). |
|||||||
| Author (year)* | Assessment method | Outcome measure | Body segment | Days between measurements | Pre-treatment muscle mass | Post-treatment muscle mass | Change mean or median | Change % | P | ||
| Mean or Median | SD or min–max | Mean or median | SD or min–max | ||||||||
| Pancreatic cancer | |||||||||||
| Chemotherapy | |||||||||||
| Shimura (2023) [51] | CT | SMI | L3 | NR | M: 45.70 F: 35.70 |
M: 9.70 F: 5.70 |
M: 41.10 F: 34.90 |
M: 8.80 F: 6.10 |
NR | −10.07%** −2.24%** |
M: < 0.01 F: 0.153 |
| Griffin (2019) [53] | CT | SMI | L3 | 128 | 45.60 | 8.70 | 42.30 | 9.30 | NR | −7.24%** | < 0.01 |
| Lee (2024) [40] | CT | SMI | L3 | 60 | 43.10 | 39.10–49.90 | 40.10 | 35.90–45.00 | NR | −6.96%** | < 0.01 |
| Rollins (2016) [54] | CT | SMI | L3 | 60 | 42.20 | 8.60 | 39.80 | 8.00 | NR | −5.69%** | 0.060 |
| Aberle (2025) [55] | CT | SMI | L3 | 90 | M: 49.10 F: 39.20 |
M: 8.80 F: 4.70 |
M: 45.90 F: 35.50 |
M: 8.70 F: 4.20 |
M: −2.20 F: −3.50 |
−6.52%** −9.44%** |
M: 0.002 F: 0.001 |
| Davis (2025) [56] | CT | SMI | L3 | 71.50 | 46.60 | 7.65 | 46.00 | 7.94 | −0.90 | −1.29%** | NR |
| Uemura (2020) [23] | CT | SMI | L3 | 71 | 40.20 | 7.30 | 36.30 | 6.30 | NR | −7.90% | NR |
| Lee (2019) [41] | CT | SMM | L3 | 60 | 100.40 | 20.30 | 86.40 | 20.20 | NR | −13.94%** | < 0.001 |
| Urological cancer | |||||||||||
| Chemotherapy | |||||||||||
| Miyake (2018) [57] | CT | SMI | L3 | NR | 53.70 | 48.80–58.00 | 52.80 | 48.80–55.20 | NR | −1.68%** | 0.016 |
| MacDonald (2024) [58] | CT | SMI | L3 | 69 | 52.40 | 10.80 | 50.10 | 10.10 | −2.2 (± 3.2) | −4.39%** | < 0.001 |
| Rimar (2018) [59] | CT | SMI | L3 | 110 | 49.10 | NR | 44.50 | NR | NR | −6.40% | < 0.01 |
| Lyon (2019) [60] | CT | SMI | L3 | 139 | 50.70 | NR | 48.60 | NR | NR | −4.14%** | NR |
| Takai (2021) [38] | CT | SMI | L3 | 182 | 51.60 | 28.60–70.60 | 45.60 | 32.40–60.60 | NR | −11.63%** | NR |
| Mitsui (2018) [61] | CT | SMA | L3 | 21 | 150.20 | 76.30–206.90 | 140.50 | 73.40–200.70 | NR | −8.50% | NR |
| Semerad (2022) [62] | BIA | SMM kg | Whole body | NR | 32.67 | 4.59 | 31.34 | 4.65 | NR | −1.33%** | 0.005 |
| Buxton (2024) [63] | CT | SMI | L3 | 114 | 57.50 | 52.50–62.90 | 55.00 | 49.30–60.70 | −3.60 (−6.50 to 0.40) |
−6.10% | < 0.001 |
| Lung cancer and pleural mesothelioma | |||||||||||
| Chemotherapy | |||||||||||
| Goncalves (2018) [37] | CT | LMV | T10–L1 | NR | 296.50 | 249.00–369.00 | 283.00 | 241.00–337.00 | NR | −4.39% | NR |
| Stene (2015) [64] | CT | SMA | L3 | 88 | 121.90 | 30.80 | 117.40 | NR | NR | −3.69%** | < 0.01 |
| Kazemi−Bajestani (2019) [65] | CT | SMA | L3 | 112 | 130.50 | 36.00 | 120.90 | 29.70 | NR | −8.90% | < 0.01 |
| Nattenmüller (2017) [66] | CT | SMI | L2–L3 | 129 | 45.70 | 8.70 | 44.30 | 8.60 | NR | −3.06%** | < 0.01 |
| Kidd (2024) [67] | CT | SMI | L3 | NR | 50.50 | 44.00–57.80 | 47.00 | 42.00–57.00 | NR | −6.93%** | < 0.01 |
| Kakinuma (2018) [35] | CT | SMI | L3 | 132 | 44.80 | 7.30 | 40.40 | 6.60 | NR | −9.82%** | NR |
| Immunotherapy | |||||||||||
| Khan (2023) [68] | CT | SMI | L3 | NR | 43.80 | 8.50 | 43.70 | 9.40 | −0.10 | −0.23%** | NR |
| Gastric, esophagogastric and esophageal cancers | |||||||||||
| Chemotherapy | |||||||||||
| Sato (2024) [70] | CT | SMI | L3 | NR | 47.90 | NR | 44.10 | NR | NR | −3.40% | NR |
| Juez (2024) [71] | CT | SMI | L3 | NR | 46.69 | 40.10–55.20 | 45.52 | 39.00–51.00 | NR | −2.57% | < 0.01 |
| Li (2024) [17] | CT | SMI | L3 | NR | 40.40 | 32.10–44.20 | 39.60 | 30.50–43.10 | −1,3 | −2.60% | < 0.01 |
| Matsuura (2020) [73] | CT | PMI | L3 | NR | 4.77 | 1.11 | 4.50 | 1.20 | NR | −5.93% | < 0.01 |
| Horii (2022) [74] | CT | PMI | Umbilicus level | 60 | 6.57* | 3.84–9.74 | 6.21* | 3.30–8.89 | NR | −5.48%** | < 0.01 |
| Sugiyama (2018) [16] | CT | SMI | L3 | 429 | 39.00 | 8.02 | 36.40 | 8.05 | NR | −7.00% | < 0.01 |
| Park (2020) [39] | CT | SMI | L3 | NR | 40.70 | 9.00 | 35.30 | 8.30 | NR | −11.30% | < 0.01 |
| Palmela (2017) [75] | CT | SMI | L3 | 86.40 | 48.20 | 9.60 | 45.30 | 9.50 | NR | −6.02%** | < 0.01 |
| Boer (2020) [76] | CT | SMI | L3 | 105 | 51.87 | 10.31 | 49.19 | 9.71 | NR | −5.17%** | < 0.01 |
| Rinninella (2021) [77] | CT | SMI | L3 | 95.50 | 48.74 | 9.76 | 46.52 | 9.80 | NR | −4.55%** | < 0.01 |
| Fujihata (2021) [78] | CT | SMI | L3 | NR | 40.66 | 36.3–46.61 | 39.33 | 35.70–46.13 | NR | −1.87% | NR |
| Dijksterhuis (2019) [79] | CT | SMI | L3 | 79.00 | 46.90 | 9.90 | 44.40 | 10.00 | NR | −5.33%** | < 0.01 |
| Hacker (2022) [80] | CT | SMI | L3 | 84 | 61.62 | 9.44 | 59.2 | NR | NR | −3.93%** | NR |
| Awad (2012) [81] | CT | SMA | L3 | 107 | 140.00 | 31.70 | 130.50 | 28.00 | NR | −6.79%** | < 0.01 |
| Onishi (2024) [82] (DCF treatment) |
CT | SMI | L3 | NR | 41.50 | 7.60 | 40.30 | 7.20 | NR | −2.40% | NR |
| Onishi (2024) [82] (CF treatment) |
CT | SMI | L3 | NR | 40.40 | 8.30 | 38.40 | 7.50 | NR | −4.40% | NR |
| Harada (2025) [83] | CT | SMI | L3 | NR | 43.10 | 7.80 | 40.90 | 7.60 | NR | −5.10%** | < 0.01 |
| Miyata (2017) [85] | BIA | SMM | Whole body | 77 | 25.00 | 4.80 | 24.90 | 4.80 | NR | −0.40%** | NR |
| Ishida (2019) [86] | CT | PMI | L3 | NR | 7.17 | 2.01 | 6.97 | 1.86 | NR | −2.79%** | < 0.01 |
| Chemotherapy + immunotherapy | |||||||||||
| Zhao (2024) [87] | CT | SMI | L3 | NR | 45.10 | 42.25–49.70 | 44.80 | 42.17–48.83 | −0.12 | −0.67%** | 0.146 |
| Ying (2025) [88] | CT | SMI | L3 | NR | 69.20 | NR | 65.40 | NR | NR | −5.50%** | NR |
| Ovarian cancer | |||||||||||
| Chemotherapy | |||||||||||
| Wood (2023) [89] | CT | SMI | L4 | 93 | 38.30 | 7.90 | 37.80 | 7.90 | NR | −1.31%** | NR |
| Ubachs (2020) [90] | CT | SMI | L3 | 60 | 39.60 | 5.40 | 38.10 | 5.00 | NR | −5.90% | NR |
| Yoshino (2020) [91] | CT | SMA | L3 | NR | 87.20 | 52.50–129.00 | 83.40 | 59.20–122.00 | NR | −4.36%** | 0.019 |
| Del Grande (2021) [92] | CT | SMI | L3 | NR | 48.00 | 8.90 | 45.00 | 68.10 | NR | −6.25%** | 0.052 |
| Van der Zanden (2021) [93] | CT | SMI | L3 | 66 | 39.10 | 36.30–43.10 | 37.20 | 34.70–40.50 | NR | −6.00% | 0.001 |
| Studies including multiple diagnoses | |||||||||||
| Chemotherapy | |||||||||||
| Toama (2022) [94] | CT | PMI | T2–T3 | NR | 5.80 | 4.90–7.70 | 5.20 | 4.40–6.40 | NR | −10.50% | NR |
| Immunotherapy | |||||||||||
| Loosen (2021) [19] | CT | SMI | L3 | 84 | 76.79 | 46.00–124.90 | 74.02 | 44.20–113.50 | NR | −3.61%** | NR |
| Chemotherapy + immunotherapy | |||||||||||
| Roeland (2021) [95] | CT | SMA | NR | 90 | 132.10 | 35.90 | 132.80 | 36.30 | NR | +0.53%** | 0.648 |
| Melanoma | |||||||||||
| Immunotherapy | |||||||||||
| Daly (2017) [97] | CT | SMA | L3 | 146 | 151.30 | 37.20 | 144.20 | 37.30 | NR | −4.69%** | NR |
| Liver cancer | |||||||||||
| Immunotherapy | |||||||||||
| Chen (2025) [98] | CT | SMI | L3 | 90 | 42.84 | 7.87 | 41.63 | 8.11 | −1.21 (± 3.72) | −2.82%** | NR |
| Immunotherapy + targeted therapy | |||||||||||
| Shigefuku 2024 [99] | CT | PMI | L3 | 213 | 5.00 | 4.10–6.30 | 4.91 | NR | NR | −1.20% | 0.06 |
| Colorectal cancer | |||||||||||
| Chemotherapy | |||||||||||
| Okuno (2019) [100] | CT | SMI | L3 | NR | 51.20 | 10.60 | 50.60 | 10.70 | NR | −1.17%** | 0.033 |
| Chemotherapy + targeted therapy | |||||||||||
| Nozawa (2021) [101] (Conversion) | CT | SMI | L3 | 127 | M: 38.8 F: 30.20 |
8.10 6.10 |
M: 42.20 F: 32.25 |
6.20 5.75 |
NR | +9.40% | NR |
| Nozawa (2021) [101] (NACT) | CT | SMI | L3 | 75 | M: 41.70 F: 34.00 |
7.30 6.60 |
M: 41.20 F: 30.60 |
6.60 6.10 |
NR | −5.90% | NR |
| Nozawa (2021) [101] (Palliation) | CT | SMI | L3 | 118 | M: 39.90 F: 28.00 |
7.10 4.90 |
M: 38.50 F: 26.60 |
5.00 6.70 |
NR | −3.70% | NR |
| Palle (2016) [102] | BIA | SMM | Whole body | 27.60 | M: 37.40 F: 25.20 |
2.50 2.70 |
M: 37.40 F: 25.00 |
2.80 3.20 |
NR | 0.00%** | 0.944 0.156 |
| Blauwhoff-Buskermolen (2016) [21] | CT | SMA | L3 | 78 | 138.60 | 32.10 | 131.90 | 31.70 | NR | −6.10% | < 0.01 |
| Gallois (2020) [104] | CT | SMI | L3 | 60 | 41.00 | 8.80 | 39.20 | 8.090 | NR | −4.39%** | NR |
| Breast cancer | |||||||||||
| Chemotherapy | |||||||||||
| Jang (2022) [105] (AC-T) | CT | SMI | L3 | 161 | 42.40 | 5.40 | 42.40 | 5.90 | −0.22 | 0.00%** | 0.83 |
| Campbell (2007) [106] | DXA | SMM | Whole body | 105 | 43.30 | 4.20 | 43.50 | 4.50 | NR | +0.46%** | 0.65 |
| Jung (2020) [107] | BIA | SMM | Whole body | NR | 39.41 | 4.89 | 39.42 | 5.15 | NR | +0.03%** | 0.187 |
| Chemotherapy + immunotherapy (+ targeted therapy) | |||||||||||
| Camilleri (2024) [108] | CT | SMI | L3 | 182 | 40.80 | 6.40 | 40.40 | 6.40 | NR | −0.98%** | 0.09 |
| Chemotherapy + targeted therapy | |||||||||||
| Zhang (2024) [109] | CT | PEMA | TH12 | 152 | 26.09 | 6.80 | 23.66 | 5.98 | NR | −9,31%** | < 0.00 |
| Rossi (2023) [110] | MRI | PMA | T4–T5 | 158 | 9.70 | 2.60 | 8.70 | 2.20 | −1.41 | −10.31%** | < 0.01 |
| Karaca (2024) [111] | CT | PMA (mm2) | L3 | NR | 502.80 | 118.00 | 454.30 | 115.10 | NR | −9.65%** | < 0.01 |
| Amitani (2022) [18] | CT | SMI | L3 | NR | 46.50 | 7.60 | 46.30 | 8.00 | NR | −0.43%** | NR |
| Rossi (2020) [113] | MRI | PMA | Pectoralis (sternal angle) | 166.80 | 8.12 | NR | 7.03 | NR | NR | −13.33%** | < 0.01 |
| Mazzuca (2018) [114] | CT | SMI | L3 | NR | 39.20 | 31.60–52.90 | 39.20 | 31.60–52.90 | NR | 0.00%** | NR |
| Lymphoma | |||||||||||
| Chemotherapy + targeted therapy | |||||||||||
| Xiao (2016) [115] | CT | SMA | L3 | NR | 173.6 | NR | 168.8 | NR | −4.8 | −2.8% | NR |
| *Table 3 includes only studies reporting mean or median skeletal muscle mass values. Studies reporting solely the prevalence of low SMM are presented in Table S14. **Percentage change was calculated by the present authors. SD: standard deviation; CT: computerized tomography; MRI: magnetic resonance imaging; DXA: dual-energy X-ray absorptiometry; BIA: bioelectrical impedance analysis; SMI: skeletal muscle index, cm2/m2; SMM: skeletal muscle mass, kg; SMA: skeletal muscle area, cm2; PEMA: pectoralis muscle area, cm2; PMI: psoas muscle index, cm2/m2; PMA: psoas muscle area, cm2; LMV: lumbar muscle volume, cm3; SMI inclination: (SMI-change/SMI)/duration; M: male. F: female. NR: not reported. |
|||||||||||
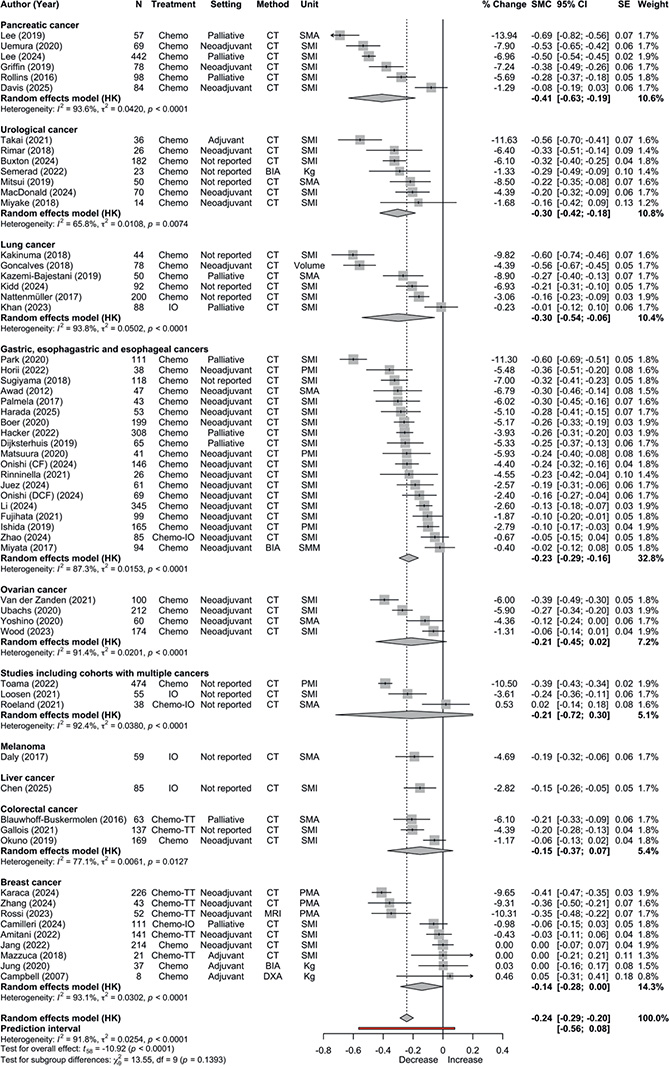
Figure 2. Meta-analyses of the change in skeletal muscle mass during systemic cancer treatment.
In exploratory subgroup analyses by treatment type, the largest decline was observed in chemotherapy (45 studies; n = 5,169; SMC: –0.27, 95% CI: –0.32 to –0.22; I2 = 92%), followed by chemotherapy + targeted therapy (7 studies; n = 683; SMC: –0.23, 95% CI: –0.38 to –0.08; I2 = 91%) and immunotherapy (4 studies; n = 287; SMC: –0.15, 95% CI: –0.30 to 0.01; I2 = 63%). No loss of SMM with combined chemotherapy and immunotherapy was observed. By treatment setting, the largest decline was observed for palliative treatment (10 studies; n = 1,393; SMC: –0.31, 95% CI: –0.47 to –0.16; I2 = 95%).
The magnitude of SMM loss varied across cancer types, but differences were not statistically significant (p = 0.193). Still, overlapping confidence intervals together with high heterogeneity limit direct comparisons between individual groups.
The largest and most consistent reductions were observed among patients with pancreatic (6 studies; n = 828; SMC = –0.41, 95% CI: –0.63 to –0.19; I2 = 94%), urological (7 studies; n = 401; SMC = –0.30, 95% CI: –0.42 to –0.18; I2 = 66%) and lung cancer (6 studies; n = 552; SMC = –0.30, 95% CI: –0.54 to –0.06; I2 = 94%), corresponding to unweighted mean declines of –8%, –6%, and –5%, respectively.
No significant change in SMM was observed in breast cancer, colorectal cancer, or studies including multiple cancer types. Overall heterogeneity remained considerable, but exploratory sensitivity analyses did not alter the pooled estimates, except for the sex-stratified subgroup analysis.
Males (n = 438) had smaller SMM losses (SMC: –0.21, 95% CI: –0.42 to –0.01; I2 = 92%) than females (n = 263; SMC: –0.40, 95% CI: –0.69 to –0.12; I2 = 93%). All subgroup analyses are presented in Table 2 and Tables S6–S13.
Thirty-one studies (n = 5,376 patients) reported the prevalence or percentage of low SMM during treatment (Table S14). In total, 20 distinct definitions of low SMM were identified. The SMI measured by CT at the L3 was the dominant criterion used in 28 (90%) studies, typically expressed with sex-specific cut-offs between < 52–55 cm2/m2 for males and < 38–41 cm2/m2 for females. In 26 (84%) studies, the prevalence of low SMM increased during treatment, with the mean percentage rising from 43% to 51% (Table S14). Excluded studies on full-text screening are presented in Table S15.
Discussion
Findings from our comprehensive systematic review and meta-analysis indicate that declines in SMM are frequently observed during systemic cancer treatment, particularly during chemotherapy (± targeted therapy), although effect sizes were generally small per Cohen’s thresholds. Among the 59 studies included in the meta-analysis, 78% showed a decline in SMM. However, substantial between-study heterogeneity suggests that the magnitude of change varies considerably across clinical contexts.
The wasting of SMM may have several possible mechanistic pathways. Cancer itself may directly and indirectly suppress muscle protein synthesis while increasing protein catabolism [29]. Tumor growth and systemic disease can create a chronic catabolic environment characterized by pro-inflammatory signaling, hormonal imbalance, altered metabolism, and energy deficit [3, 29]. Pro-inflammatory cytokines such as interleukin-6, interleukin-1β, tumor necrosis factor-α, and transforming growth factor-β promote proteolysis and inhibit muscle protein synthesis through activation of the ubiquitin, proteasome system and suppression of mTOR signaling [3, 30]. Chronic inflammation may also interact with hormonal changes such as reduced testosterone and insulin-like growth factor-1, to further impair anabolism [3, 30]. In a large cohort of patients with colorectal cancer (n = 2,470), the coexistence of low SMM and systemic inflammation more than doubled the risk of cancer-specific mortality (HR: 2.43, 95% CI: 1.79–3.29) [31]. These findings support the concept that cancer-related systemic inflammation may contribute to SMM loss, although the relative contribution of disease- versus treatment-related mechanisms cannot be disentangled in the included studies.
The magnitude of SMM loss differed markedly by treatment type. Across (n = 45) cohorts with patients receiving chemotherapy (n = 5,169), the pooled SMC was –0.27 (95% CI:–0.32 to –0.22), with consistent direction of change across studies, albeit considerable heterogeneity. These findings align closely with the review by Jang et al. [32], who synthesized 15 studies (n = 2,662) and reported a mean absolute reduction of 2.72 cm2/m2 (95% CI: 1.77–3.67) in SMI during chemotherapy treatment [32]. Our study extends these observations across a broader range of cancer types, treatment settings and sample sizes.
Across other treatment modalities, SMM loss was evident but varied in magnitude. Estimates for immunotherapy and combined treatment should be interpreted with caution due to the limited number of studies. The observed treatment differences likely reflect distinct biological and metabolic mechanisms. Cytotoxic chemotherapy, particularly platinum-based regimens, induces direct myotoxicity through mitochondrial dysfunction, oxidative stress, and activation of catabolic transcription factors, while concurrently suppressing anabolic pathways and increasing myostatin expression [3]. These molecular effects are further compounded by systemic inflammation, toxicities, and treatment-related symptoms such as nausea, fatigue and pain, which collectively can diminish nutrient intake and physical activity, and thus reinforcing a cycle of muscle disuse and atrophy [3, 33].
Immunotherapy could influence SMM though similar pathways as cytotoxic regimens through symptom burden, cytokine-driven inflammation, and physical inactivity rather than direct cellular injury [34]. Nonetheless, biological pathways underlying muscle depletion during immunotherapy remain incompletely understood and should be addressed through robust mechanistic and prospective longitudinal studies.
Our findings did not indicate a clear additional effect of targeted agents on SMM loss when administered in combination with chemotherapy. This interpretation aligns with Kakinuma et al. [35], in a study of patients with advanced non-small cell lung cancer (NSCLC) (n = 65). In their cohort, chemotherapy led to a 10% decline in SMI (from 44.8 to 40.4 cm2/m2), whereas targeted therapy treatment did not reduce SMI [35]. Sex differences in SMM loss may partly explain these findings. In our study, six of eight studies (75%) in chemotherapy + targeted therapy subgroups included breast cancer cohorts. In Jang et al. [32] (males, n = 823; females, n = 352), absolute declines in SMI were 1.6 times greater in males than in females (–4.52 vs. –2.86 cm2/m2) in sex-stratified sub-analyses. By contrast, in our review, eight sex-stratified studies showed larger relative losses in females (SMC: –0.40; n = 263) than in males (SMC: –0.21; n = 438). However, these findings are based on a limited number of studies and should be interpreted cautiously. Thus, further elucidation of absolute and relative changes stratified by sex and treatment type is warranted to conclude whether sex-based differences exist.
Across treatment settings, the greatest SMM loss was observed in patients in palliative treatment settings with SMC –0.31 (95% CI: –0.47 to –0.16). In agreement, a longitudinal cohort of (n = 3,075) community-dwelling older adults aged 70–79 years. Williams and colleagues [36] found that among the (n = 515) adults who developed cancer, the loss in SMM was most pronounced among people with metastatic disease, indicating that cancer stage and treatment setting amplify age-related SMM wasting [36]. Still, among the seven studies showing the most pronounced declines (SMC from –0.69 to –0.50), neoadjuvant [23, 37], adjuvant [38], palliative [39–41], and unclassified treatment [35] settings were present. This distribution suggests that SMM loss may occur across different treatment settings, although the magnitude of change varies substantially between studies.
Clinical implications of SMM loss
Reduced overall and progression-free survival could, in part, be explained by reduced treatment tolerance in patients with SMM wasting, potentially reflecting a pharmacokinetic mismatch driven by current dosing practices. Most cytotoxic agents are dosed by body surface area, which does not account for lean versus fat mass distribution [1, 42]. Because anticancer drugs distribute primarily into metabolically active tissues, patients with low SMM and high body surface area may experience a higher relative dose per unit of lean tissue, predisposing them to toxicity and dose reductions [1, 42]. Conversely, individuals with preserved SMM have greater drug clearance and fewer adverse effects [43]. In the recent phase II Randomized LEANOX Trial, Assenat et al. [44] found that using an lean body mass-based oxaliplatin dose significantly reduced peripheral neurotoxicity and improved quality of life without affecting relapse-free and overall survival [44]. This indicates that SMM loss may contribute directly to treatment-related toxicity.
In healthy individuals around age 75, muscle strength declines by roughly 3–4% per year in men and 2–3% per year in women [46]. Studies evaluating both strength and SMM within the same cohorts further indicate that strength decreases at a rate two to five times greater than SMM [46]. Importantly, loss of muscle strength and power is a more consistent predictor of disability and mortality than loss of SMM in older adults [46, 47].
Still, prospective studies directly linking cancer-related SMM and strength loss to clinical outcomes remain scarce.
Physical exercise remains the most potent non-pharmacological strategy to preserve SMM and strength [45], and progressive resistance training can provide an anabolic stimulus in patients with cancer. A meta-analysis of 34 randomized trials demonstrated a mean gain of 0.85 kg (95% CI: 0.26–1.43) in lean body mass compared with controls [4, 48]. Yet, most studies have excluded older, malnourished, or patients with low physiological fitness – the individuals most vulnerable to muscle wasting but also those with the greatest potential for relative improvements in physical function and clinical outcomes [33]. Current evidence suggests that patients should aim for a protein intake of approximately 1.5 g/kg/day, or 15–20% of total caloric intake, to mitigate treatment-related SMM loss [49]. However, high-quality trials are required to confirm feasibility and efficacy of such multimodal interventions [33, 45].
Strengths and limitations
To our knowledge, this meta-analysis represents the largest and most comprehensive synthesis to date of systemic treatment-related SMM loss across cancer types. By excluding studies involving surgery or radiotherapy, we provide a clearer picture of chemotherapy and immunotherapy-related changes in SMM. Most studies (76%) were eligible for quantitative synthesis, which enhanced statistical power and generalizability. No evidence of publication bias was detected.
Nonetheless, substantial heterogeneity persisted, likely reflecting variation in cancer types and treatment regimens. Accordingly, the pooled estimate should be interpreted as a summary of heterogeneous findings rather than a single generalizable effect. We recognize that observed changes in SMM are most likely influenced by factors such as disease progression, treatment-related toxicity, and nutritional status, and should not be interpreted as independent of these processes. In particular, the inclusion criteria of two available SMM assessments, which preclude a loss to follow-up evaluation, introduce selection and survivorship bias in retrospective studies. Accordingly, the risk-of-bias assessment focuses on the validity of estimating within-patient change while acknowledging the inherent limitations of observational study designs, including residual confounding and selection bias. In addition, variation in outcome definitions (e.g. SMI, SMA, and absolute SMM) represents a further source of heterogeneity, as these measures are not directly equivalent despite standardization.
Because analyses relied on study-level summary estimates, planned stratification by treatment agent, age, disease stage or number of cycles were not possible. Furthermore, 38% of studies did not report the interval between SMM assessments, limiting precise interpretation of the rate and timing of SMM loss. Finally, varying definitions of low SMM, primarily lacking functional measures [1], precluded evaluation of sarcopenia as this is defined by combined assessments of muscle strength and SMM [50].
Conclusion
In summary, declines in SMM are frequently observed during systemic cancer treatment. However, substantial heterogeneity across studies indicates that the magnitude of change varies across clinical contexts, and findings should not be interpreted as a uniform effect. The extent varies across cancer types and treatment modalities, reflecting the interplay of biological, treatment-related, and behavioral factors. Integrating automated body composition analysis into routine imaging could enable early detection of clinically meaningful SMM wasting, inform treatment planning, and facilitate timely preventative interventions.
Acknowledgements
This work received no funding.
Data availability statement
The data underlying this article are available in the article and in its online supplementary material. Any further information is available on request by contacting the corresponding author.
Ethics declarations & trial registry information
Not applicable.
Author contributions
L.S.: Conceptualization, Data curation, Formal analysis, Methodology, Project administration, Software, Validation, Visualization, Writing – original draft, and Writing – review & editing. S.J.: Data curation, Investigation, Project administration, and Writing – review & editing. S.H.: Data curation, Investigation, and Writing – review & editing. V.S.: Data curation, Investigation, and Writing – review & editing. C.J.: Conceptualization, Methodology, Resources, Supervision, and Writing – review & editing. C.Su.: Conceptualization, Methodology, and Writing – review & editing. H.P.: Conceptualization, Methodology, Supervision, and Writing – review & editing. C.Si.: Conceptualization, Formal analysis, Methodology, Validation, and Writing – review & editing. L.H.T.: Conceptualization, Methodology, and Writing – review & editing. S.O.D.: Writing – review & editing. G.A.: Conceptualization, Data curation, Methodology, Supervision, and Writing – review & editing. B.S.R.: Conceptualization, Data curation, Methodology, Supervision, and Writing – review & editing. All authors reviewed, edited, and approved the final manuscript.
References
[1] Williams GR, Dunne RF, Giri S, Shachar SS, Caan BJ. Sarcopenia in the older adult with cancer. J Clin Oncol. 2021;39(19):2068–78. https://doi.org/10.1200/JCO.21.00102
[2] Baracos VE, Arribas L. Sarcopenic obesity: hidden muscle wasting and its impact for survival and complications of cancer therapy. Ann Oncol. 2018 Feb 1;29(suppl_2):ii1-ii9. 10.1093/annonc/mdx810
[3] Lavalle S, Valerio MR, Masiello E, Gebbia V, Scandurra G. Unveiling the intricate dance: how cancer orchestrates muscle wasting and sarcopenia. In Vivo. 2024;38(4):1520–9. https://doi.org/10.21873/invivo.13602
[4] Bland KA, Kouw IWK, van Loon LJC, Zopf EM, Fairman CM. Exercise-based interventions to counteract skeletal muscle mass loss in people with cancer: can we overcome the odds? Sports Med. 2022;52(5):1009–27. https://doi.org/10.1007/s40279-021-01638-z
[5] Surov A, Wienke A. Prevalence of sarcopenia in patients with solid tumors: a meta-analysis based on 81,814 patients. J Parenter Enteral Nutr. 2022;46(8):1761–8. https://doi.org/10.1002/jpen.2415
[6] Sullivan ES, Daly L, Power D, Ryan A. Epidemiology of cancer‐related weight loss and sarcopenia in the UK and Ireland: incidence, prevalence, and clinical impact. JCSM Rapid Commun. 2020;3:91-102. https://doi.org/10.1002/rco2.19
[7] Martin L, Birdsell L, Macdonald N, Reiman T, Clandinin MT, McCargar LJ, et al. Cancer cachexia in the age of obesity: skeletal muscle depletion is a powerful prognostic factor, independent of body mass index. J Clin Oncol. 2013;31(12):1539–47. https://doi.org/10.1200/JCO.2012.45.2722
[8] Au PC, Li HL, Lee GK, Li GH, Chan M, Cheung BM, et al. Sarcopenia and mortality in cancer: a meta-analysis. Osteoporos Sarcopenia. 2021;7(Suppl 1):S28–33. https://doi.org/10.1016/j.afos.2021.03.002
[9] Li HL, Au PC, Lee GK, Li GH, Chan M, Cheung BM, et al. Different definition of sarcopenia and mortality in cancer: a meta-analysis. Osteoporos Sarcopenia. 2021;7(Suppl 1):S34–8. https://doi.org/10.1016/j.afos.2021.02.005
[10] Lee D, Kim NW, Kim JY, Lee JH, Noh JH, Lee H, et al. Sarcopenia’s prognostic impact on patients treated with immune checkpoint inhibitors: a systematic review and meta-analysis. J Clin Med. 2021;10(22):1–12. https://doi.org/10.3390/jcm10225329
[11] Luo L, Shen X, Fang S, Wan T, Liu P, Li P, et al. Sarcopenia as a risk factor of progression-free survival in patients with metastases: a systematic review and meta-analysis. BMC Cancer. 2023;23(1):127. https://doi.org/10.1186/s12885-023-10582-2
[12] Surov A, Pech M, Gessner D, Mikusko M, Fischer T, Alter M, et al. Low skeletal muscle mass is a predictor of treatment related toxicity in oncologic patients. A meta-analysis. Clin Nutr. 2021;40(10):5298–310. https://doi.org/10.1016/j.clnu.2021.08.023
[13] Xia L, Zhao R, Wan Q, Wu Y, Zhou Y, Wang Y, et al. Sarcopenia and adverse health-related outcomes: an umbrella review of meta-analyses of observational studies. Cancer Med. 2020;9(21):7964–78. https://doi.org/10.1002/cam4.3428
[14] Nipp RD, Fuchs G, El-Jawahri A, Mario J, Troschel FM, Greer JA, et al. Sarcopenia is associated with quality of life and depression in patients with advanced cancer. Oncologist. 2018;23(1):97–104. https://doi.org/10.1634/theoncologist.2017-0255
[15] Wiegert EVM, de Oliveira LC, Calixto-Lima L, Borges NA, Rodrigues J, da Mota ESLMS, et al. Association between low muscle mass and survival in incurable cancer patients: a systematic review. Nutrition. 2020;72:110695. https://doi.org/10.1016/j.nut.2019.110695
[16] Sugiyama K, Narita Y, Mitani S, Honda K, Masuishi T, Taniguchi H, et al. Baseline sarcopenia and skeletal muscle loss during chemotherapy affect survival outcomes in metastatic gastric cancer. Anticancer Res. 2018;38(10):5859–66. https://doi.org/10.21873/anticanres.12928
[17] Li W, Zhu H, Dong H, Shi B, Qin Z, Huang F, et al. Body composition decrease and impact on clinical outcome in gastric cancer patients undergoing radical gastrectomy after neoadjuvant treatment. Nutr Cancer. 2024;77:1–12. https://doi.org/10.1080/01635581.2024.2418622
[18] Amitani M, Oba T, Kiyosawa N, Morikawa H, Chino T, Soma A, et al. Skeletal muscle loss during neoadjuvant chemotherapy predicts poor prognosis in patients with breast cancer. BMC Cancer. 2022;22(1):327. https://doi.org/10.1186/s12885-022-09443-1
[19] Loosen SH, van den Bosch V, Gorgulho J, Schulze-Hagen M, Kandler J, Jordens MS, et al. Progressive sarcopenia correlates with poor response and outcome to immune checkpoint inhibitor therapy. J Clin Med. 2021;10(7):1–12. https://doi.org/10.3390/jcm10071361
[20] Chaunzwa TL, Qian JM, Li Q, Ricciuti B, Nuernberg L, Johnson JW, et al. Body composition in advanced non-small cell lung cancer treated with immunotherapy. JAMA Oncol. 2024;10(6):773–83. https://doi.org/10.1001/jamaoncol.2024.1120
[21] Blauwhoff-Buskermolen S, Versteeg KS, de van der Schueren MAE, den Braver NR, Berkhof J, Langius JAE, et al. Loss of muscle mass during chemotherapy is predictive for poor survival of patients with metastatic colorectal cancer. J Clin Oncol. 2016;34(12):1339–44. https://doi.org/10.1200/JCO.2015.63.6043
[22] Cho KM, Park H, Oh DY, Lee KH, Han SW, Im SA, et al. Skeletal muscle depletion predicts survival of patients with advanced biliary tract cancer undergoing palliative chemotherapy. Oncotarget. 2017;8(45):79441–52. https://doi.org/10.18632/oncotarget.18345
[23] Uemura S, Iwashita T, Ichikawa H, Iwasa Y, Mita N, Shiraki M, et al. The impact of sarcopenia and decrease in skeletal muscle mass in patients with advanced pancreatic cancer during FOLFIRINOX therapy. Br J Nutr. 2020;125:1–8. https://doi.org/10.1017/S0007114520003463
[24] Cumpston M, Li T, Page MJ, Chandler J, Welch VA, Higgins JP, et al. Updated guidance for trusted systematic reviews: a new edition of the Cochrane Handbook for Systematic Reviews of Interventions. Cochrane Database Syst Rev. 2019;10(10):Ed000142. https://doi.org/10.1002/14651858.ED000142
[25] Liberati A, Altman DG, Tetzlaff J, Mulrow C, Gøtzsche PC, Ioannidis JP, et al. The PRISMA statement for reporting systematic reviews and meta-analyses of studies that evaluate health care interventions: explanation and elaboration. J Clin Epidemiol. 2009;62(10):e1–34. https://doi.org/10.1016/j.jclinepi.2009.06.006
[26] NHLBI N. Study Quality Assessment Tools. [cited 2025 Aug 1]. Available from: https://www.nhlbi.nih.gov/health-topics/study-quality-assessment-tools
[27] Villaseca-Rojas Y, Varela-Melo J, Torres-Castro R, Vasconcello-Castillo L, Mazzucco G, Vilaró J, et al. Exercise capacity in children and adolescents with congenital heart disease: a systematic review and meta-analysis. Front Cardiovasc Med. 2022;9:874700. https://doi.org/10.3389/fcvm.2022.874700
[28] Wan X, Wang W, Liu J, Tong T. Estimating the sample mean and standard deviation from the sample size, median, range and/or interquartile range. BMC Med Res Methodol. 2014;14:135.
[29] Cespedes Feliciano EM, Kroenke CH, Caan BJ. The obesity paradox in cancer: how important is muscle? Annu Rev Nutr. 2018;38:357–79. https://doi.org/10.1146/annurev-nutr-082117-051723
[30] Singh N, Baby D, Rajguru JP, Patil PB, Thakkannavar SS, Pujari VB. Inflammation and cancer. Ann Afr Med. 2019;18(3):121–6. https://doi.org/10.4103/aam.aam_56_18
[31] Feliciano EMC, Kroenke CH, Meyerhardt JA, Prado CM, Bradshaw PT, Kwan ML, et al. Association of systemic inflammation and sarcopenia with survival in nonmetastatic colorectal cancer: results from the C SCANS study. JAMA Oncol. 2017;3(12):e172319. https://doi.org/10.1001/jamaoncol.2017.2319
[32] Jang MK, Park C, Hong S, Li H, Rhee E, Doorenbos AZ. Skeletal muscle mass change during chemotherapy: a systematic review and meta-analysis. Anticancer Res. 2020;40(5):2409–18. https://doi.org/10.21873/anticanres.14210
[33] Fairman CM, Lønbro S, Cardaci T, VanderVeen BN, Nilsen TS, Murphy A. Muscle wasting in cancer: opportunities and challenges for exercise in clinical cancer trials. JCSM Rapid Commun. 2021;7:51–64. https://doi.org/10.1002/rco2.56
[34] Ma S, Zhao G, Sui S, Chen X, Wu L, Wang T, et al. Tumor microenvironment and immune-related myositis: addressing muscle wasting in cancer immunotherapy. Front Immunol. 2025;16:1580108. https://doi.org/10.3389/fimmu.2025.1580108
[35] Kakinuma K, Tsuruoka H, Morikawa K, Furuya N, Inoue T, Miyazawa T, et al. Differences in skeletal muscle loss caused by cytotoxic chemotherapy and molecular targeted therapy in patients with advanced non-small cell lung cancer. Thorac Cancer. 2018;9(1):99–104. https://doi.org/10.1111/1759-7714.12545
[36] Williams GR, Chen Y, Kenzik KM, McDonald A, Shachar SS, Klepin HD, et al. Assessment of sarcopenia measures, survival, and disability in older adults before and after diagnosis with cancer. JAMA Netw Open. 2020;3(5):e204783. https://doi.org/10.1001/jamanetworkopen.2020.4783
[37] Goncalves MD, Taylor S, Halpenny DF, Schwitzer E, Gandelman S, Jackson J, et al. Imaging skeletal muscle volume, density, and FDG uptake before and after induction therapy for non-small cell lung cancer. Clin Radiol. 2018;73(5):505.e1–e8. https://doi.org/10.1016/j.crad.2017.12.004
[38] Takai Y, Naito S, Kanno H, Yamagishi A, Yagi M, Sakurai T, et al. Body composition changes following chemotherapy for testicular germ cell tumor: obesity is the long-term problem. Asian J Andrology. 2021;03:458-62. https://doi.org/10.4103/aja202195
[39] Park SE, Choi JH, Park JY, Kim BJ, Kim JG, Kim JW, et al. Loss of skeletal muscle mass during palliative chemotherapy is a poor prognostic factor in patients with advanced gastric cancer. Sci Rep. 2020;10(1):17683. https://doi.org/10.1038/s41598-020-74765-8
[40] Lee MW, Jeon SK, Paik WH, Yoon JH, Joo I, Lee JM, et al. Prognostic value of initial and longitudinal changes in body composition in metastatic pancreatic cancer. J Cachexia Sarcopenia Muscle. 2024;15(2):735–45. https://doi.org/10.1002/jcsm.13437
[41] Lee H, Kim S, Chung M, Park J, Bang S, Park S, et al. Skeletal muscle mass predicts poor prognosis in patients with advanced pancreatic cancer undergoing second-line FOLFIRINOX chemotherapy. Nutr Cancer. 2019;71:1100–07. https://doi.org/10.1080/01635581.2019.1597906
[42] Christensen JF, Simonsen C, Hojman P. Exercise training in cancer control and treatment. Compr Physiol. 2018;9(1):165–205. https://doi.org/10.1002/j.2040-4603.2019.tb00064.x
[43] Pin F, Couch ME, Bonetto A. Preservation of muscle mass as a strategy to reduce the toxic effects of cancer chemotherapy on body composition. Curr Opin Support Palliat Care. 2018;12(4):420–6. https://doi.org/10.1097/SPC.0000000000000382
[44] Assenat E, Ben Abdelghani M, Gourgou S, Perrier H, Akouz FK, Desgrippes R, et al. Impact of lean body mass-based oxaliplatin dose calculation on neurotoxicity in adjuvant treatment of stage III colon cancer: results of the phase II randomized LEANOX trial. J Clin Oncol. 2025;43(23):2616–27. https://doi.org/10.1200/JCO-24-02754
[45] Christensen JF, Jones LW, Andersen JL, Daugaard G, Rorth M, Hojman P. Muscle dysfunction in cancer patients. Ann Oncol. 2014;25(5):947–58. https://doi.org/10.1093/annonc/mdt551
[46] Mitchell WK, Williams J, Atherton P, Larvin M, Lund J, Narici M. Sarcopenia, dynapenia, and the impact of advancing age on human skeletal muscle size and strength; a quantitative review. Front Physiol. 2012;3:260. https://doi.org/10.3389/fphys.2012.00260
[47] Huo Z, Chong F, Luo S, Li N, Tong N, Lu Z, et al. Potential framework of the Global Leadership Initiative in Sarcopenia (GLIS) criteria based on muscle mass and/or strength for predicting survival in cancer patients: a nationwide multicenter cohort study. Clin Nutr. 2025;49:187–201. https://doi.org/10.1016/j.clnu.2025.04.021
[48] Koeppel M, Mathis K, Schmitz KH, Wiskemann J. Muscle hypertrophy in cancer patients and survivors via strength training. A meta-analysis and meta-regression. Crit Rev Oncol Hematol. 2021;163:103371.
[49] Prado CM, Purcell SA, Laviano A. Nutrition interventions to treat low muscle mass in cancer. J Cachexia Sarcopenia Muscle. 2020;11(2):366–80. https://doi.org/10.1002/jcsm.12525
[50] Kirk B, Cawthon PM, Arai H, Ávila-Funes JA, Barazzoni R, Bhasin S, et al. The conceptual definition of sarcopenia: delphi consensus from the global leadership initiative in sarcopenia (GLIS). Age Ageing. 2024;53(3):1–10.
[51] Shimura M, Mizuma M, Motoi F, Kusaka A, Aoki S, Iseki M, et al. Negative prognostic impact of sarcopenia before and after neoadjuvant chemotherapy for pancreatic cancer. Pancreatology. 2023;23(1):65–72. https://doi.org/10.1016/j.pan.2022.11.010
[52] Jin K, Tang Y, Wang A, Hu Z, Liu C, Zhou H, et al. Body composition and response and outcome of neoadjuvant treatment for pancreatic cancer. Nutr Cancer. 2021;74:100–09. https://doi.org/10.1080/01635581.2020.1870704
[53] Griffin OM, Duggan SN, Ryan R, McDermott R, Geoghegan J, Conlon KC. Characterising the impact of body composition change during neoadjuvant chemotherapy for pancreatic cancer. Pancreatology. 2019;19(6):850–7.
[54] Rollins KE, Tewari N, Ackner A, Awwad A, Madhusudan S, Macdonald IA, et al. The impact of sarcopenia and myosteatosis on outcomes of unresectable pancreatic cancer or distal cholangiocarcinoma. Clin Nutr. 2016;35(5):1103–9. https://doi.org/10.1016/j.clnu.2015.08.005
[55] Aberle MR, Coolsen MME, Wenmaekers G, Volmer L, Brecheisen R, van Dijk D, et al. Skeletal muscle is independently associated with grade 3–4 toxicity in advanced stage pancreatic ductal adenocarcinoma patients receiving chemotherapy. Clin Nutr ESPEN. 2025;65:134–43. https://doi.org/10.1016/j.clnesp.2024.11.004
[56] Davis MP, Bader N, Basting J, Vanenkevort E, Koppenhaver N, Patel A, et al. Are muscle and fat loss predictive of clinical events in pancreatic cancer? the importance of precision metrics. J Pain Symptom Manage. 2025;69(2):141–51.
[57] Miyake M, Owari T, Iwamoto T, Morizawa Y, Hori S, Marugami N, et al. Clinical utility of bioelectrical impedance analysis in patients with locoregional muscle invasive or metastatic urothelial carcinoma: a subanalysis of changes in body composition during neoadjuvant systemic chemotherapy. Support Care Cancer. 2018;26(4):1077–86. https://doi.org/10.1007/s00520-017-3924-0
[58] MacDonald L, Rendon RA, Thana M, Wood L, MacFarlane R, Bell D, et al. An in-depth analysis on the effects of body composition in patients receiving neoadjuvant chemotherapy for urothelial cell carcinoma. Can Urol Assoc J. 2024;18(6):180–4.
[59] Rimar KJ, Glaser AP, Kundu S, Schaeffer EM, Meeks J, Psutka SP. Changes in lean muscle mass associated with neoadjuvant platinum-based chemotherapy in patients with muscle invasive bladder cancer. Bladder Cancer. 2018;4(4):411–8. https://doi.org/10.3233/BLC-180188
[60] Lyon TD, Frank I, Takahashi N, Boorjian SA, Moynagh MR, Shah PH, et al. Sarcopenia and response to neoadjuvant chemotherapy for muscle-invasive bladder cancer. Clin Genitourin Cancer. 2019;17(3):216–22.e5. https://doi.org/10.1016/j.clgc.2019.03.007
[61] Mitsui Y, Sadahira T, Araki M, Maruyama Y, Wada K, Tanimoto R, et al. Loss of psoas major muscle volume during systemic chemotherapy is related to worse prognosis in testicular cancer. Jpn J Clin Oncol. 2019;49(2):183–9. https://doi.org/10.1093/jjco/hyy166
[62] Semerad O, Buchler T, Vejmelka J, Rozsypalova A, Tomesova J, Kohout P. Body composition changes during and after curative chemotherapy in patients with testicular cancer. Biomed Pap Med Fac Univ Palacky Olomouc Czech Repub. 2022 Mar;166(1):91-96.10.5507/bp.2020.058.
[63] Buxton C, Schmeusser BN, Holt SK, Patil D, Phuong A, Chahine S, et al. A multicenter evaluation of treatment-associated changes in body composition in men with germ cell tumors of the testis: implications for adverse events and complications. Urology. 2024;192:74–82.
[64] Stene GB, Helbostad JL, Amundsen T, Sørhaug S, Hjelde H, Kaasa S, et al. Changes in skeletal muscle mass during palliative chemotherapy in patients with advanced lung cancer. Acta Oncol. 2015;54(3):340–8. https://doi.org/10.3109/0284186X.2014.953259
[65] Kazemi-Bajestani S, Becher H, Butts C, Basappa N, Smylie N, Joy A, et al. Rapid atrophy of cardiac left ventricular mass in patients with non-small cell carcinoma of the lung. J Cachexia. 2019;10:1070-82. https://doi.org/10.1002/jcsm.12451
[66] Nattenmüller J, Wochner R, Muley T, Steins M, Hummler S, Teucher B, et al. Prognostic impact of CT-quantified muscle and fat distribution before and after first-line-chemotherapy in lung cancer patients. PLoS One. 2017;12(1):e0169136. https://doi.org/10.1371/journal.pone.0169136
[67] Kidd AC, Cowell GW, Martin GA, Ferguson J, Fennell DA, Evison M, et al. The prevalence and prognostic significance of sarcopenia and adipopenia in pleural mesothelioma. Cancer Treat Res Commun. 2024;42:100856. https://doi.org/10.1016/j.ctarc.2024.100856
[68] Khan A, Welman CJ, Abed A, O’Hanlon S, Redfern A, Azim S, et al. Association of computed tomography measures of muscle and adipose tissue and progressive changes throughout treatment with clinical endpoints in patients with advanced lung cancer treated with immune checkpoint inhibitors. Cancers (Basel). 2023;15(5):1–14. https://doi.org/10.3390/cancers15051382
[69] Cortellini A, Palumbo P, Porzio G, Verna L, Giordano AV, Masciocchi C, et al. Single-institution study of correlations between skeletal muscle mass, its density, and clinical outcomes in non-small cell lung cancer patients treated with first-line chemotherapy. Thorac Cancer. 2018;9(12):1623–30. https://doi.org/10.1111/1759-7714.12870
[70] Sato R, Tokunaga M, Mizusawa J, Sato Y, Ito S, Takahari D, et al. Clinical impact of skeletal muscle mass change during the neoadjuvant chemotherapy period in patients with gastric cancer: an ancillary study of JCOG1002. World J Surg. 2024;48(1):163–74. https://doi.org/10.1002/wjs.12041
[71] Juez LD, Priego P, Cuadrado M, Blázquez LA, Sánchez-Picot S, Gil P, et al. Impact of neoadjuvant treatment on body composition in patients with locally advanced gastric cancer. Cancers (Basel). 2024;16(13):1–11. https://doi.org/10.3390/cancers16132408
[72] Mirkin KA, Luke FE, Gangi A, Pimiento JM, Jeong D, Hollenbeak CS, et al. Sarcopenia related to neoadjuvant chemotherapy and perioperative outcomes in resected gastric cancer: a multi-institutional analysis. J Gastrointest Oncol. 2017;8(3):589–95. https://doi.org/10.21037/jgo.2017.03.02
[73] Matsuura N, Motoori M, Fujitani K, Nishizawa Y, Komatsu H, Miyazaki Y, et al. Correlation between skeletal muscle mass and adverse events of neoadjuvant chemotherapy in patients with gastric cancer. Oncology. 2020;98(1):29–34. https://doi.org/10.1159/000502613
[74] Horii N, Kosaka T, Fujiwara R, Sato S, Akiyama H, Kunisaki C, et al. Psoas muscle depletion during preoperative chemotherapy for advanced gastric cancer has a negative impact on long-term outcomes after gastrectomy. Asia Pac J Clin Oncol. 2022;18:61–69
[75] Palmela C, Velho S, Agostinho L, Branco F, Santos M, Santos MPC, et al. Body composition as a prognostic factor of neoadjuvant chemotherapy toxicity and outcome in patients with locally advanced gastric cancer. J Gastric Cancer. 2017;17(1):74–87. https://doi.org/10.5230/jgc.2017.17.e8
[76] den Boer RB, Jones KI, Ash S, van Boxel GI, Gillies RS, O’Donnell T, et al. Impact on postoperative complications of changes in skeletal muscle mass during neoadjuvant chemotherapy for gastro-oesophageal cancer. BJS Open. 2020;4(5):847–54. https://doi.org/10.1002/bjs5.50331
[77] Rinninella E, Strippoli A, Cintoni M, Raoul P, Vivolo R, Di Salvatore M, et al. Body composition changes in gastric cancer patients during preoperative FLOT therapy: preliminary results of an Italian cohort study. Nutrients. 2021;13(3):1–13. https://doi.org/10.3390/nu13030960
[78] Fujihata S, Ogawa R, Nakaya S, Hayakawa S, Okubo T, Sagawa H, et al. The impact of skeletal muscle wasting during neoadjuvant chemotherapy on postoperative anastomotic leakage in patients with esophageal cancer. Esophagus. 2021;18(2):258–66.
[79] Dijksterhuis WPM, Pruijt MJ, van der Woude SO, Klaassen R, Kurk SA, van Oijen MGH, et al. Association between body composition, survival, and toxicity in advanced esophagogastric cancer patients receiving palliative chemotherapy. J Cachexia Sarcopenia Muscle. 2019;10(1):199–206. https://doi.org/10.1002/jcsm.12371
[80] Hacker UT, Hasenclever D, Baber R, Linder N, Busse H, Obermannova R, et al. Modified Glasgow prognostic score (mGPS) is correlated with sarcopenia and dominates the prognostic role of baseline body composition parameters in advanced gastric and esophagogastric junction cancer patients undergoing first-line treatment from the phase III EXPAND trial. Ann Oncol. 2022;33(7):685–92. https://doi.org/10.1016/j.annonc.2022.03.274
[81] Awad S, Tan BH, Cui H, Bhalla A, Fearon KCH, Parsons SL, et al. Marked changes in body composition following neoadjuvant chemotherapy for oesophagogastric cancer. Clin Nutr. 2012;31(1):74–7. https://doi.org/10.1016/j.clnu.2011.08.008
[82] Onishi S, Tajika M, Tanaka T, Yamada K, Inaba Y, Abe T, et al. Prognostic impact of shift to low visceral fat mass after neoadjuvant chemotherapy in patients with esophageal cancer. Cancer Rep (Hoboken). 2024;7(8):e2084. https://doi.org/10.1002/cnr2.2084
[83] Harada T, Tsuji T, Ueno J, Konishi N, Yanagisawa T, HIjikata H, et al. Clinical mechanism of muscle mass loss during neoadjuvant chemotherapy in older patients with esophageal cancer: a prospective cohort study. Dis Esophagus. 2025;38(1):1–13.
[84] Yip C, Goh V, Davies A, Gossage J, Mitchell-Hay R, Hynes O, et al. Assessment of sarcopenia and changes in body composition after neoadjuvant chemotherapy and associations with clinical outcomes in oesophageal cancer. Eur Radiol. 2014;24(5):998–1005. https://doi.org/10.1007/s00330-014-3110-4
[85] Miyata H, Sugimura K, Motoori M, Fujiwara Y, Omori T, Yanagimoto Y, et al. Clinical assessment of sarcopenia and changes in body composition during neoadjuvant chemotherapy for esophageal cancer. Anticancer Res. 2017;37(6):3053–9. https://doi.org/10.21873/anticanres.11660
[86] Ishida T, Makino T, Yamasaki M, Tanaka K, Miyazaki Y, Takahashi T, et al. Impact of measurement of skeletal muscle mass on clinical outcomes in patients with esophageal cancer undergoing esophagectomy after neoadjuvant chemotherapy. Surgery. 2019;166(6):1041–7. https://doi.org/10.1016/j.surg.2019.07.033
[87] Zhao Y, Xia M, Dang Y, Li Y, Zhao X, Kang N, et al. Impact of body composition on clinical outcomes in patients with esophageal squamous cell carcinoma receiving neoadjuvant immunotherapy plus chemotherapy. Ann Ital Chir. 2024;95(3):284–93. https://doi.org/10.62713/aic.3336
[88] Ying H, Chen Y, Hong Y, Ying K, Li S, Zhang Y, et al. L3-SMI as a predictor of overall survival in oesophageal cancer patients receiving PD-1 inhibitors combined with chemotherapy. Ann Med. 2025;57(1):2440114.
[89] Wood N, Morton M, Shah SN, Yao M, Barnard H, Tewari S, et al. Association between CT-based body composition assessment and patient outcomes during neoadjuvant chemotherapy for epithelial ovarian cancer. Gynecol Oncol. 2023;169:55–63. https://doi.org/10.1016/j.ygyno.2022.11.024
[90] Ubachs J, Koole SN, Lahaye M, Fabris C, Bruijs L, Schagen van Leeuwen J, et al. No influence of sarcopenia on survival of ovarian cancer patients in a prospective validation study. Gynecol Oncol. 2020;159(3):706–11. https://doi.org/10.1016/j.ygyno.2020.09.042
[91] Yoshino Y, Taguchi A, Nakajima Y, Takao M, Kashiyama T, Furusawa A, et al. Extreme skeletal muscle loss during induction chemotherapy is an independent predictor of poor survival in advanced epithelial ovarian cancer patients. J Obstet Gynaecol Res. 2020;91:2662-71. https://doi.org/10.1111/jog.14516
[92] Del Grande M, Rizzo S, Nicolino GM, Colombo I, Rossi L, Manganaro L, et al. Computed tomography-based body composition in patients with ovarian cancer: association with chemotoxicity and prognosis. Fronti Oncol. 2021;11:1–9. https://doi.org/10.3389/fonc.2021.718815
[93] van der Zanden V, van Soolingen NJ, Viddeleer AR, Trum JW, Amant F, Mourits MJE, et al. Loss of skeletal muscle density during neoadjuvant chemotherapy in older women with advanced stage ovarian cancer is associated with postoperative complications. Eur J Surg Oncol. 2021;48:896-902. https://doi.org/10.1016/j.ejso.2021.10.015
[94] Toama W, Wiederin J, Shanley R, Jewett P, Gu C, Shenoy C, et al. Impact of pectoralis muscle loss on cardiac outcome and survival in Cancer patients who received anthracycline based chemotherapy: retrospective study. BMC Cancer. 2022;22(1):763.
[95] Roeland EJ, Phull H, Hagmann C, Sera C, Dullea AD, El-Jawahri A, et al. FIT: Functional and imaging testing for patients with metastatic cancer. Support Care Cancer. 2021 May;29(5):2771-75.10.1007/s00520-020-05730-4
[96] Oflazoglu U, Alacacioglu A, Varol U, Kucukzeybek Y, Salman T, Taskaynatan H, et al. Chemotherapy-induced sarcopenia in newly diagnosed cancer patients: Izmir Oncology Group (IZOG) study. Support Care Cancer. 2020;28(6):2899–910. https://doi.org/10.1007/s00520-019-05165-6
[97] Daly LE, Power DG, O’Reilly A, Donnellan P, Cushen SJ, O’Sullivan K, et al. The impact of body composition parameters on ipilimumab toxicity and survival in patients with metastatic melanoma. Br J Cancer. 2017;116(3):310–7. https://doi.org/10.1038/bjc.2016.431
[98] Chen J, Huang X, Wei Q, Liu S, Song W, Liu M. The relationship between systemic therapies and low skeletal muscle mass in patients with intermediate and advanced hepatocellular carcinoma. Front Immunol. 2025;16:1557839. https://doi.org/10.3389/fimmu.2025.1557839
[99] Shigefuku R, Iwasa M, Tanaka H, Tsukimoto M, Tamai Y, Fujiwara N, et al. Prognostic significance of psoas muscle index in unresectable hepatocellular carcinoma: comparative analysis of lenvatinib and atezolizumab plus bevacizumab. J Clin Med. 2024;13(19):1–12. https://doi.org/10.3390/jcm13195925
[100] Okuno M, Goumard C, Kopetz S, Vega EA, Joechle K, Mizuno T, et al. Loss of muscle mass during preoperative chemotherapy as a prognosticator for poor survival in patients with colorectal liver metastases. Surgery (United States). 2019;165(2):329–36. https://doi.org/10.1016/j.surg.2018.07.031
[101] Nozawa H, Emoto S, Murono K, Shuno Y, Kawai K, Sasaki K, et al. Change in skeletal muscle index and its prognostic significance in patients who underwent successful conversion therapy for initially unresectable colorectal cancer: observational study. The Adv Gastroenterol 2020;13:1–14. 10.1177/https://doi.org/10.1177/1756284820971197
[102] Palle SS, Mollehave LT, Taheri-Kadkhoda Z, Johansen S, Larsen L, Hansen JW, et al. Multi-frequency bioelectrical impedance analysis (BIA) compared to magnetic resonance imaging (MRI) for estimation of fat-free mass in colorectal cancer patients treated with chemotherapy. Clin Nutr Espen. 2016;16:8–15. https://doi.org/10.1016/j.clnesp.2016.09.003
[103] Huemer F, Schlintl V, Hecht S, Hackl H, Melchardt T, Rinnerthaler G, et al. Regorafenib is associated with increased skeletal muscle loss compared to TAS-102 in metastatic colorectal cancer. Clin Colorectal Cancer. 2019;18(2):159–66.e3. https://doi.org/10.1016/j.clcc.2019.04.003
[104] Gallois C, Bourillon C, Auclin E, Artru P, Lièvre A, Lecomte T, et al. Skeletal muscle loss during chemotherapy and its association with survival and systemic treatment toxicity in metastatic colorectal cancer: An AGEO prospective multicenter study. Clin Res Hepatol Gastroenterol. 2021 Nov;45(6):1–9. https://doi.org/10.1016/j.clinre.2020.101603
[105] Jang MK, Park S, Park C, Doorenbos AZ, Go J, Kim S. Does neoadjuvant chemotherapy regimen affect sarcopenia status in patients with breast cancer? Breast. 2022;66:1–7. https://doi.org/10.1016/j.breast.2022.08.009
[106] Campbell KL, Lane K, Martin AD, Gelmon KA, McKenzie DC. Resting energy expenditure and body mass changes in women during adjuvant chemotherapy for breast cancer. Cancer Nurs. 2007;30(2): 95–100. https://doi.org/10.1097/01.NCC.0000265004.64440.5f
[107] Jung GH, Kim JH, Chung MS. Changes in weight, body composition, and physical activity among patients with breast cancer under adjuvant chemotherapy. Eur J Oncol Nurs. 2020;44:101680. https://doi.org/10.1016/j.ejon.2019.101680
[108] Camilleri GM, Delrieu L, Bouleuc C, Pierga JY, Cottu P, Berger F, et al. Prevalence and survival implications of malnutrition and sarcopenia in metastatic breast cancer: a longitudinal analysis. Clin Nutr. 2024;43(8):1710–8. https://doi.org/10.1016/j.clnu.2024.06.014
[109] Zhang Y, Kang H, Zhao J, Wang Y, Cai W, Zhang X, et al. Neoadjuvant therapy increases the risk of metabolic disorders and osteosarcopenia in patients with early breast cancer. Jpn J Clin Oncol. 2024;54(9):959–66. https://doi.org/10.1093/jjco/hyae070
[110] Rossi F, Lambertini M, Brunetti N, De Giorgis S, Razeti MG, Calabrese M, et al. Muscle mass loss in breast cancer patients of reproductive age (≤ 45 years) undergoing neoadjuvant chemotherapy. Radiol Med. 2023;128(1):49–57. https://doi.org/10.1007/s11547-022-01574-6
[111] Karaca M, Alemdar MS, Deniz Karaca Ö, Kılar Y, Köker G, Sözel H, et al. Sarcopenia’s role in neoadjuvant chemotherapy outcomes for locally advanced breast cancer: a retrospective analysis. Med Sci Monit. 2024;30:e945240. https://doi.org/10.12659/MSM.945240
[112] Lee BM, Cho Y, Kim JW, Ahn SG, Kim JH, Jeung HC, et al. Association between skeletal muscle loss and the response to neoadjuvant chemotherapy for breast cancer. Cancers. 2021;13(8):1–14. https://www.mdpi.com/2072-6694/13/8/1806
[113] Rossi F, Torri L, Lambertini M, De Giorgis S, Calabrese M, Tagliafico AS. Muscle mass loss after neoadjuvant chemotherapy in breast cancer: estimation on breast magnetic resonance imaging using pectoralis muscle area. Eur Radiol. 2020;30(8):4234–41. https://doi.org/10.1007/s00330-020-06799-5
[114] Mazzuca F, Onesti CE, Roberto M, Di Girolamo M, Botticelli A, Begini P, et al. Lean body mass wasting and toxicity in early breast cancer patients receiving anthracyclines. Oncotarget. 2018;9(39):25714–22. https://doi.org/10.18632/oncotarget.25394
[115] Xiao DY, Luo S, O’Brian K, Sanfilippo KM, Ganti A, Riedell P, et al. Longitudinal body composition changes in diffuse large b-cell lymphoma survivors: a retrospective cohort study of United States veterans. J Natl Cancer Inst. 2016;108(11):1–7. https://doi.org/10.1093/jnci/djw145