ORIGINAL ARTICLE
Advancing endodontic imaging: a high-resolution comparison between CBCT and micro-CT in the danger zone
Gabriel de Toledo Telles-Araujoa  , Raimundo Sales de Oliveira Netob , Mariana Quirino Silveira Soaresc , Heitor Marques Honóriod , Viviane Almeida Sarmentoe , Marco Antônio Hungaro Duarteb and Izabel Regina Fischer Rubira-Bullenf
aSchool of Medicine, Federal University of Bahia, Salvador, Brazil; bDepartment of Operative Dentistry, Endodontics, and Dental Materials, Bauru School of Dentistry, University of São Paulo, Bauru, Brazil; cOral Radiology Division, São Leopoldo Mandic Research Institute, Campinas, Brazil; dDepartment of Pediatric Dentistry, Orthodontics and Public Health, Bauru School of Dentistry, University of São Paulo, Bauru, Brazil; eSchool of Dentistry, Federal University of Bahia, State University of Feira de Santana, Bahia, Brazil; fDepartment of Surgery, Stomatology, Pathology and Radiology, Bauru School of Dentistry, University of São Paulo, Bauru, Brazil
ABSTRACT
Objective: This study evaluated the accuracy of cone-beam computed tomography (CBCT) protocols for measuring submillimetric dentin thickness in the danger zone (DZ) of mandibular molars, using micro-computed tomography (micro-CT) as the reference standard.
Materials and methods: Fifty-one extracted mandibular molars were scanned using micro-CT and two CBCT devices under different acquisition protocols (Standard, High Fidelity, High Resolution [HIRE], and Imaging System [i-CAT]). After three-dimensional image registration, dentin thickness in the DZ, located 2 mm below the furcation, was measured in both mesial canals.
Results: All CBCT protocols significantly underestimated dentin thickness compared with micro-CT (p < 0.05), with discrepancies ranging from 4.5 to 8.6%. Underestimation was more pronounced in the mesiolingual canal. The HIRE protocol (0.125 mm voxel size) showed the smallest discrepancy, whereas the i-CAT protocol showed the largest.
Conclusion(s): CBCT systematically underestimates dentin thickness in the DZ and is not metrically equivalent to micro-CT for submillimetric measurements. Measurement accuracy is influenced by acquisition parameters and cannot be explained by voxel size alone.
KEYWORDS: Cone-beam computed tomography; danger zone; endodontics; micro-computed tomography; root canal
Citation: BIOMATERIAL INVESTIGATIONS IN DENTISTRY 2026, VOL. 13, 638–646. https://doi.org/10.2340/biid.v13.46618.
Copyright: © 2026 The Author(s). Published by MJS Publishing on behalf of Acta Odontologica Scandinavica Society. This is an Open Access article distributed under the terms of the Creative Commons Attribution 4.0 International License (http://creativecommons.org/licenses/by/4.0/), allowing third parties to copy and redistribute the material in any medium or format and to remix, transform, and build upon the material, with the condition of proper attribution to the original work.
Received: 11 May 2026; Accepted: 24 July 2026; Published: 05 August 2026
CONTACT: Raimundo Sales de Oliveira Neto, E-mail: raimundoneto@usp.br Department of Dentistry, Endodontics and Dental Materials, University of São Paulo, Al. Octávio Pinheiro Brizolla 9-75, CEP: 17012-901 Vila Universitária, Bauru, São Paulo, Brazil
Competing interests and funding: The authors deny any conflict of interest.
This study was funded by Brazilian Federal Agency for Support and Evaluation of Graduate Education (CAPES Foundation – Process number: 001).
Introduction
Micro-computed tomography (micro-CT) serves as the gold standard in ex vivo endodontic research, enabling highly accurate anatomical assessments [1–4]. However, its lack of clinical applicability has prompted the use of cone-beam computed tomography (CBCT) as a clinical alternative, necessitating validation studies against the micro-CT benchmark [1, 3, 5–8]. While the general utility of CBCT in endodontics is well established [9–11], recent technological advancements – such as smaller voxel sizes and higher spatial resolution – have enabled the visualization of submillimetric structures. Consequently, research has increasingly focused on evaluating CBCT’s accuracy for these detailed measurements, where image acquisition protocols are critical determinants of reliability [1, 10–13].
The complex anatomy of mandibular molars presents a considerable challenge in endodontic treatment. These teeth generally feature two roots: a mesial root that is flattened mesiodistally and widened buccolingually, and a typically straighter distal root containing one or two root canals [1, 14, 15]. A critical area of concern is the danger zone (DZ), the thin distal dentin wall of the mesial root adjacent to the furcation. This region’s inherently reduced dentin thickness renders it highly susceptible to iatrogenic complications like root perforation and vertical fractures during mechanized instrumentation [16].
Although interest in comparing dentin thickness between micro-CT and CBCT is growing, such studies demand rigorous methodologies. While micro-CT remains the gold standard for endodontic morphological assessment due to its superior resolution (19–41 μm) and ability to accurately define anatomical complexities such as lateral canals and apical deltas, its exclusive ex vivo application limits its direct clinical utility [17]. In contrast, CBCT offers a clinically viable, non-invasive alternative for in vivo assessment, demonstrating a strong correlation with micro-CT for dentin thickness measurement (intraclass correlation coefficient [ICC] = 0.988) [5].
However, a critical and clinically significant knowledge gap persists: all CBCT protocols, irrespective of field of view (FOV) or voxel size, systematically overestimate dentin thickness in the DZ compared to micro-CT, creating a false sense of security during root canal instrumentation [18]. The existing literature has documented this overestimation but has not yet provided validated correction factors or calibration methods to compensate for this systematic error. Furthermore, there is a notable absence of standardized measurement protocols, evidenced by a lack of consensus on specific anatomical landmarks and methodologies for evaluating the DZ [18].
To address these limitations, this study aims to evaluate measurement discrepancies of the mandibular molar DZ between micro-CT and various CBCT protocols, assessing their reliability for endodontic applications. Specifically, by establishing a correction model and a standardized measurement protocol, this research aims to translate the accuracy of micro-CT reference data into a clinically applicable framework, thereby enhancing the safety and reliability of CBCT-guided endodontic procedures.
Materials and methods
The manuscript of this laboratory study has been written according to Preferred Reporting Items for Laboratory studies in Endodontology (PRILE) 2021 guidelines – Figure 1 [19].
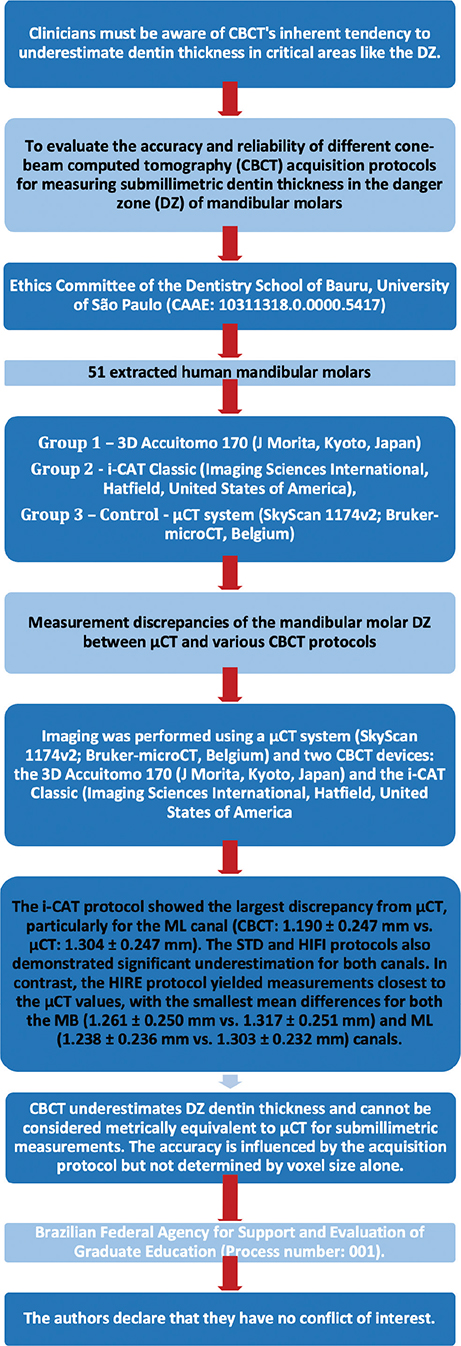
Figure 1. PRILE 2021 flowchart. CBCT: cone-beam computed tomography; micro-CT: micro-computed tomography; STD: Standard; HIFI: High Fidelity; HIRE: High Resolution; i-CAT: Imaging System; DZ: danger zone; MB: mesiobuccal; ML: mesiolingual.
Sample selection
This study was approved by the local ethics committee. A power analysis was conducted a priori using G*Power software (v. 3.1 for Mac) with data from a previous study [1]. For a Wilcoxon/Mann-Whitney test, a sample size of 51 achieved 80% power (β = 0.20) to detect an effect size of 0.67 with an alpha level of 0.05. The Mann-Whitney test was selected for the sample size calculation as it provides a conservative estimate that does not rely on assumptions about the underlying data distribution. A sample of 51 extracted human mandibular molars was selected from a Brazilian population. Teeth were extracted due to periodontal disease, caries, or coronal fractures, and those with root fractures, resorption, calcifications, incomplete rhizogenesis, or prior endodontic treatment were excluded. Patient age and sex were not recorded.
CBCT and micro-CT scanning
All teeth were coated with utility wax (Tenatex Red, Associated Dental Products Ltd, Kemdent Works, United Kingdom) to simulate the periodontal ligament space and mounted in the prepared alveoli of dry human jaws. The jaws themselves were externally coated with three layers of wax to mimic soft tissue. Imaging was performed using a micro-CT system (SkyScan 1174v2; Bruker-microCT, Belgium) and two CBCT devices: the 3D Accuitomo 170 (J Morita, Kyoto, Japan) and the Imaging System (i-CAT) Classic (Imaging Sciences International, Hatfield, United States of America). The detailed acquisition parameters for all scanners are provided in Table 1.
Sample analysis
All images were analyzed in a darkened room on a dedicated workstation with a high-resolution monitor (EIZO FlexScan S2000, 1600 × 1200 pixels; EIZO NANAO Corporation, Hakusan, Japan).
The CBCT scans were exported in Digital Imaging and Communications in Medicine (DICOM) format. A Volume of Interest (VOI) was selected, and three-dimensional intermodal registration between the CBCT and micro-CT datasets was performed using DataViewer software (Bruker-microCT). This registration involved manual alignment based on anatomical landmarks to ensure optimal spatial correspondence and minimize errors. To verify the accuracy of the three-dimensional registration procedure, the alignment was visually inspected in all three orthogonal planes (axial, sagittal, and coronal) for each specimen. The registered images were then exported in bitmap (BMP) format for subsequent measurement.
Linear measurements of the DZ were performed 2 mm below the bifurcation using CT-Analyser software (v.1.12, Bruker-microCT). On the axial slice, a line was drawn connecting the mesiobuccal (MB) and mesiolingual (ML) canals. A second line was drawn from the midpoint of this first line, perpendicularly towards the furcation, to measure the dentin thickness (Figure 2). This procedure was repeated for all CBCT acquisition protocols (Standard [STD], High Fidelity [HIFI], High Resolution [HIRE], and i-CAT), with the micro-CT measurements serving as the reference standard.
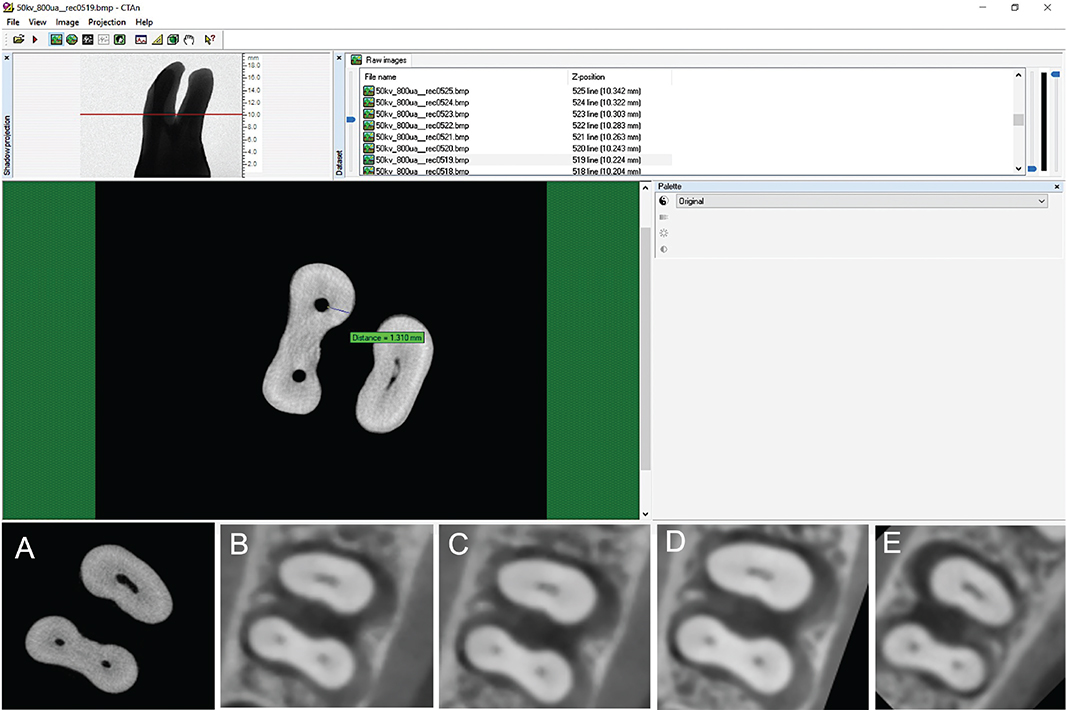
Figure 2. CTAn (v.1.12, Bruker-microCT) and visualization of the software interface, showing measurements in the DZ. Bottom: CBCT protocols (A) micro-CT; (B) STD; (C) HIFI; (D) HIRE; (E) i-CAT. CBCT: cone-beam computed tomography; micro-CT: micro-computed tomography; STD: Standard; HIFI: High Fidelity; HIRE: High Resolution; i-CAT: Imaging System; DZ: danger zone.
Statistical analysis
Intraobserver agreement was evaluated using the ICC. For this purpose, a random subset comprising 20% of the sample was re-evaluated by the same examiner after a 30-day interval under identical conditions. The data were analyzed using SPSS (v.15.0, IBM, New York, United States of America) and Statistica software (v.12, TIBCO Software Inc., Palo Alto, CA, United States of America). The agreement between micro-CT and the different CBCT protocols was assessed using Bland-Altman analysis and linear regression. The final analysis employed paired t-tests after confirming normality of the paired differences (Shapiro-Wilk test, p > 0.05).
Results
All CBCT protocols consistently underestimated dentin thickness in the DZ compared to the micro-CT reference. When analyzed by canal, the ML canal exhibited greater underestimation than the MB canal across all protocols. The degree of underestimation varied by protocol. The i-CAT protocol showed the largest discrepancy from micro-CT, particularly for the ML canal (CBCT: 1.190 ± 0.247 mm vs. micro-CT: 1.304 ± 0.247 mm). The STD and HIFI protocols also demonstrated significant underestimation for both canals. In contrast, the HIRE protocol yielded measurements closest to the micro-CT values, with the smallest mean differences for both the MB (1.261 ± 0.250 mm vs. 1.317 ± 0.251 mm) and ML (1.238 ± 0.236 mm vs. 1.303 ± 0.232 mm) canals. Considering the mean values of the dentin thickness of the different protocols for the acquisition of the CBCT in comparison with the values obtained in micro-CT, a submillimetric underestimation of the values was observed in all protocols, with the HIRE protocol being the least underestimated (4.5%). The other values are shown in Figure 3.

Figure 3. Bars represent the mean root dentin thickness obtained from the pooled measurements of the MB and ML canals at the three evaluated levels. Because these values correspond to pooled means derived from multiple anatomical locations, variability measures (SD or 95% confidence intervals) are presented in Tables 2–5 rather than in this summary figure. MB: mesiobuccal; ML: mesiolingual; CBCT: cone-beam computed tomography; micro-CT: Microcomputed Tomography; STD: Standard; HIFI: High Fidelity; HIRE: High Resolution; i-CAT: Imaging System.
A summary of the overall root dentin thickness measurements, including the mean values and the corresponding mean differences between micro-CT and each CBCT protocol, is presented in Tables 2–5. Detailed results are also provided according to canal (MB and ML) and anatomical measurement site (furcation, 2 mm, and 3 mm apical to the furcation). Overall, all CBCT protocols significantly underestimated root dentin thickness compared with the micro-CT reference (all p < 0.001).
The degree of agreement of measurements calculated by the Bland-Altman method showed that points of the present sample are located within the upper and lower (95%) confidence limits (mean standard deviation of 1.96). However, the differences were homogeneously distributed around an average value distant from zero, confirming that there was no agreement between CBCT and micro-CT (Figure 4). Likewise, from the linear regression test, it was concluded that there is no proportion bias between the gold standard (micro-CT) and the different protocols of the CBCT.
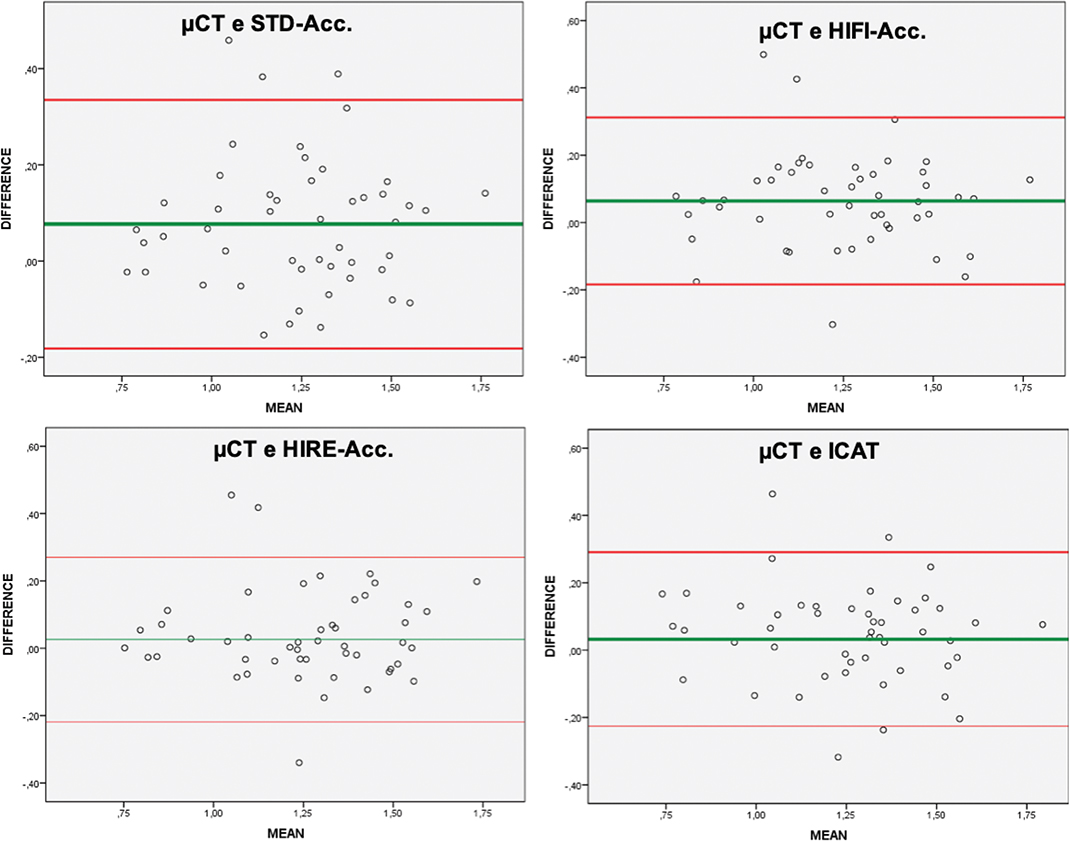
Figure 4. Bland-Altman plots with measurements of root dentin thickness between micro-CT and CBCT images. The green line represents the mean of the differences, and the limits of agreement are indicated by horizontal red lines. The mean difference was significantly different from zero, indicating a systematic bias between the methods and suggesting limited agreement, rather than interchangeability. CBCT: cone-beam computed tomography; micro-CT: micro-computed tomography; STD: Standard; HIFI: High Fidelity; HIRE: High Resolution; i-CAT: Imaging System.
Discussion
This study evaluated the accuracy of various CBCT acquisition protocols for linear measurements against the micro-CT gold standard. All CBCT protocols underestimated dentin thickness, with discrepancies ranging from 4.5 to 8.6%. This degree of underestimation could be clinically significant in cases where the DZ is naturally thin prior to intervention. The STD protocol showed the highest underestimation (8.6%), a finding consistent with previous studies reporting similar slight underestimations of CBCT compared to µCT [5, 6, 20].
While the paired t-test detected statistically significant differences between CBCT and micro-CT measurements (p < 0.05), this statistical significance does not automatically imply clinical relevance. The observed discrepancies ranged from 4.5 to 8.6%, which may appear modest in absolute terms. However, when applied to the clinical context of endodontic instrumentation, even these small differences can be meaningful, particularly in cases where the preoperative dentin thickness approaches critical thresholds. Preoperative assessment of dentin thickness in the DZ is critical for planning conservative instrumentation and avoiding iatrogenic complications. The literature recommends limiting instrumentation to a maximum of 0.5 mm and maintaining a minimum residual dentin thickness of 0.2–0.3 mm to prevent perforations and vertical root fractures [21, 22]. The underestimation observed in our CBCT data suggests that while CBCT is a valuable tool, its measurements may lack the absolute reliability required for precise decision-making in cases of pre-existing minimal dentin thickness. For instance, the mean DZ thickness measured with the STD protocol was 1.186 mm. Subtracting the maximum recommended preparation of 0.5 mm would leave a theoretical safety margin that is approximately twice the recommended minimum. While this appears safe on average, the inherent underestimation of CBCT means the true remaining dentin could be even less than calculated, potentially eroding this safety margin in individual cases. A dentin thickness of 0.5 mm measured by CBCT, for example, could correspond to a true thickness of approximately 0.46–0.48 mm (depending on the protocol), a difference that, while numerically small, represents a reduction of 5–9% of the available dentin. In teeth with naturally thin DZ approaching the 0.3 mm threshold, this discrepancy could be the difference between a safe procedure and a perforation. This concern is amplified by micro-CT evidence demonstrating that instrumentation systems can induce microcracks in roots with already reduced dentin thickness [23]. Therefore, while the absolute differences are modest, their clinical impact depends on the baseline dentin thickness and the specific clinical scenario. A cautious interpretation of CBCT-based measurements is imperative, reinforcing the need for conservative preparation strategies in these vulnerable areas.
A paired t-test and Bland-Altman analysis were employed to evaluate the agreement between CBCT and micro-CT, following established methodologies [1, 5, 24]. Unlike correlation, which is often misapplied in method-comparison studies [25, 26], Bland-Altman analysis assesses interchangeability by defining the limits of agreement. Our analysis demonstrated that the methods are not interchangeable for submillimetric measurements. Although data points fell within the 95% confidence limits, the mean difference was significantly different from zero, revealing a systematic bias rather than a complete lack of agreement. This finding indicates that CBCT consistently underestimates dentin thickness relative to micro-CT, with the bias varying by protocol (ranging from 4.5 to 8.6%). While the presence of data points within the limits might suggest some level of agreement, the consistent deviation of the mean difference from zero confirms that CBCT and micro-CT are not metrically equivalent. Importantly, this systematic bias is predictable and, if properly accounted for, may still allow CBCT to serve as a useful clinical tool. The critical distinction is that the relationship between the methods is characterized by limited agreement due to a fixed bias, rather than by random error or interchangeability.
The Bland-Altman analysis is particularly sensitive when measuring structures on a submillimeter scale. As noted in the literature, measurements approaching zero can compress the apparent limits of agreement, potentially creating a bias that masks the true clinical discrepancy [24]. Crucially, when the confidence limits of the agreement are wider than the structure being measured, the imaging protocol lacks the necessary resolution for accurate assessment. This principle directly applies to our investigation of the DZ. The fact that even the highest-resolution protocol (HIRE, 0.125 mm voxel size) demonstrated a consistent underestimation confirms that current CBCT spatial resolution remains a fundamental limitation for reliably measuring these delicate anatomical structures.
Regarding the measurement of root dentin thickness, the examiner showed excellent intra-examiner agreement, with a mean ICC value of 0.92. This data demonstrates the examiner’s reliability, ensuring the accuracy of the measurement results in this work. Studies that also compared CBCT technology with micro-CT found ICCs greater than 0.90, similar to the present study [5, 6, 8].
All CBCT protocols in this study yielded measurements significantly different from the µCT gold standard, confirming a fundamental limitation for submillimetric assessment. While protocol parameters like voxel size, FOV, and radiation dose collectively influence diagnostic accuracy [12], our results demonstrate that voxel size alone is insufficient to ensure accuracy. This is consistent with the broader limitations of CBCT technology. For instance, Tolentino et al. [1] reported that even a 0.08 mm voxel size failed to detect apical isthmuses, attributing this to detector limitations and the partial volume effect. This phenomenon, where a single voxel averages the densities of different materials, becomes critical when the voxel size is larger than the fine detail being measured [1, 27], such as the thin dentin walls of the DZ. Our findings align with this principle. The HIRE protocol (0.125 mm voxel) showed the least underestimation, yet a significant discrepancy remained. Furthermore, larger voxel sizes (HIFI, STD, i-CAT) did not cause a proportional loss of structural visualizability. This pattern indicates that inherent imaging artifacts – noise and the partial volume effect – have a greater impact on measurement accuracy than voxel size in isolation [19, 28]. This is compounded by FOV selection; larger FOVs (e.g. i-CAT) often sacrifice resolution, while limited FOVs (e.g. Accuitomo 170) optimize it for localized areas [26]. Consequently, even high-resolution CBCT protocols face spatial resolution challenges that limit reliable measurement of delicate structures like the DZ.
Since CBCT remains an essential clinical tool, its measurements must be interpreted with caution in critical anatomical regions like the DZ. The use of CBCT for submillimetric measurements should account for the possibility of underestimation, and clinical decisions should be based not only on these values but also on the clinician’s expertise and complementary assessments. This concern is supported by recent CBCT-based anatomical studies, which emphasize the importance of evaluating dentin thickness carefully in the DZ to prevent complications such as perforations and [16]. This anatomical vulnerability is not exclusive to mandibular molars; studies on maxillary molars have also shown reduced dentin thickness in regions such as the MB2 canal, emphasizing the need for caution during instrumentation across different molar types [29].
Anatomical studies have demonstrated considerable variability in the vertical position of the DZ, with minimum dentin thickness often occurring in the middle third of the root at levels ranging from 2 to 6 mm apical to the furcation, depending on individual root morphology, groove depth, and tooth length [18]. Nevertheless, the 2 mm level was adopted in the present study for several reasons. This measurement level represents a reproducible anatomical landmark that can be reliably identified on both CBCT and micro-CT images, as the furcation provides a consistent radiographic reference point. Moreover, this level has been widely employed in previous CBCT versus micro-CT comparison studies, allowing direct comparability of our findings with the existing literature [18, 30]. Furthermore, the 2 mm level corresponds to the coronal aspect of the middle third of the root, a region of particular clinical relevance, as it is frequently accessed during mechanical instrumentation and represents the area where iatrogenic complications such as perforation are most likely to occur. While we acknowledge that the true DZ may be located at different levels in individual teeth, the use of a single standardized measurement point was essential to ensure methodological consistency across protocols and to enable meaningful statistical comparisons. Future investigations incorporating multi-level assessments (e.g. 2, 4, and 6 mm) would further elucidate the three-dimensional distribution of dentin thickness in the DZ and could inform more individualized clinical decision-making.
Some limitations should be acknowledged, although several are inherent to the study design. The ex vivo nature of this investigation, while essential for establishing micro-CT as the gold standard reference, may not fully replicate the clinical environment due to factors such as patient movement and the presence of surrounding anatomical structures. The sample was restricted to mandibular molars, which limits generalizability to other tooth groups, though this focus allowed for detailed, standardized assessment of a clinically relevant and anatomically challenging region [29]. Similarly, the evaluation of only two CBCT systems (Accuitomo 170 and i-CAT Classic) reflects a pragmatic choice, as these represent commonly used devices with distinct detector technologies, yet our findings may not extend to other manufacturers [5]. Measurements were performed by a single trained examiner, precluding interobserver reliability assessment; however, the high intraobserver agreement (ICC = 0.92) supports measurement consistency. The analysis was restricted to a single measurement level (2 mm below the bifurcation), a methodological choice adopted from established protocols to enable comparability with prior studies [1, 18], though the DZ may extend along multiple root levels. Although soft tissue simulators helped approximate clinical conditions, limitations include the absence of metallic restorative materials (which may degrade CBCT image quality) and the lack of formal quantitative registration error assessment, though manual registration was visually inspected in all orthogonal planes. [1, 5, 31]. Despite these limitations, the systematic and consistent nature of the observed measurement bias across protocols strengthens the validity of our findings and supports the clinical recommendations provided.
Conclusion
Under the specific experimental conditions of this study, all CBCT protocols significantly underestimated dentin thickness in the DZ compared to the micro-CT reference standard, with discrepancies ranging from 4.5 to 8.6%. While the HIRE protocol (0.125 mm voxel) demonstrated the smallest discrepancy, no CBCT protocol achieved metric equivalence to micro-CT for these submillimetric measurements. Therefore, within the scope of this investigation, caution is recommended when interpreting dentin thickness values obtained by CBCT for preoperative assessment of the DZ in mandibular molars, as even small differences could impact the safety of endodontic instrumentation.
Acknowledgements
The authors would like to thank the Brazilian Federal Agency for Support and Evaluation of Graduate Education.
Authors’ contributions
Conceptualization: Telles-Araujo GB, Oliveira-Neto RS, Soares MQS, Honório HM, Sarmento VA, Duarte MAH, Rubira-Bullen IRF. Data curation: Telles-Araujo GB, Oliveira-Neto RS, Soares MQS, Honório HM, Sarmento VA, Duarte MAH, Rubira-Bullen IRF. Formal analysis: Telles-Araujo GB, Oliveira-Neto RS, Soares MQS, Honório HM, Sarmento VA, Duarte MAH, Rubira-Bullen IRF. Funding acquisition: Duarte MAH, Rubira-Bullen IRF. Investigation: Telles-Araujo GB, Oliveira-Neto RS, Soares MQS, Honório HM, Sarmento VA, Duarte MAH, Rubira-Bullen IRF. Methodology: Telles-Araujo GB, Oliveira-Neto RS, Soares MQS, Honório HM, Sarmento VA, Duarte MAH, Rubira-Bullen IRF. Project administration: Duarte MAH, Rubira-Bullen IRF. Resources: Duarte MAH, Rubira-Bullen IRF. Software: Duarte MAH, Rubira-Bullen IRF. Supervision: Duarte MAH, Rubira-Bullen IRF. Validation: Duarte MAH, Rubira-Bullen IRF. Visualization: Telles-Araujo GB, Oliveira-Neto RS, Soares MQS, Honório HM. Writing – original draft: Telles-Araujo GB, Oliveira-Neto RS, Soares MQS, Honório HM, Sarmento VA, Duarte MAH, Rubira-Bullen IRF. Writing – review & editing: Oliveira-Neto RS, Duarte MAH, Rubira-Bullen IRF.
Data availability statement
Data available on request from the authors.
References
[1] Tolentino ES, Amoroso-Silva PA, Alcalde MP, Honório HM, Iwaki LCV, Rubira-Bullen IRF, et al. Accuracy of high-resolution small-volume cone-beam computed tomography in detecting complex anatomy of the apical isthmi: an ex vivo analysis. J Endod. 2018;44(12):1862–6. https://doi.org/10.1016/j.joen.2018.08.015
[2] Villas-Bôas MH, Bernardineli N, Cavenago BC, Marciano M, Del Carpio-Perochena A, de Moraes IG, et al. Micro-computed tomography study of the internal anatomy of mesial root canals of mandibular molars. J Endod. 2011;37(12):1682–6. https://doi.org/10.1016/j.joen.2011.08.001
[3] Van Dessel J, Huang Y, Depypere M, Rubira-Bullen I, Maes F, Jacobs R. A comparative evaluation of cone beam CT and micro-CT on trabecular bone structures in the human mandible. Dentomaxillofac Radiol. 2013;42(8):20130145. https://doi.org/10.1259/dmfr.20130145
[4] Harris SP, Bowles WR, Fok A, McClanahan SB. An anatomic investigation of the mandibular first molar using micro-computed tomography. J Endod. 2013;39(11):1374–8. https://doi.org/10.1016/j.joen.2013.06.034
[5] Xu J, He J, Yang Q, Huang D, Zhou X, Peters OA, Gao Y. Accuracy of cone-beam computed tomography in measuring dentin thickness and its potential of predicting the remaining dentin thickness after removing fractured instruments. J Endod. 2017;43(9):1522–7. https://doi.org/10.1016/j.joen.2017.03.041
[6] Maret D, Molinier F, Braga J, Peters OA, Telmon N, Treil J, et al. Accuracy of 3D reconstructions based on cone beam computed tomography. J Dent Res. 2010;89(12):1465–9. https://doi.org/10.1177/0022034510378011
[7] Acar B, Kamburoğlu K, Tatar İ, Arıkan V, Çelik HH, Yüksel S, et al. Comparison of micro-computerized tomography and cone-beam computerized tomography in the detection of accessory canals in primary molars. Imaging Sci Dent. 2015;45(4):205–11. https://doi.org/10.5624/isd.2015.45.4.205
[8] Ordinola-Zapata R, Martins JNR, Niemczyk S, Bramante CM. Apical root canal anatomy in the mesiobuccal root of maxillary first molars: influence of root apical shape and prevalence of apical foramina – a micro-CT study. Int Endod J. 2019;52(8):1218–27. https://doi.org/10.1111/iej.13109
[9] Patel S, Durack C, Abella F, Shemesh H, Roig M, Lemberg K. Cone beam computed tomography in Endodontics – a review. Int Endod J. 2015;48(1):3–15. https://doi.org/10.1111/iej.12270
[10] Estrela C, Rabelo LE, de Souza JB, Alencar AH, Estrela CR, Sousa Neto MD, et al. Frequency of root canal isthmi in human permanent teeth determined by cone-beam computed tomography. J Endod. 2015;41(9):1535–9. https://doi.org/10.1016/j.joen.2015.05.016
[11] Tahmasbi M, Jalali P, Nair MK, Barghan S, Nair UP. Prevalence of middle mesial canals and isthmi in the mesial root of mandibular molars: an in vivo cone-beam computed tomographic study. J Endod. 2017;43(7):1080–3. https://doi.org/10.1016/j.joen.2017.02.008
[12] Hassan BA, Payam J, Juyanda B, van der Stelt P, Wesselink PR. Influence of scan setting selections on root canal visibility with cone beam CT. Dentomaxillofac Radiol. 2012;41(8):645–8. https://doi.org/10.1259/dmfr/27670911
[13] Kamburoglu K, Onder B, Murat S, Avsever H, Yüksel S, Paksoy CS. Radiographic detection of artificially created horizontal root fracture using different cone beam CT units with small fields of view. Dentomaxillofac Radiol. 2013;42(4):20120261. https://doi.org/10.1259/dmfr.20120261
[14] Sousa VC, Alencar AHG, Bueno MR, Decurcio DA, Estrela CRA, Estrela C. Evaluation in the danger zone of mandibular molars after root canal preparation using novel CBCT software. Braz Oral Res. 2022;36:e038. https://doi.org/10.1590/1807-3107bor-2022.vol36.0038
[15] Silva EJ, Nejaim Y, Silva AV, Haiter-Neto F, Cohenca N. Evaluation of root canal configuration of mandibular molars in a Brazilian population by using cone-beam computed tomography: an in vivo study. J Endod. 2013;39(7):849–52. https://doi.org/10.1016/j.joen.2013.04.030
[16] Bolbolian M, Ramezani M, Valadabadi M, Alizadeh A, Tofangchiha M, Ghonche MRA, et al. Dentin thickness of the danger zone in the mesial roots of the mandibular molars: a cone beam computed tomography analysis. Front Biosci (Schol Ed). 2023;15(1):3. https://doi.org/10.31083/j.fbs1501003
[17] Pires M, Martins JNR, Pereira MR, Vasconcelos I, Costa RPD, Duarte I, et al. Diagnostic value of cone beam computed tomography for root canal morphology assessment – a micro-CT based comparison. Clin Oral Investig. 2024;28(3):201. https://doi.org/10.1007/s00784-024-05580-y
[18] Ferrari DR, Reis TMS, Junqueira RB, Kamburoğlu K, Küçük Ö, Verner FS. Is the assessment of the mandibular molar danger zone affected by field of view and voxel size in cone beam computed tomography examinations? Oral Surg Oral Med Oral Pathol Oral Radiol. 2024;137(6):662–70. https://doi.org/10.1016/j.oooo.2024.02.007
[19] Nagendrababu V, Murray PE, Ordinola-Zapata R, Peters OA, Rôças IN, Siqueira JF, Jr, et al. PRILE 2021 guidelines for reporting laboratory studies in endodontology: a consensus-based development. Int Endod J. 2021;54(9):1482–90. https://doi.org/10.1111/iej.13542
[20] Ferrare N, Leite AF, Caracas HC, de Azevedo RB, de Melo NS, de Souza Figueiredo PT. Cone-beam computed tomography and microtomography for alveolar bone measurements. Surg Radiol Anat. 2013;35(6):495–502. https://doi.org/10.1007/s00276-013-1080-x
[21] Zhou G, Leng D, Li M, Zhou Y, Zhang C, Sun C, et al. Root dentine thickness of danger zone in mesial roots of mandibular first molars. BMC Oral Health. 2020;20(1):43. https://doi.org/10.1186/s12903-020-1026-8
[22] Lim SS, Stock CJ. The risk of perforation in the curved canal: anticurvature filing compared with the stepback technique. Int Endod J. 1987;20(1):33–9. https://doi.org/10.1111/j.1365-2591.1987.tb00586.x
[23] Yüksel BN, Öncü A, Çelİkten B, Bİlecenoğlu B, Orhan AI, Orhan K. Micro-CT evaluation of ‘danger zone’ and microcrack formation in mesial root canals of primary teeth with single-file rotary and reciprocating systems. Int J Paediatr Dent. 2022;32(1):109–15. https://doi.org/10.1111/ipd.12800
[24] Patcas R, Müller L, Ullrich O, Peltomäki T. Accuracy of cone-beam computed tomography at different resolutions assessed on the bony covering of the mandibular anterior teeth. Am J Orthod Dentofacial Orthop. 2012;141(1):41–50. https://doi.org/10.1016/j.ajodo.2011.06.034
[25] Bland JM, Altman DG. Statistical methods for assessing agreement between two methods of clinical measurement. Lancet. 1986;1(8476):307–10. https://doi.org/10.1016/S0140-6736(86)90837-8
[26] Ludbrook J. Statistics in biomedical laboratory and clinical science: applications, issues and pitfalls. Med Princ Pract. 2008;17(1):1–13. https://doi.org/10.1159/000109583
[27] Özer NE, Ulusoy AC, İlhan B, Lindfors N, Boyacıoğlu H, Gröndahl HG. The influence of the field of view and voxel size on the contrast-to-noise ratio in cone-beam computed tomography imaging. Imaging Sci Dent. 2024;54(4):362–9. https://doi.org/10.5624/isd.20240096
[28] Molen AD. Considerations in the use of cone-beam computed tomography for buccal bone measurements. Am J Orthod Dentofacial Orthop. 2010;137(4 Suppl):S130–5. https://doi.org/10.1016/j.ajodo.2010.01.015
[29] Yanık D, Nalbantoğlu AM. Dentin thickness at danger zone and canal morphology of maxillary molars. Acta Stomatol Croat. 2022;56(1):50–60. https://doi.org/10.15644/asc56/1/6
[30] Ordinola-Zapata R, Martins JNR, Versiani MA, Bramante CM. Micro-CT analysis of danger zone thickness in the mesiobuccal roots of maxillary first molars. Int Endod J. 2019;52(4):524–9. https://doi.org/10.1111/iej.13025
[31] Scarfe WC, Farman AG, Sukovic P. Clinical applications of cone-beam computed tomography in dental practice. J Can Dent Assoc. 2006;72(1):75–80.