ORIGINAL ARTICLE
DURATION OF REHABILITATION THERAPY TO ACHIEVE A MINIMAL CLINICALLY IMPORTANT DIFFERENCE IN MOBILITY, WALKING ENDURANCE AND PATIENT-REPORTED PHYSICAL HEALTH: AN OBSERVATIONAL STUDY
Nicoline KOOL, MSc1, Jan KOOL, PhD1 and Stefan BACHMANN, MD1,2
From the 1Department of Rehabilitation Medicine, Kliniken Valens, Valens, Switzerland and 2Department of Geriatrics, Inselspital, University of Bern Hospital, Bern, Switzerland
Objective: To compare the duration of exercise therapy needed to achieve a minimal clinically important difference in mobility, walking endurance and patient-reported global physical health in patients referred for inpatient rehabilitation after knee surgery, hip surgery, or with multiple sclerosis or Parkinson’s disease.
Design: Retrospective pre-post intervention observational cohort study.
Subjects: A total of 388 patients (57% women, mean age 65.6 years (standard deviation 9.5)) with a minimum length of stay 10 days were included between 1 January 2020 and 30 April 2021.
Methods: Outcomes were assessed at the start of, and discharge from, rehabilitation, using the following measures: mobility (Timed Up and Go test), walking endurance (6-minute walk test), patient-reported global physical health (Global Physical Health subscale of the 10-item Patient-Reported Outcomes Measurement Information System). The duration of exercise therapy needed to achieve a minimal clinically important difference was determined using anchor-based and distribution-based methods.
Results: The duration of therapy needed to achieve a minimal clinically important difference was longer in patients with multiple sclerosis or Parkinson’s disease (18–88 h) than in patients after knee or hip surgery (8–25 h). In all patient groups, the duration of exercise therapy needed, determined using the distribution-based method, was shortest for patient-reported global physical health (knee surgery 9.6 h, hip surgery 6.8 h, multiple sclerosis 38.7 h, Parkinson’s disease 18.4 h).
Conclusion: The duration of active therapies required to achieve a minimal clinically important difference in physical outcomes varies widely (range 8–88 h) among different patient groups and outcomes.
LAY ABSTRACT
This study in an inpatient rehabilitation setting evaluated the duration of exercise therapy needed to achieve a clinically important difference in 3 outcome measures: mobility, walking endurance, and patient-reported global physical health. Results were compared between 4 groups: patients who had undergone knee surgery; patients who had undergone hip surgery; patients with multiple sclerosis; and those with Parkinson’s disease. The exercise duration required ranged from 8 to 88 h and was longer in patients with multiple sclerosis or Parkinson’s disease, which are chronic progressive neurological conditions, compared with patients who had had knee or hip surgery. In all groups, the duration of exercise therapy required to achieve a clinically important difference was shortest for patient-reported global physical health compared with mobility and walking endurance.
Key words: therapy dose; exercise; minimal clinically important difference; rehabilitation; outcome.
Citation: J Rehabil Med 2023; 55: jrm12322. DOI: https://doi.org/10.2340/jrm.v55.12322
Copyright: © Published by Medical Journals Sweden, on behalf of the Foundation for Rehabilitation Information. This is an Open Access article distributed under the terms of the Creative Commons Attribution-NonCommercial 4.0 International License (https://creativecommons.org/licenses/by-nc/4.0/)
Accepted: Sep 7, 2023; Published: Nov 21, 2023
Correspondence address: Stefan Bachmann, Rehabilitation Centre Valens, Taminaplatz 1, CH-7317 Valens, Switzerland. E-mail: stefan.bachmann@kliniken-valens.ch
Competing interests and funding: The authors have no conflicts of interest to declare.
Exercise therapy improves mobility, walking endurance, and patient-reported global physical health, which are central goals of inpatient rehabilitation. For patients who have undergone knee or hip surgery (1), or who have multiple sclerosis (MS) (2) or Parkinson’s disease (PD) (3–7), the effectiveness of exercise is supported by evidence from randomized controlled trials (RCTs) and meta-analyses. Early rehabilitation after knee surgery and hip surgery results in faster improvement in mobility and reduces overall costs (8, 9). In patients with MS, a chronic inflammatory disease of the central nervous system, exercise improves mobility and reduces the risk of losing important skills for maintaining independence in daily living (10). In patients with PD, one of the most common neurodegenerative diseases, mobility is improved by different forms of exercise training, including treadmill training, training of compensatory movement strategies, dancing, aerobic exercises, hydrotherapy, balance and gait training (3–7).
RCTs evaluating treatment effects in these patients use stringent inclusion and exclusion criteria for good reasons, such as to improve homogeneity in the study population, which increases statistical power and improves financial efficiency. However, as a consequence, patients included in RCTs are highly selected, with higher homogeneity resulting in larger treatment effect sizes in RCTs compared with patients in everyday healthcare. Using routine clinical data, clinical changes observed during the course of treatment are likely to be smaller, but more representative, than those found in RCTs. Interpretation of the relevance of changes in a clinical outcome measure is facilitated by comparison with the minimal clinically important difference (MCID) of that measure.
Because the strongest evidence is found for the effectiveness of exercise compared with other forms of therapy, the current study focuses on the relationship between the duration of exercise and changes in outcomes, excluding therapies that do not use exercise. Key outcomes in rehabilitation cover different, but interrelated, aspects of physical health. Mobility, evaluated with the Timed Up and Go test (TUG), covers standing up, walking a short distance, turning, walking back, and sitting down, which are basic aspects of mobility relevant for living independently at home. Walking endurance (evaluated with the 6-minute walk test; 6MWT) provides an indication of ability to perform activities outside the home. However, as capacity measures of mobility and walking endurance do not include patients’ perceptions, they are supplemented by evaluation of patient-reported global physical health, assessed using the 10-item Patient-Reported Outcomes Measurement Information System – Global Physical Health subscale (PROMIS-10-GPH).
The duration of exercise necessary to achieve a MCID in these outcomes is unknown; hence the objectives of the current study are: (i) to determine how many hours of exercise (dose) are necessary to achieve MCIDs in mobility (TUG), walking endurance (6MWT), and patient-reported global physical health (PROMIS-10-GPH); and (ii) to evaluate how results differ between 4 groups of patients: those who have undergone knee or hip surgery, and those with MS or PD.
METHODS
Design and inclusion criteria
A retrospective pre-post intervention observational cohort study was conducted using data from routine evaluation of outcome measures recorded at the start and before discharge from rehabilitation. Inclusion criteria were: patients admitted for inpatient rehabilitation at the Valens and Walenstadtberg clinics, Kliniken Valens, St Gallen, Switzerland, between 1 January 2020 and 30 April 2021. The following 4 diagnostic groups, which are highly prevalent in clinic, were included: patients who had undergone knee surgery or hip surgery referred for inpatient rehabilitation because of severe co-morbidity and restrictions in activities of daily living (ADL); persons with MS (independently walking with or without assistive devices, Expanded Disability Status Scale (EDSS) < 7); and persons with PD. Exclusion criteria were: patients who did not provide written informed consent for further use of their clinical data; and patients with a length of stay < 10 days mostly due to unforeseen discharge with acute illness.
Rehabilitation
After admission to the rehabilitation centre, a standardized assessment was performed, together with individual goal-setting to plan rehabilitation interventions. Improving physical health and mobility was a high-priority goal. Patients received a minimum of 10 h therapy per week, in 3–6 therapy sessions, with a duration of 20–60 min per day. Therapy was offered 6 days per week and a mean of 1.8 h exercise therapy was provided per day. Exercise was provided as part of the multidisciplinary management and based on current practice guidelines for treatment after knee and hip joint replacement in persons with osteoarthritis (1) and the treatment of persons with MS (2) and PD (7). Exercise included task-specific training of mobility and other ADL relevant to the patient, training of gait and balance, aerobic exercise to improve strength and endurance and external cueing in persons with PD. Exercise treatment was accompanied by provision of patient information. Other therapies were neuropsychological, social and dietary counselling, and patient education.
Outcomes
Primary outcomes and dependent variables were: mobility, walking endurance, and patient-reported global physical health, evaluated after admission to, and before discharge from, rehabilitation.
Mobility was evaluated with the TUG, which measures the time needed to stand up from a chair, walk 3 m, turn around, walk back and sit down on the chair again. The TUG test has good reliability and validity in older patients with frailty and those with MS to quantify mobility and measure improvement (11, 12). Better TUG scores (i.e. shorter times, in s) are associated with ability to leave the house independently and safely (11) and predict living at home after rehabilitation (13).
Walking endurance was measured in neurological patients only, using the 6MWT, which measures the distance (in m) walked in 6 min on a horizontal plane with a hard surface. Speed and intensity are determined by the patient, and breaks are allowed, making the test reflective of the intensity level of daily activities (14). The 6MWT is sensitive to changes in functional ability in patients with MS or PD (15, 16). Walking endurance can provide a good indication of ADL and the possibility of performing activities outside the home.
Patient-reported global physical health was assessed using the PROMIS-10-GPH (17). The GPH subscale is based on responses on 4 items: (i) physical health in general; (ii) performing physical activities, such as walking, stair climbing and shopping, and moving a chair; (iii) mean pain intensity; and (iv) fatigue. Items are rated on a 5-point scale, ranging from poor (1 point) to excellent (5 points), with a total possible range of 4–20 points. The raw total score is transformed, using a transformation table, to a Global Physical Health score with a range of 0–100 points (17). Transformation is not linear. Normative values for the healthy population have a mean of 50 points and standard deviation (SD) of 10 points (17). The PROMIS-10-GPH has been used in patients with knee surgery, hip surgery and MS (18–20), and a review recommends its use in patients with PD (21).
The independent variable was exercise duration (in h) between admission and discharge. In order to assess duration of exercise, data regarding patients’ appointments during inpatient rehabilitation were downloaded from the electronic scheduling system. Therapies not provided were deleted and appointments not involving exercise (e.g. patient education, social, neuropsychological and nutritional counselling) were excluded.
For description of the patient population, multimorbidity was assessed using the Cumulative Illness Rating Scale (CIRS) (22) developed by Miller et al. in 1968 (23). The CIRS captures illnesses of 14 different organ systems, with severity ranging from 0 (no illness) to 4 (life-threatening illness). The total score ranges from 0 to 56. Polypharmacy was defined as the use of 5 or more medications (24).
Minimal clinically important difference
The MCID is the smallest change in an outcome that is considered clinically important (25). The MCID is not a constant value of a measurement tool, but depends on the patient population, the diagnosis, and the stage and severity of the disease. The MCID can be determined using a variety of methods. In studies using the anchor-based method participants answer an “anchor” question about whether they find the change in the outcome of interest relevant. This anchor question is used to determine the MCID (26). In studies using the distribution-based method the MCID is defined as a change of half an SD in the measurements in the patient group at entry (27). A change of half an SD corresponds with a medium Cohen’s d effect size of 0.5 (28). For all outcomes, the distribution-based method was used and the MCID was defined as half an SD of the entry measurement.
For the TUG, the anchor-based method was used in addition to the distribution-based method, based on results of a study by Braun et al. of geriatric patients with limited mobility (mean age 83 ± 6 years) who were considered comparable to the patient group in the current study (29). In Braun et al.’s study, an MCID of 3 s for the TUG was determined, corresponding to a relative change of 15%. No anchor-based values for MCID were available for the PROMIS-10-GPH and 6MWT from studies in comparable patient groups.
Floor and ceiling effects and limitations of cognitive functions
Floor and ceiling effects limit the ability of assessments to evaluate change in outcome measures. Floor effects in measurements of mobility (TUG) and walking endurance (6MWT) occur in patients who are unable to perform the task. Ceiling effects occur when scores are at or near the possible upper limit. Ceiling effects for the TUG were defined based on published age- and sex-based normal values (30). In the 6MWT, the ceiling effect was individually defined based on the upper limit of predicted distance for healthy individuals and calculated using the formula published by Troosters (31). For the PROMIS-10-GPH it was recorded whether patients were unable to complete the measure due to cognitive limitations. For the PROMIS-10-GPH, a ceiling effect was defined as an entry raw summed score less than 0.5 SD below the maximum raw summed score of 20 points. The proportion of patients with missing data due to cognitive limitations, floor or ceiling effects was recorded. Substantial floor and ceiling effects are generally referred to when more than 15% of patients achieve the highest or lowest score (32).
Statistical analysis
SPSS Statistics 27.0 (IBM Corp., Armonk, NY, USA) was used for all statistical analyses.
Multiple imputation of missing data
Data were defined as missing if an assessment did not take place due to time or organizational reasons. Missing data were replaced with multiple imputation (MI). Data were not considered missing and therefore not replaced by imputation if collection was not possible due to motor or cognitive limitations.
Data not missing completely at random may introduce bias in the results of analyses. The validity of estimated values is then limited and analyses based on complete cases are unsuitable. MI creates datasets with imputed values and accounts for random error, resulting in better estimates of parameters and their confidence intervals (33, 34). Little’s test was used to check whether data were missing completely at random (35). p-values < 0.05 in the current study indicated that data were not missing completely at random and therefore 5 complete data-sets were formed using MI with the fully conditional specification (FCS) method (33, 34).
Absolute or relative change
For each outcome measure, homoscedasticity of absolute change between admission and discharge was analysed as the dependent variable, with baseline measures as the independent variable. Changes are homoscedastic if they have a similar dispersion in individuals with low and high values at baseline. Homoscedasticity was assessed in a graphical representation and with the modified Breusch–Pagan test (36, 37). In case of significant heteroscedasticity of absolute changes in outcomes, relative changes were evaluated for homoscedasticity and used if appropriate.
Therapy duration required for minimal clinically important difference
The required duration of exercise therapy to achieve a MCID improvement was calculated. The MCID was calculated using the distribution-based method, where MCID = 0.5 * SD of measurement at entry (27). The required duration of exercise (in h) to achieve a change in the extent of MCID was calculated as follows: exercise duration for MCID (h) = total exercise duration (h) * MCID/change in outcome. In an earlier study of a population of geriatric patients, considered comparable with the population in the current study, the mean value of the TUG was 20 s and the anchor-based MCID was 3 s, which corresponds to a relative change of 15% (29). Because the patient population in the earlier study was very similar to the patient population in the current study, an anchor-based MCID of 15% was used. The results were compared with those of the distribution-based method. Due to insufficient power, no statistical comparisons were made between outcomes and diagnostic groups.
RESULTS
Population
Fig. 1 shows patient flow in the study and Table I shows descriptive data for the 4 diagnostic groups. Of a total of 561 patients hospitalized at Kliniken Valens from 1 January 2020 to 30 April 2021, 73% had provided written informed consent for further use of their data. Of these patients, 5% were excluded due to unforeseen discontinuation of rehabilitation because of acute illness. The remaining patients were analysed in the 4 different groups: knee surgery, hip surgery, MS, and PD.
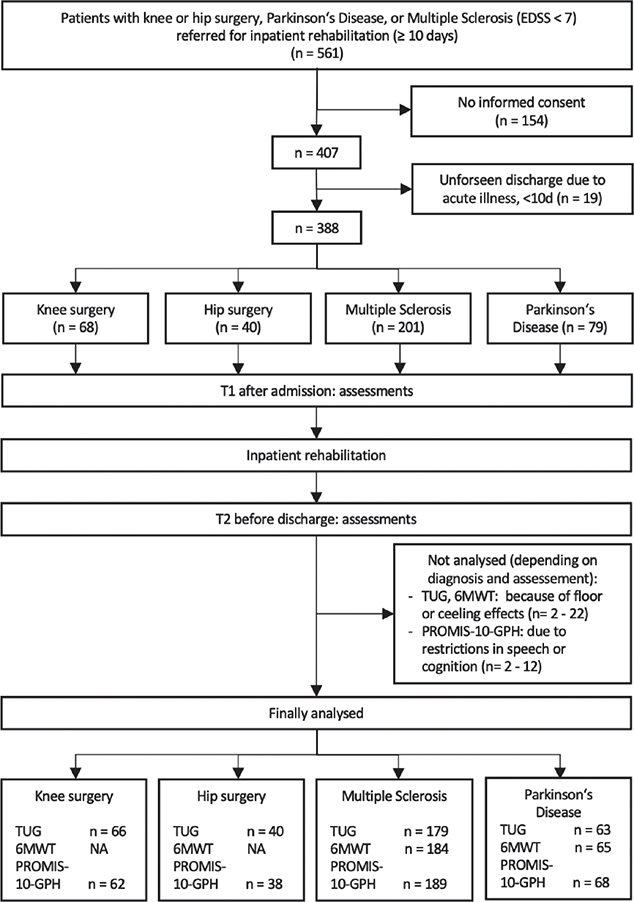
Fig. 1. Study flow chart. EDSS: Expanded Disability Status Scale for patients with MS. A score < 7 indicates patients are independently walking with or without assistive devices; NA: not assessed; TUG: Timed Up and Go test; PROMIS-10-GPH: Patient Reported Outcomes Measurement Information System – Global Physical Health; 6MWT: 6-minute walk test.
Table I shows the demographic data and baseline results of outcome measures for the 4 diagnostic groups. The mean age of patients with MS was lower than for the other diagnostic groups. The proportion of women was higher than that of men in all groups except for the group with PD, in which the proportion of women was lower. The vast majority of patients lived at home before hospitalization and rehabilitation. Independence in daily living was measured with the Functional Independence Measure (FIM) (38). FIM scores can range from 18 to 126 points and showed a relevant limitation of independence at entry in all patient groups. Patients with PD were more likely to require home care, more frequently had polypharmacy and had higher multimorbidity (CIRS) compared with the other groups. Length of stay was comparable among the 4 groups. The duration of therapy (in h per day) was comparable in patients after knee surgery and hip surgery and lower than in patients with MS or PD. In < 10% of subjects entry measurements for the TUG, 6MWT, and PROMIS-10-GPH could not be completed, due to cognitive limitations in the case of the PROMIS-10-GPH and severe limitations in mobility for the TUG and 6MWT.
Completeness of data and imputation
The overall proportion of missing data was 6.8%. In 52% of the patients, 1 or more values were missing. Variables with larger proportions of missing data were outcome measurements at discharge that had not been collected due to time constraints. Data were not missing completely at random (MCAR, Little’s test p < 0.00001). Patients with missing values were more impaired cognitively and in terms of mobility. Therefore, multiple imputation was performed.
Floor and ceiling effects and limitations of cognitive functions
Table II shows the proportion of patients with floor and ceiling effects in mobility (TUG) and walking endurance (6MWT), and the proportion of patients who could not complete the PROMIS-10-GPH due to cognitive limitations. The TUG showed a minor ceiling effect in patients with MS and PD and a minor floor effect in patients after knee surgery and in patients with MS and PD. The 6MWT showed a minor floor effect and no ceiling effect in patients with MS or PD. The PROMIS-10-GPH showed no floor or ceiling effects. Cognitive limitations including language resulted in 8% of all patients being unable to complete the PROMIS-10-GPH. This proportion was highest in patients with PD (14%).
Absolute or relative difference
Scatter plots for absolute changes in physical health (PROMIS-10-PH) and walking endurance (6MWT) between admission and discharge were homoscedastic. The modified Breusch–Pagan test was not significant (PROMIS-10-GPH p = 0.064; 6MWT p = 0.134). Therefore, absolute changes in the PROMIS-10-PH and 6MWT were used in the analysis. In contrast, absolute changes in the TUG between admission and discharge showed marked heteroscedasticity and the modified Breusch–Pagan test indicated significant heteroscedasticity (p < 0.0001). Relative changes were homoscedastic, as the modified Breusch–Pagan test was not significant (p = 0.245). Therefore, relative changes in the TUG were used in the analysis.
Exercise duration to achieve a minimal clinically important difference
Table III and Fig. 2 show, per diagnostic group and outcome measurement, the duration (in h) of exercise required to achieve a change in the extent of MCID. Comparing results of the distribution-based method for all outcomes, the duration of exercise required to achieve a MCID was greater for patients with MS or PD than for those with knee or hip surgery. The outcome patient-reported global physical health required the shortest duration. For the outcome mobility (TUG), the distribution-based method found that 50% more hours were needed to achieve a MCID than was shown by the anchor-based method for patients after knee and hip surgery, and the distribution-based method found that 150% more hours were needed than was shown by the anchor-based method for patients with MS and PD. Furthermore, the hours required to achieve a MCID were similar for patients with knee and hip surgery in mobility and patient-reported global physical health. For patients with MS, the hours required to achieve a MCID were similar for walking endurance and patient-reported global physical health. Patients with PD required fewer hours to achieve a MCID for patient-reported global physical health compared with walking endurance. The distribution-based method showed that all patient groups achieved a mean improvement greater than the MCID in patient-reported global physical health. In patients with MS or PD, mean improvements in mobility and walking endurance were smaller than the MCID.
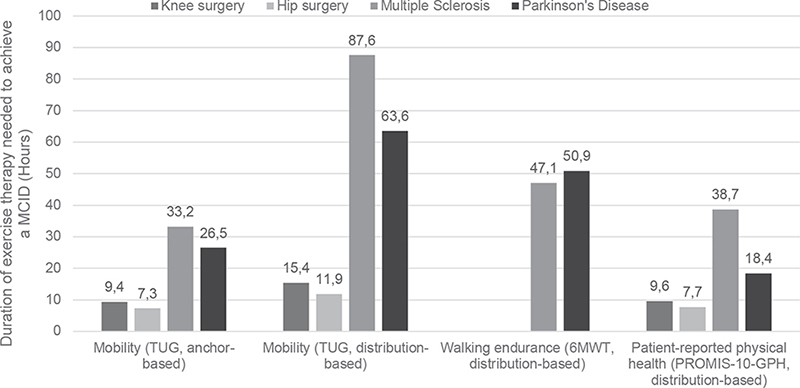
Fig. 2. Duration of exercise therapy needed to achieve a minimal clinically important difference (MCID) in mobility, walking endurance and patient-reported physical health outcome measures in 4 different patient groups. TUG: Timed Up and Go test; PROMIS-10-GPH: Patient Reported Outcomes Measurement Information System – Global Physical Health; 6MWT: 6-minute walk test.
DISCUSSION
This retrospective cohort study evaluated the duration of exercise therapy needed to achieve a MCID regarding mobility, walking endurance and physical health in individuals after knee surgery, hip surgery, and with MS or PD. In all patients, the duration of exercise therapy required to achieve a MCID ranged from 8 to 88 h. The duration of therapy needed was longer in individuals with MS or PD (25–88 h) than in individuals after knee or hip surgery (8–25 h). In all patient groups, the duration of exercise therapy needed, determined using the distribution-based method, was shortest for patient-reported global physical health.
The shorter duration of exercise therapy required to achieve a MCID in individuals with knee or hip surgery compared with those with MS or PD is probably due to natural recovery after surgery, while MS and PD are chronic progressive diseases. In patients with MS or PD, motor function is affected throughout the body, which may additionally hinder improvement compared with individuals after surgery.
The anchor-based MCID of the TUG was 30–60% lower than the distribution-based MCID. Consequently, the duration of exercise therapy (in h) required to achieve an improvement in the anchor-based MCID was also correspondingly lower. A possible explanation for the higher values of the MCID with the distribution-based method is that the heterogeneity, and thus the SD, of TUG values was greater in the current study compared with Braun et al.’s study (29). In patients evaluated before and after spinal surgery for lumbar degenerative disc disease, different anchors resulted in a mean MCID of 36% (39), which is higher than the 15% in the current study.
At Kliniken Valens, a mean of 1.8 h of exercise therapy is provided per day for 6 days per week including admission and discharge days. With this duration, the MCID is currently not reached in distribution-based analysis of mobility (TUG) and walking endurance (6MWT) in the neurological patient groups, who have a mean length of stay of 25 days. At the same time, however, the MCID is achieved with the PROMIS-10-GPH, indicating that the distribution-based MCID for mobility and walking endurance may be overestimated. All patient groups required shorter duration of therapy to achieve a MCID in patient-reported global physical health (PROMIS-10-GPH) compared with mobility (TUG). Patient-perceived improvement appears to be greater than improvement in mobility measured by therapists. This may be because patients’ perceptions are influenced not only by the time needed to complete physical tasks, but also by levels of pain, confidence and fear of falling.
It is notable that the knee surgery and hip surgery groups had less exercise therapy per day (1.27 h and 1.24 h, respectively), compared with the groups with MS or PD (1.80 and 1.51 h, respectively). This may be due to the reduced general health of patients after knee and hip surgery, and that these patients had more therapies that did not include exercise.
Other studies have reported similar or lower MCID values for the 6MWT. In the current study, the 6MWT was not routinely administered in patients with knee or hip surgery. The distribution-based MCID for the 6MWT was 62 m (corresponding to 22%) for persons with MS and 71 m (corresponding to 23%) for persons with PD. A study of patients with chronic lower extremity musculoskeletal pain reported a similar MCID of 75 m (40). A review by Wise & Brown also reported comparable distribution-based and anchor-based MCID values of 55–80 m in persons with chronic obstructive pulmonary disease (COPD) (41). Lower anchor-based MCID values of 14 m for adults with fear of falling and 24–30 m for patients with cardiac and pulmonary conditions were reported in a systematic review by Bohannon et al. (42). A review of studies in patients with respiratory, cardiovascular, or musculoskeletal disease reported mean anchor-based MCID values for the 6MWT of 7% change (range 3–15%) and slightly higher distribution-based MCID values of 9% change (range 4–16%) (43). MCID values in the current study were higher for patients with MS (22%) and PD (23%). Several factors may contribute to differences in MCID values. Firstly, MCID values for an assessment depend on the diagnosis, as well as on the phase of the disease in the patient population, and on the calculation method. Results for determining MCID depend on the method used (26). In the current study, greater heterogeneity in neurological patient groups, indicated by larger SDs in the baseline measurement, contributed to the larger MCID values. Overall, the MCID values in the current study were in the higher range of MCID values reported in other studies.
Distribution-based MCIDs of the PROMIS-10-GPH in the current study ranged from 2.9 to 3.2 points. A study with patients with knee arthroscopy showed comparable MCID values with the anchor-based method (3.2–3.3 points) (44). Lower MCID values were reported for patients with total knee arthroplasty (anchor-based method 2.5 points; distribution-based method 2.3 points) (45). In contrast, other studies showed much higher MCIDs in patients with hip arthroscopy (5.1 points) (46) and in patients after spinal surgery (4.3 points) (47). In the current study, MCID values were in the lower range compared with other studies. This may have contributed to the fact that patients in the current study required the lowest duration of exercise therapy to achieve an improvement corresponding to the MCID for the PROMIS-10-GPH, compared with the TUG and the 6MWT.
A limitation of the current study is that anchor-based MCID values were not available for most outcomes and patient groups (26). An anchor-based MCID value was available only for the TUG from a study in a comparable population using the anchor-based method (29). However, it can be questioned whether it is feasible for patients to provide responses to anchor questions separately for 3 outcomes.
The current results can be applied in comparable settings and in patients with similar diagnoses and disease stages. However, a further limitation is that the results of this study may not be applicable to patients after knee or hip surgery at a later stage of recovery who have smaller remaining deficits. It is likely that smaller improvements are then considered relevant and MCIDs decrease. Consequently, at later stage of recovery, the duration of therapy needed to achieve a MCID will most likely be different from the values found in the current study. Further research is needed to compare MCIDs at different stages of recovery.
Strengths of the current study are an inclusion rate of approximately 70%, data completeness of 90%, and multiple imputation of missing data, which reduces bias and increases the representativeness and validity of the results. The same distribution-based method for MCID was applied to all patient groups, allowing comparison of results between diagnostic groups and assessments. Estimates of exercise therapy times were considered accurate because they were extracted from the electronic planning system of Kliniken Valens.
When choosing one of the assessment measures used in the current study for general clinical use, several issues should be considered. The 3 measures capture slightly different, partially overlapping, aspects of physical health. Mobility measured with the TUG can be recommended for patient populations with restricted independence in daily living at home, as it includes getting up, walking, turning, and sitting down. The TUG can be performed with minimal time expenditure. Walking endurance measured with the 6MWT is most relevant for patients who want to improve mobility outside the home. Patient-reported global physical health measured with the PROMIS-10-GPH is recommended for patient populations without cognitive limitations that could interfere with its application. The PROMIS-10-GPH is completed independently by the patient. It has high ecological validity, as it displays how the respondents perceive their physical health. In all diagnostic groups, the PROMIS-10-GPH yielded the shortest duration of therapy to achieve a MCID.
Further studies are needed to determine the anchor-based MCID during rehabilitation in patients with different diagnoses. In addition, prospective clinical studies are needed to assess the required duration of therapy per disease or diagnosis group with respect to MCID. These data should then be used to conduct studies to define evidence-based rehabilitation duration per diagnosis.
In conclusion, the duration of exercise therapy required for an improvement corresponding to the MCID ranged from 8 to 88 h, depending on the outcome measure used and patients’ diagnosis. The required duration of therapy was longer in patients with MS or PD, compared with those who had had knee or hip surgery. In all diagnostic groups, the required duration of therapy, determined using the distribution-based method, was smallest for patient-reported global physical health (PROMIS-10-GPH) compared with mobility (TUG) and walking endurance (6MWT).
ACKNOWLEDGEMENTS
The study was supported by the Rehabilitation Centre Kliniken Valens.
The study was approved by the responsible ethics committee of Eastern Switzerland (BASEC 2021/01717, EKOS 21/129).
The study data-set is available on request from the corresponding author.
REFERENCES
- van Doormaal MCM, Meerhoff GA, Vliet Vlieland TPM, Peter WF. A clinical practice guideline for physical therapy in patients with hip or knee osteoarthritis. Musculoskeletal Care 2020; 18: 575–595. DOI: 10.1002/msc.1492
- Learmonth YC, Motl RW. Exercise training for multiple sclerosis: a narrative review of history, benefits, safety, guidelines, and promotion. Int J Environ Res Public Health 2021; 18: 13245. DOI: 10.3390/ijerph182413245
- Cheng F-Y, Yang Y-R, Chen L-M, Wu Y-R, Cheng S-J, Wang R-Y. Positive effects of specific exercise and novel turning-based treadmill training on turning performance in individuals with parkinson’s disease: a randomized controlled trial. Sci Rep 2016; 6: 33242. DOI: 10.1038/srep33242
- Mak MK, Wong-Yu IS, Shen X, Chung CL. Long-term effects of exercise and physical therapy in people with parkinson disease. Nat Rev Neurol 2017; 13: 689–703. DOI: 10.1038/nrneurol.2017.128
- Abbruzzese G, Marchese R, Avanzino L, Pelosin E. Rehabilitation for Parkinson’s disease: current outlook and future challenges. Parkinsonism Relat Disord 2016; 22 Suppl 1: S60–64. DOI: 10.1016/j.parkreldis.2015.09.005
- Radder DLM, Lígia Silva de Lima A, Domingos J, Keus SHJ, van Nimwegen M, Bloem BR, et al. Physiotherapy in Parkinson’s disease: a meta-analysis of present treatment modalities. Neurorehabil Neural Repair 2020; 34: 871–880. DOI: 10.1177/1545968320952799
- Osborne JA, Botkin R, Colon-Semenza C, DeAngelis TR, Gallardo OG, Kosakowski H, et al. Physical therapist management of Parkinson disease: a clinical practice guideline from the American Physical Therapy Association. Phys Ther 2022; 102: pzab302. DOI: 10.1093/ptj/pzab302
- Mistry JB, Elmallah RDK, Bhave A, Chughtai M, Cherian JJ, McGinn T, et al. Rehabilitative guidelines after total knee arthroplasty: a review. J Knee Surg 2016; 29: 201–217. DOI: 10.1055/s-0036-1579670
- Masaracchio M, Hanney WJ, Liu X, Kolber M, Kirker K. Timing of rehabilitation on length of stay and cost in patients with hip or knee joint arthroplasty: a systematic review with meta-analysis. PLoS One 2017; 12: e0178295. DOI: 10.1371/journal.pone.0178295
- Amatya B, Khan F, Galea M. Rehabilitation for people with multiple sclerosis: an overview of cochrane reviews. Cochrane Database Syst Rev 2019; 1: CD012732. DOI: 10.1002/14651858.CD012732.pub2
- Podsiadlo D, Richardson S. The timed “up & go”: a test of basic functional mobility for frail elderly persons. J Am Geriatr Soc 1991; 39: 142–148. DOI: 10.1111/j.1532-5415.1991.tb01616.x
- Valet M, Lejeune T, Devis M, van Pesch V, El Sankari S, Stoquart G. Timed up-and-go and 2-minute walk test in patients with multiple sclerosis with mild disability: reliability, responsiveness and link with perceived fatigue. Eur J Phys Rehabil Med 2019; 55: 450–455. DOI: 10.23736/S1973-9087.18.05366-2
- Kool J, Oesch P, Bachmann S. Predictors for living at home after geriatric inpatient rehabilitation: A prospective cohort study. J Rehabil Med 2017; 49: 185–190. DOI: 10.2340/16501977-2182
- American Thoracic Society. ATS statement: guidelines for the six-minute walk test. Am J Respir Crit Care Med 2002; 166: 111–117. DOI: 10.1164/ajrccm.166.1.at1102
- Kobayashi E, Himuro N, Takahashi M. Clinical utility of the 6-min walk test for patients with moderate Parkinson’s disease. Int J Rehabil Res 2017; 40: 66–70. DOI: 10.1097/MRR.0000000000000205
- Potter K, Cohen ET, Allen DD, Bennett SE, Brandfass KG, Widener GL, et al. Outcome measures for individuals with multiple sclerosis: recommendations from the american physical therapy association neurology section task force. Phys Ther 2014; 94: 593–608. DOI: 10.2522/ptj.20130149
- Hays RD, Bjorner JB, Revicki DA, Spritzer KL, Cella D. Development of physical and mental health summary scores from the patient-reported outcomes measurement information system (PROMIS) global items. Qual Life Res 2009; 18: 873–880. DOI: 10.1007/s11136-009-9496-9
- Baldassari LE, Nakamura K, Moss BP, Macaron G, Li H, Weber M, et al. Technology-enabled comprehensive characterization of multiple sclerosis in clinical practice. Mult Scler Relat Disord 2020; 38: 101525. DOI: 10.1016/j.msard.2019.101525
- Shim J, Hamilton DF. Comparative responsiveness of the PROMIS-10 Global Health and EQ-5D questionnaires in patients undergoing total knee arthroplasty. Bone Joint J 2019; 101-B: 832–837. DOI: 10.1302/0301-620X.101B7.BJJ-2018-1543.R1
- Torchia MT, Austin DC, Werth PM, Lucas AP, Moschetti WE, Jevsevar DS. A sane approach to outcome collection? Comparing the performance of single- versus multiple-question patient-reported outcome measures after total hip arthroplasty. J Arthroplasty 2020; 35: S207–S213. DOI: 10.1016/j.arth.2020.01.015
- Shulman LM, Armstrong M, Ellis T, Gruber-Baldini A, Horak F, Nieuwboer A, et al. Disability rating scales in parkinson’s disease: critique and recommendations. Mov Disord 2016; 31: 1455–1465. DOI: 10.1002/mds.26649
- Linn BS, Linn MW, Gurel L. Cumulative illness rating scale. J Am Geriatr Soc 1968; 16: 622–626. DOI: 10.1111/j.1532-5415.1968.tb02103.x
- Miller MD, Paradis CF, Houck PR, Mazumdar S, Stack JA, Rifai AH, et al. Rating chronic medical illness burden in geropsychiatric practice and research: application of the cumulative illness rating scale. Psychiatr Res 1992; 41: 237–248. DOI: 10.1016/0165-1781(92)90005-N
- Haefeli WE. Polypharmazie. Swiss Medical Forum 2011; 11: 847–852. DOI: 10.4414/smf.2011.07686
- Copay AG, Subach BR, Glassman SD, Polly DW, Schuler TC. Understanding the minimum clinically important difference: a review of concepts and methods. Spine J 2007; 7: 541–546. DOI: 10.1016/j.spinee.2007.01.008
- De Vet HC, Terwee CB, Mokkink LB, Knol DL. Interpretability. In: De Vet HC, Terwee CB, Mokkink LB, Knol DL, editors. Measurement in medicine: a practical guide. Cambridge: Cambridge university press, 2011: p. 227–274. DOI: 10.1017/CBO9780511996214.009
- Norman GR, Sloan JA, Wyrwich KW. The truly remarkable universality of half a standard deviation: confirmation through another look. Exp Rev Pharmacoecon Outcomes Res 2004; 4: 581–585. DOI: 10.1586/14737167.4.5.581
- Cohen J. Statistical power analysis for the behavioral sciences. 2 ed: Hillsdale. Erlbaum, 1988. DOI: 10.1016/C2013-0-10517-X
- Braun T, Thiel C, Schulz R-J, Grüneberg C. Responsiveness and interpretability of commonly used outcome assessments of mobility capacity in older hospital patients with cognitive spectrum disorders. Health Qual Life Outcomes 2021; 19: 68. DOI: 10.1186/s12955-021-01690-3
- Ibrahim A, Singh DKA, Shahar S. ‘Timed up and go’ test: age, gender and cognitive impairment stratified normative values of older adults. PLoS One 2017; 12: e0185641. DOI: 10.1371/journal.pone.0185641
- Troosters T, Gosselink R, Decramer M. Six minute walking distance in healthy elderly subjects. Eur Respir J 1999; 14: 270–274. DOI: 10.1034/j.1399-3003.1999.14b06.x
- McHorney CA, Tarlov AR. Individual-patient monitoring in clinical practice: are available health status surveys adequate? Qual Life Res 1995; 4: 293–307. DOI: 10.1007/BF01593882
- White IR, Royston P, Wood AM. Multiple imputation using chained equations: issues and guidance for practice. Statist Med 2011; 30: 377–399. DOI: 10.1002/sim.4067
- Rombach I, Rivero-Arias O, Gray AM, Jenkinson C, Burke Ó. The current practice of handling and reporting missing outcome data in eight widely used proms in RCT publications: a review of the current literature. Qual Life Res 2016; 25: 1613–1623. DOI: 10.1007/s11136-015-1206-1
- Little RJA. A test of missing completely at random for multivariate data with missing values. J Am Statist Assoc 1988; 83: 1198–1202. DOI: 10.1080/01621459.1988.10478722
- Breusch TS, Pagan AR. A simple test for heteroscedasticity and random coefficient variation. Econometrica 1979; 47: 1287–1294. DOI: 10.2307/1911963
- Abdul-Hameed B, Matanmi OG. A modified Breusch–Pagan Test for detecting heteroscedasticity in the presence of outliers. Pure Appl Math J 2021; 10: 139–149. DOI: 10.11648/j.pamj.20211006.13
- Granger CV, Brownscheidle CM. Outcome measurement in medical rehabilitation. Int J Technol Assess Health Care 1995; 11: 262–268. DOI: 10.1017/s0266462300006875
- Gautschi OP, Stienen MN, Corniola MV, Joswig H, Schaller K, Hildebrandt G, et al. Assessment of the minimum clinically important difference in the Timed Up and Go test after surgery for lumbar degenerative disc disease. Neurosurgery 2017; 80: 380–385. DOI: 10.1227/NEU.0000000000001320
- Benaim C, Blaser S, Léger B, Vuistiner P, Luthi F. “Minimal clinically important difference” estimates of 6 commonly-used performance tests in patients with chronic musculoskeletal pain completing a work-related multidisciplinary rehabilitation program. BMC Musculoskelet Disord 2019; 20: 16. DOI: 10.1186/s12891-018-2382-2
- Wise RA, Brown CD. Minimal clinically important differences in the six-minute walk test and the incremental shuttle walking test. COPD 2005; 2: 125–129. DOI: 10.1081/copd-200050527
- Bohannon RW, Crouch R. Minimal clinically important difference for change in 6-minute walk test distance of adults with pathology: a systematic review. J Eval Clin Pract 2017; 23: 377–381. DOI: 10.1111/jep.12629
- Schrover R, Evans K, Giugliani R, Noble I, Bhattacharya K. Minimal clinically important difference for the 6-min walk test: literature review and application to Morquio A syndrome. Orphanet J Rare Dis 2017; 12: 78. DOI: 10.1186/s13023-017-0633-1
- Kenney RJ, Houck J, Giordano BD, Baumhauer JF, Herbert M, Maloney MD. Do Patient Reported Outcome Measurement Information System (PROMIS) scales demonstrate responsiveness as well as disease-specific scales in patients undergoing knee arthroscopy? Am J Sports Med 2019; 47: 1396–1403. DOI: 10.1177/0363546519832546
- Khalil LS, Darrith B, Franovic S, Davis JJ, Weir RM, Banka TR. Patient-Reported Outcomes Measurement Information System (PROMIS) Global Health Short Forms demonstrate responsiveness in patients undergoing knee arthroplasty. J Arthroplasty 2020; 35: 1540–1544. DOI: 10.1016/j.arth.2020.01.032
- Kuhns BD, Reuter J, Lawton D, Kenney RJ, Baumhauer JF, Giordano BD. Threshold values for success after hip arthroscopy using the patient-reported outcomes measurement information system assessment: determining the minimum clinically important difference and patient acceptable symptomatic state. Am J Sports Med 2020; 48: 3280–3287. DOI: 10.1177/0363546520960461
- Hung M, Saltzman CL, Kendall R, Bounsanga J, Voss MW, Lawrence B, et al. What are the MCIDs for PROMIS, NDI, and ODI instruments among patients with spinal conditions? Clin Orthop Relat Res 2018; 476: 2027–2036. DOI: 10.1097/CORR.0000000000000419