ORIGINAL REPORT
RELIABILITY AND VALIDITY OF THE SUPINE-TO-STAND TEST IN PEOPLE WITH STROKE
Shamay S. M. NG, PhD1,2, Peiming CHEN, PhD1,2, Tony C. W. CHAN, BSc1, Cherry H. L. CHANG, BSc1, Regen H. Y. CHENG, BSc1, Kylie K. L. CHOW, BSc1, Alex F. M. YEUNG, BSc1, Tai-Wa LIU, PhD3, Lily Y. W. HO, DHSc1,4, Jerry W. F. YEUNG, PhD2,4, Richard H. XU, PhD1,2 and Mimi M. Y. TSE, PhD3
From the 1Department of Rehabilitation Sciences and 2Research Centre for Chinese Medicine Innovation, The Hong Kong Polytechnic University, Hung Hom, 3School of Nursing and Health Studies, Hong Kong Metropolitan University, Ho Man Tin and 4School of Nursing, The Hong Kong Polytechnic University, Hung Hom, Hong Kong SAR, China
Objective: To investigate the psychometric properties of the supine-to-stand test in people with stroke.
Design: Cross-sectional design.
Subjects: Fifty-two people with stroke (mean (standard deviation) age 63.13 (6.09) years; time post-stroke 93.13 (61.36) months) and 49 healthy older adults (61.90 (7.29) months).
Methods: Subjects with stroke were recruited from the community dwelling in Hong Kong and assessed with the supineto- stand test, Fugl-Meyer Motor Assessment, ankle muscle strength test, Berg Balance Scale, limit of stability test, Timed Up-and-Go Test, Six-Minute Walk Test, Chinese version of Activities-specific Balance Confidence scale, Community Integration Measure (CIM-C), and 12-item Short-Form Health Survey (SF-12) in a university-based rehabilitation laboratory.
Results: The supine-to-stand test completion time demonstrated excellent intra-rater, inter-rater and test-retest reliability (intraclass correlation coefficient 0.946–1.000) for the people with stroke. The completion time was significantly negatively correlated with Berg Balance Scale, Six-Minute Walk Test, limit of stability – maximal excursion, and limit of stability – endpoint excursion results (r = –0.391 to –0.507), whereas it was positively correlated with the Timed Up-and-Go test results (r = 0.461). The optimal cut-off supine-to-stand test completion time of 5.25 s is feasible for a clinical measure to distinguish the performance of people with stroke from healthy older adults (area under the curve = 0.852, sensitivity = 81.1%, specificity = 84.0%).
Conclusion: The supine-to-stand test is a reliable, sensitive, specific and easy-to-administer clinical test for assessing the supine-to-stand ability of people with stroke.
LAY ABSTRACT
Adequate supine-to-stand ability is essential to prevent the secondary injury from fall. However, no previous study investigated the supine-to-stand ability in people with stroke. The objectives of this study were to investigate whether the supine-to-stand test is a reliable and valid outcome measure used in stroke rehabilitation. Our results demonstrate that supine-to-stand test completion time is reliable, and is significantly correlated with clinical and laboratory balance performance, walking endurance and level of functional mobility in people with stroke. Thus, the supine-to-stand test is a reliable, sensitive, specific and easy-to-administer clinical test for assessing the supine-to-stand ability of people with stroke.
Key words: stroke; lower extremity; mobility; geriatric assessment.
Citation: J Rehabil Med 2023; 55: jrm12372. DOI: https://doi.org/10.2340/jrm.v55.12372
Copyright: © Published by Medical Journals Sweden, on behalf of the Foundation for Rehabilitation Information. This is an Open Access article distributed under the terms of the Creative Commons Attribution-NonCommercial 4.0 International License (https://creativecommons.org/licenses/by-nc/4.0/)
Accepted: Aug 1, 2023; Published: Sep 18, 2023
Correspondence address: Shamay S. M. Ng, QT516, 5/F, The Hong Kong Polytechnic University, Hong Kong, China. E-mail: Shamay.Ng@polyu.edu.hk
Competing interests and funding: The authors have no conflicts of interest to declare.
Supine-to-stand ability underpins people’s ability to get out of bed every day. This activity, like standing up after a fall, requires flexibility, dynamic balance and muscle strength, which may be lacking in people with balance deficits and weakness, particularly in people with stroke who have sensorimotor impairments. People who are unable to stand up after a fall are vulnerable to spending prolonged periods in a supine position, which can cause medical problems, ranging from pneumonia to pressure sores. The fall rate in patients with chronic stroke is up to 76% (1), and people with stroke need adequate supine-to-stand ability to prevent falls and fall-related complications.
Supine-to-stand movement is a complex sequential task, and various outcome measures have been developed to assess components of this task. The 5-times-Sit-To-Stand Test (FTSST) and the 1-Minute-Sit-To-Stand Test were developed to examine the sit-to-stand component, while the remaining components in supine-to-stand are not documented (2). In addition, the Motor Assessment Scale was developed to grade performance by time and movement quality (3). However, although all components of supine-to-stand ability are assessed, they are not tested consecutively. The Floor Transfer Test evaluates the functional capacity of participants to sit down on, and then arise from, the floor (4). However, the Floor Transfer Test does not test the supine-to-sit component. Therefore, it is essential to determine the clinical applicability of the supine-to-stand test (STST) for assessing the competence of people with stroke to perform the supine-to-stand task.
The STST was initially developed to identify the developmental sequence of 4–7-year-old children (5). In the test, the subject was required to begin in a supine lying position on the floor and end in upright stance. More recently, STST has been applied to assess the agility of patients with Parkinson’s disease (PD) (6) and the movement pattern of children with Prader-Willi Syndrome (PWS) (7). As PD, PWS and stroke are all neurological disorders, STST may also be applicable to assess people with stroke. However, the psychometric properties of the STST in people with stroke, namely its reliability, correlation with stroke-specific impairment outcome measures, sensitivity and specificity, have yet to be established.
Therefore, the objectives of this study were to investigate: (i) the intra-rater, inter-rater, and test–retest reliabilities of the STST in people with stroke; (ii) the correlation of the STST with stroke-specific impairment outcome measures, namely Fugl-Meyer Motor Assessment (FMA), ankle muscle strength test, Berg Balance Scale (BBS), limit of stability (LOS) test, Timed Up-and Go test (TUG), Six-Minute Walk Test (6MWT), Activities-specific Balance Confidence (ABC) scale, Community Integration Measure (CIM), and 12-Item Short-Form Health Survey (SF-12); and (iii) an STST cut-off time that most effectively discriminates the performance of people with stroke from that of healthy older adults.
METHODS
Study design
This cross-sectional study was approved by the ethics committee of The Hong Kong Polytechnic University (No. HSEARS20210110002-01). The study procedures were based on the guidelines of the Declaration of Helsinki. Written consent was obtained before the study began from all participants, who were fully informed about the study objectives and procedures. The data were collected by a trained research assistant with 2 years’ experience in conducting research on stroke rehabilitation.
Sample size calculation
The reliability of STST in people with stroke has not been investigated. However, STST has good inter-rater reliability (intraclass correlation coefficient (ICC) = 0.77) in people with PD (6). In this study, people with stroke completed STST twice to assess test-retest reliability. The online sample size calculator (8) revealed that, to obtain an ICC = 0.9, a significant level of 0.05 and a power of 80%, a sample size of at least 40 was required.
As only a few studies have been performed to explore the correlation between STST completion time and stroke-specific impairment outcome measures, the sample size in the current study was estimated based on a previous study (9). The study (9) found that STST completion time was significantly correlated (r = 0.4) with problems in social participation in healthy older women. Accordingly, a similar correlation (ρ = 0.40) was used in the current study for the calculation of the sample size using G*Power 3.1.9.7 (Franz Faul, University of Kiel, Kiel, Germany). Therefore, a sample size of 34 was needed to obtain a significance level of 0.05 and a power of 80%.
Thus, a minimal sample size of 40 was required in the current study. To enhance the robustness of the findings, a more conservative sample size of 52 was used.
Participants
Fifty-two people with stroke, living in community dwelling (live at home), were recruited from a local rehabilitation network in Hong Kong through poster advertisement, with the following inclusion criteria: (i) aged over 50 years; (ii) onset of most current stroke at least 6 months previously; (iii) medically stable; (iv) able to follow instructions; (v) Abbreviated Mental Test (AMT) score > 7 (10); (vi) minimal upper extremity capacity to help stabilize the trunk while standing up; and (v) ability to transfer from supine lying to sitting and from sitting to standing position independently or with assistant of walking aids. Exclusion criterion for people with stroke was having a neurological disease, orthopaedic or post-trauma problems other than stroke, which may hinder performance of the assessments. A total of 49 healthy older adults with a stable health condition were also recruited as participants, with the following inclusion criteria: (i) age over 50 years; (ii) able to independently complete the STST in a single attempt (with or without support from holding onto a stool); and (iii) able to follow instructions. Exclusion criteria were: any neurological disease, orthopaedic and post-trauma problems or other medical condition(s) that may hinder performance of the assessments.
Testing procedure
At the first assessment, the demographic data and STST completion time of people with stroke and healthy older adults were collected. The STST completion time of each subject was assessed by rater A 3 times, in order to assess the intra-rater reliability of STST. In addition, the STST completion time of each subject was assessed by rater A and rater B, in order to assess the inter-rater reliability of STST. The people with stroke also completed stroke-specific impairment outcome measures. At the second assessment (7 days after the first assessment), people with stroke performed STST again to assess test-retest reliability of STST (Fig. 1). A rest of at least 5 min was provided between each test.
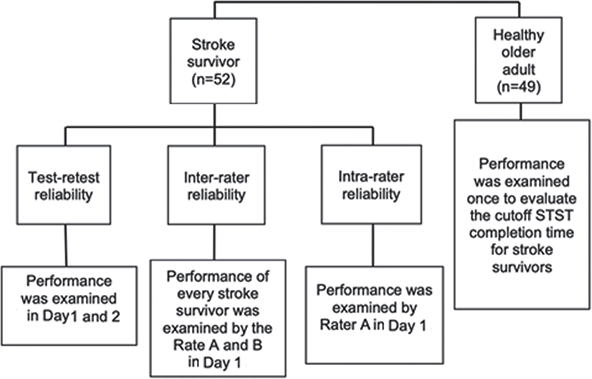
Fig. 1. Study flowchart. STST: supine-to-stand test.
The healthy older adults performed STST on the first assessment and the data were used to calculate the optimal cut-off STST completion time for people with stroke and healthy older adults.
Outcome measures
Supine-to-stand test. The STST was used to assess supine-to-stand ability (6). Initially, the participant was barefoot and in a supine position on a mat. Then, the assessor stated “1, 2, 3 – go” and started a timer, in response to which the participant began moving in an attempt to adopt a usual and stable standing posture with both feet on the mat. When this was achieved, the assessor stopped the timer. A stool was placed next to the unaffected or dominant side of people with stroke and healthy older adults, respectively, for safety during the test. The dominant side of the healthy older adults was the side they used for handwriting, and the use of a stool did not affect a participant’s score, but was simply based on participant’s preference. One practice trial and 2 test trials were allowed, with rests of at least 3 min between trials. The mean of 2 trials was used for analysis. The STST has demonstrated acceptable test–retest reliability (ICC = 0.77) and good intra-rater reliability (ICC=0.65) in patients with PD (6).
Fugl-Meyer Assessment. The FMA was used to assess post-stroke motor control of the upper limb and lower limb (11). The FMA is a 3-point ordinal scale with 50 items (upper limb: 33 items; lower limb: 17 items), each item rates from 0 to 2. The total scores for Fugl-Meyer Assessment of Upper Extremity (FMA-UE) and Lower Extremity (FMA-LE) performance are 66 and 34, respectively, with a higher score indicating better motor control recovery. The FMA has demonstrated excellent test–retest reliability for total motor recovery (ICC = 0.97) in people with stroke (11).
Ankle muscle strength test. Bilateral ankle dorsiflexors and plantarflexors strength of people with stroke were assessed with a Nicholas hand-held dynamometer (model 01160; Lafayette Instrument Company, Lafayette, IN, USA) (12), as the ankle muscle strength could predict the walking capacity of people with stroke (13, 14). Participants performed 3-s maximum isometric voluntary contraction of ankle dorsiflexor and plantar flexors with the dynamometer placed anterior and posterior to the head of metatarsal bones, respectively. Make tests were performed on all muscle groups tested. Standard encouragement, “Push against my resistance as hard as you can” was provided during the test. The peak value of each trial was recorded. The test was performed twice for each muscle group, with at least 1 min rest between attempts to prevent muscle fatigue. The ankle muscle strength test has demonstrated excellent reliability (ICC 0.76–0.89) in people with stroke (12).
Six-Minute Walk Test. The 6MWT was used to assess the aerobic capacity and exercise endurance of people with stroke, which predicts their community ambulation and social integration (15). The 6MWT was conducted according to the guideline of American Thoracic Society Statement (16). Participants were instructed to walk as far as possible for 6 min on a flat 30-m walkway with cones placed at both ends, using their usual walking aid. Standardized encouragements were given at 1, 3, and 5 min during the walk: “You’re doing a good job” (min 1), “You’re halfway done” (min 3), and “You have 1 minute to go” (min 5). Participants were allowed to stop and rest as they considered necessary. The total distance covered within 6 min was measured, with longer distance covered indicating better aerobic capacity and endurance. The 6MWT has demonstrated good reliability (ICC 0.75–0.98) in people with stroke (15).
Berg Balance Scale. The BBS was used to assess balance ability (17). The quality and time taken to perform the tasks were rated on a 5-point scale (0–4), where the maximum score was 56. A higher score indicates better balance ability. It has demonstrated excellent reliability (ICC 0.99) in people with stroke (17).
Limit of stability test. The LOS test was used to assess postural balance ability, by measuring the maximum displacement of the centre of pressure (COP) in different directions while maintaining balance with the Balance Master (Bertec Corporation, Columbus, OH, USA) (18). The participant would stand on the force plate and face the screen so that they could get visual feedback from the system. The harness was used for safety. During the assessment, the participants attempted to move their COP towards 4 target boxes projected in various directions, while viewing a real-time display of their COP on a computer screen located at eye level. Four movement directions were assessed, including forward and backward, and to the affected and unaffected side. The following parameters were generated: (i) LOS reaction time (LOS-RT) was used to assess the time participants took to give a movement response after cues were provided; (ii) LOS movement velocity (LOS-MV) was used to assess the mean centre of gravity (COG) displacement speed; (iii) LOS endpoint excursion (LOS-EPE) was used to assess how far the participant leaned towards the target on their first attempt; (iv) LOS maximal excursion (LOS-ME) was used to assess the maximum displacement of the COP for reaching each target position during the trial; (v) LOS directional control (LOS-DC) was used to assess how much of the participant’s movement was in the target direction.
Composite scores were generated for each variable by averaging the scores for the 4 targets within a trial. Detailed procedures for the LOS test were documented in a previous study of stroke survivors, which demonstrated high test-retest reliabilities (ICC 0.78–0.91) (19).
Timed Up and Go test. The TUG test was used to assess functional mobility (20). The time required for participants to stand up from a chair with a backrest and walk along a 3-m straight line at their normal gait speed, make a 180o turn and then walk back to the chair and sit down with their trunk touching the backrest was measured. Walking aids were allowed. One practice trial and 3 test trials were allowed, and the mean was used for data analysis. The TUG has demonstrated excellent reliability (ICC 0.98) in people with stroke (20).
Chinese version of Activities-specific Balance Confidence scale. The ABC-C Scale was used to assess the confidence of participants in maintaining balance during daily functional activities (21). It is a self-administered questionnaire to rate their confidence (from 0% (no confidence) to 100% (full confidence)) in performing 16 daily functional activities without losing balance. A higher percentage indicates greater confidence. The ABC-C Scale has demonstrated excellent test-retest reliability (ICC = 0.92) in people with stroke (22).
Short Form 12-item Survey. The SF-12 (version 1) was used to assess the health-related impact on quality of life of people with stroke (23). It is a 12-item selfreported questionnaire focusing on 8 domains evaluating physical and mental well-being of participants. The physical component score (range 24.00–56.58) and mental component score (range 19.06–60.76) were calculated based on the score of the 12 items, as suggested by Kosinski et al. (24). A higher score indicates better physical and mental health conditions. The SF-12 (version 1) has good test–retest reliability (ICC 0.80–0.81) in people with stroke (23).
Chinese version of Community Integration Measure. The CIM-C was used to assess the extent of community integration of people with stroke (25). It consists of 10 items across 4 domains (support, assimilation, occupation, and independent living), with each item rated on a 5-point scale from 1 (“always disagree”’) to 5 (“always agree”). The scores for each item are summed to give a total score, with a higher total score indicating better community integration. The CIM-C has demonstrated good test-retest reliability (ICC 0.84) in people with stroke (25).
Statistical analysis
IBM Statistical Package for the Social Sciences (SPSS) software version 26 was used to conduct data analysis. The confidence level of significance was set at α = 0.05. The demographic data, the means of STST completion time and other stroke-specific outcome measures of the participants were calculated using descriptive statistics. The Kolmogorov-Smirnov test and the Levene’s test were used to evaluate the normality and the homogeneity of data variance, respectively. The parametric and non-parametric data was demonstrated with mean (SD) and median (IQR), respectively. The between-group differences of parametric and non-parametric data were calculated using independent t-tests and Mann–Whitney U tests, respectively.
The reliability of the STST ofor people with stroke was evaluated in terms of ICC values with 95% confidence intervals (95% CI). ICCs (3,1) (2-way mixed effects, absolute agreement with a single rater) were computed to measure intra-rater reliability, with the participants rated by 1 rater as the basis of measurement, where the selected rater was the only rater of interest. ICCs (3,2) (2-way mixed effects, absolute agreement and 2 raters) were computed to measure the inter-rater reliability, with the participants rated by 2 raters as the basis of measurement, where the selected raters were the only raters of interest. ICCs (2,1) (2-way random effects, absolute agreement with a single rater) were computed to measure the test–retest reliability, with the participants rated by 1 rater as the basis of measurement, and the raters were randomly selected from a larger population of raters with similar characteristics. ICC values of < 0.5, 0.5–0.75, 0.75–0.9 and >0.9 were regarded as indicating poor, moderate, good and excellent reliability, respectively (26).
The correlation between STST completion time and other outcome measures were quantified by Pearson’s r and Spearman’s rho for parametric and non-parametric data, respectively. The Bonferroni correction was applied to the above-mentioned stroke-specific impairment outcome measures. Therefore, the p-value was adjusted to 0.01 (0.05/8). Correlations were quantified by r value, as follows: no correlation (r ≤ 0.25), a fair correlation (r = 0.25–0.50), a moderate-to-good correlation (r = 0.50–0.75), and a good-to-excellent correlation (r > 0.75) (27).
Receiver operating characteristic (ROC) curve was used to calculate the cut-off STST completion time that best distinguished performance of people with stroke from healthy older adults, with a trade-off between sensitivity and 1 minus specificity determined by the Youden’s index. Sensitivity and specificity refer to the true-positive and false-positive probability, respectively. Areas under the curve (AUCs) of ≥ 0.9, 0.8 to < 0.9, 0.7 to < 0.8, 0.5 to < 0.7, and ≤ 0.5 demonstrate outstanding, excellent, acceptable, poor, and no discrimination accuracy, respectively (28).
Mann–Whitney U test was used to calculate the between-group differences in STST completion time with regards to the TUG (29), FMA-UE, and FMA-LE (30) cut-off scores, which were set at 13.49 s, 39 and 21, respectively.
RESULTS
Tables I–III show the demographics of the participants and the mean STST completion times and other stroke-specific impairment outcome measures for people with stroke and healthy older adults, respectively. The mean ± SD STST completion time of people with stroke (10.81 ± 11.46 s) was significantly longer than that of healthy older adults (4.57 ± 2.90 s) (p < 0.001). For patients with stroke, the mean ankle dorsiflexion muscle strength of the affected and unaffected side was 12.39 (6.95) kg and 18.33 (6.66) kg, while the mean ankle plantar flexor strength of the affected and unaffected side was 9.41 (5.21) kg and 14.61 (6.41) kg. The mean TUG completion time was 14.33 (8.57) s. The FMA-UE, FMA-LE and BBS median (interquartile range [IQR)] scores were 53.50 (34.25, 65.00), 27.50 (24.00, 31.00), and 53.50 (50.25, 55.00), respectively. In addition, there were 26 people with stroke using a stool for support during the STST among the total 52 subjects.
| Characteristics | Stroke (n = 52) | Healthy (n = 49) | p - value |
| Age, years, mean (SD) | 63.13 (6.09) | 61.90 (7.29) | 0.214 |
| Sex, male/female, n | 33/19 | 14/35 | < 0.001* |
| Height, m, mean (SD) | 1.64 (0.07) | 1.62 (0.08) | 0.320 |
| Weight, kg, mean (SD) | 65.06 (9.24) | 59.39 (11.40) | 0.010* |
| Body mass index, kg/m2, mean (SD) | 24.29 (2.97) | 22.53 (3.18) | 0.003* |
| Months since stroke, mean (SD) | 93.13 (61.36) | NA | NA |
| Affected side, left/right, n | 25/27 | NA | NA |
| *Indicates a significant difference at the p ≤0.05 level of confidence. NA: not applicable; SD: standard deviation. | |||
| Parameter | Individuals with stroke (n = 52) | Healthy (n = 49) | p - value |
| STST completion time, s, mean (SD) | 10.81 (11.46) | 4.57 (2.90) | < 0.001* |
| Muscle strength, kg, mean (SD) | |||
| Affected ankle dorsiflexor, kg, mean (SD) | 12.39 (6.95) | ||
| Unaffected ankle dorsiflexor, kg, mean (SD) | 18.33 (6.66) | ||
| Affected ankle plantar flexor, kg, mean (SD) | 9.41 (5.21) | ||
| Unaffected ankle plantar flexor, kg, mean (SD) | 14.61 (6.41) | ||
| 6MWT distance covered, m, mean (SD) | 244.04 (84.44) | ||
| TUG time, s, mean (SD) | 14.33 (8.57) | ||
| FMA-UE score, median (IQR) | 53.50 (34.25, 65.00) | ||
| FMA-LE score, median (IQR) | 27.50 (24.00, 31.00) | ||
| BBS score, median (IQR) | 53.5 (50.25, 55.00) | ||
| ABC-C score, median (IQR) | 73.13 (62.66, 83.44) | ||
| CIM-C score, median (IQR) | 43.50 (36.00, 48.00) | ||
| SF-12 Mental Component Score-C, median (IQR)a | 40.67 (34.22, 46.29) | ||
| SF-12 Physical Component Score-C, median (IQR)a | 52.13 (40.50, 59.64) | ||
| SF-12 Total Score-C, median (IQR)a | 89.96 (77.70, 105.71) | ||
| Mean value for STST completion time was calculated from data collected by rater A. aNumber of individuals involved in that particular parameter is 51, not 52. IQR: interquartile range; SD: standard deviation; 6MWT: Six-Minute Walk Test; BBS: Berg Balance Scale; FMA-UE: Fugl-Meyer Motor Assessment for the upper extremities; FMA-LE: Fugl-Meyer Motor Assessment for the lower extremities; TUG: Timed Up and Go test; ABC-C: Activities-specific Balance Confidence Scale-Chinese version; CIM-C: Community Integration Measure-Cantonese version; SF-12 Mental component-C: Mental component of 12-item Short-Form Health Survey-Chinese Version; SF-12 Physical component-C: Physical component of 12-item Short-Form Health Survey-Chinese Version; SF-12 Total-C: 12-item Short-Form Health Survey-Chinese Version. *Indicates a significant difference at the p ≤0.05 level of confidence. |
|||
Table IV shows STST reliability, which had excellent intra-rater reliability (ICC 0.949–0.954), inter-rater reliability (ICC = 1.000) and test–retest reliability (ICC = 0.946) among people with stroke.
Table V shows the correlations between the STST and stroke-specific impairments outcome measures. The STST completion time was significantly negatively correlated with the BBS score (r = –0.454, p = 0.001), and the 6MWT distance covered (r = –0.507, p < 0.001), whereas it was positively correlated with the TUG completion time (r = 0.461, p = 0.001). The STST completion time was also negatively correlated with the LOS-ME scores (affected and unaffected side: r = –0.437, p = 0.001), and the LOS-EPE scores (affected side: r = –0.391, p = 0.004; unaffected side: r = –0.405, p = 0.003) in general.
| Outcomes | Spearman’s rho (p) |
| FMA-UE score | 0.008 (0.957) |
| FMA-LE score | –0.311 (0.025) |
| Muscle strength of lower limbs | |
| Affected ankle dorsiflexor | –0.162 (0.25) |
| Affected ankle plantar flexor | –0.160 (0.258) |
| Unaffected ankle dorsiflexor | –0.267 (0.055) |
| Unaffected ankle plantar flexor | –0.041 (0.774) |
| 6MWT distance covered | –0.507 (<0.001)* |
| BBS score | –0.454 (0.001)* |
| TUG time | 0.459 (0.001)* |
| ABC score | –0.301 (0.030) |
| CIM score | –0.013 (0.925) |
| SF-12 Total Scorea | –0.099 (0.487) |
| LOS-Reaction time | |
| Forward | 0.184 (0.191) |
| Backward | 0.236 (0.093) |
| Affected side | 0.228 (0.104) |
| Unaffected side | 0.067 (0.635) |
| Composite | 0.294 (0.034) |
| LOS-Movement velocity | |
| Forward | 0.288 (0.039) |
| Backward | 0.274 (0.049) |
| Affected side | –0.106 (0.456) |
| Unaffected side | –0.355 (0.010) |
| Composite | 0.387 (0.005)* |
| LOS-Endpoint excursion | |
| Forward | 0.275 (0.049) |
| Backward | 0.395 (0.003)* |
| Affected side | –0.391 (0.004)* |
| Unaffected side | –0.405 (0.003)* |
| Composite | –0.453 (0.001)* |
| LOS-Max excursion | |
| Forward | –0.301 (0.030) |
| Backward | –0.364 (0.008) |
| Affected side | –0.437 (0.001)* |
| Unaffected side | –0.437 (0.001)* |
| Composite | –0.442 (0.001)* |
| LOS-Directional control | |
| Forward | –0.200 (0.155) |
| Backward | –0.084 (0.554) |
| Affected side | –0.372 (0.007) |
| Unaffected side | –0.147 (0.297) |
| Composite | –0.270 (0.053) |
| aNumber of individuals involved in that particular parameter is 51, not 52. FMA-UE: Fugl-Meyer Motor Assessment for the upper extremities; FMA-LE: Fugl-Meyer Motor Assessment for the lower extremities; 6MWT: Six-Minute Walk Test; BBS: Berg Balance Scale; TUG: Timed Up and Go test; ABC: Activities-specific Balance Confidence Scale; CIM: Community Integration Measure-Cantonese version; SF-12 Total: 12-item Short-Form Health Survey; LOS: limit of stability. *Correlation is significant at the 0.00625 level (2-tailed). |
|
The BBS, FMA-UE and FMA-LE scores displaced ceiling effects, as full marks were obtained by 20.7% of the people with stroke on the BBS and FMA-LE test and 5.7% on the FMA-LE test. Therefore, these outcome measures may not completely capture the motor performance and balance ability of the participants.
The cut-off STST completion time was 5.25 s (p ≤ 0.001) with a sensitivity and specificity of 81.1% and 84%, respectively. Fig. 2 shows the AUC analysis, indicating that the AUC was 0.852.
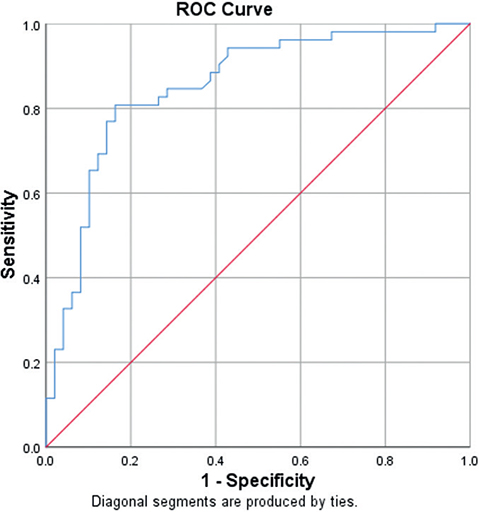
Fig. 2. Receiver operating characteristic (ROC) curves for the supine-to-stand test (STST) completion times (area under the curve (AUC)=0.852; sensitivity=81.1%; specificity=84.0%; p<0.001).
Table VI compares the mean STST completion time between various subgroups. The between-group differences for people with stroke scores on the FMA and TUG test were insignificant and significant, respectively.
| Total sample = 52 | STST completion time Mean (SD) | p - value |
| FMA-UE | 0.308 | |
| Low level (FMA-UE < 39) (n = 18) | 9.97 (4.05) | |
| High level (FMA-UE ≥ 39) (n = 34) | 13.93 (2.39) | |
| FMA-LE | 0.8 | |
| Low level (FMA-LE < 21) (n = 8) | 17.77 (26.88) | |
| High level (FMA-LE ≥ 21) (n = 44) | 9.54 (5.24) | |
| TUG | < 0.001* | |
| High risk of fall (TUG > 13.5s) (n = 23) | 15.62 (15.63) | |
| Low risk of fall (TUG ≤ 13.5s) (n = 29) | 7.00 (3.63) | |
| STST: supine-to-stand test; SD: standard deviation; FMA-UE: Fugl-Meyer Assessment of Upper Extremity; FMA-LE: Fugl-Meyer Assessment of Lower extremity; TUG: Timed Up and Go test. *Significant difference at the p ≤ 0.05 level of confidence. | ||
DISCUSSION
This is the first study to assess the psychometric properties of the STST in people with stroke. Excellent inter-rater, intra-rater and test–retest reliability were exhibited. In addition, the STST completion time was significantly positively correlated with TUG time, and significantly negatively correlated with the BBS, 6MWT, general LOS-ME and LOS-EPE scores.
Supine-to-stand test performance
The mean STST completion time for the people with stroke was nearly twice that of the healthy older adults, and half of the people with stroke needed hand support from the stool in STST. These between-group differences are probably due to the impairments experienced by people with stroke, such as muscle weakness, spastic dystonia and balance deficits. In addition, people with stroke often exhibit diminished cerebral connectivity, leading to a decreased motor neurone firing rate, abnormal motor neurone recruitment and disrupted corticobulbar projections, which impair vestibular processing (31). Therefore, people with stroke exhibited disparate movement patterns, resulting in restricted functional performance in STST compared with that of healthy older adults. This is consistent with previous studies that people with stroke took longer time than the control group to complete functional tests, such as the Trail Walking Test (32) and the Sideways Walk Test (33). However, further research is needed to investigate the extent to which stroke-related impairments affect STST completion time.
Compared with children with PWS (7), people with stroke in this study took longer to complete the STST. However, the differences in pathophysiology between the stroke and PWS lead to different compensatory strategies; thus direct comparison of STST completion times of these 2 populations may not be valid. PWS is attributed to the non-expression of certain genes inducing various impairments, including hypotonia, which hinders movement of children with PWS, but they remain able to use their bilateral upper extremities to aid the initiation of the supine-to-stand task (7). In contrast, people with stroke may not adopt the similar compensatory movements, as their affected upper limb may be flexed due to spasticity. Therefore, people with stroke may only perform a unilateral push, which generates less force than a bilateral upper-limb movement. The role of compensatory strategies in STST and their effects on STST completion time remain unknown, providing possibilities for future investigation.
The STST completion time of the healthy older adults in the current study is comparable with that of healthy older adults in a previous study (mean age 64.6 ± 9.5 years, mean STST completion time 4.1 s) (34). It could be due to the same instructions, i.e. allowing participants to adopt their preferred movement pattern. Moreover, both studies excluded participants with other comorbidities and recruited participants with similar functional performance. However, the current results are not comparable with that of a previous study (≥ 60 years old, median STST completion time 6.0 s) (35) that their STST completion time was measured by trunk sensors that detected minimal changes, whereas the current study measured STST completion time via clinical observation by examiners and using the start time and end time defined in the current study protocol. The different measuring method could result in the discrepancy in STST completion time.
The subgroup analysis in TUG indicates that STST can significantly differentiate people with stroke with high risk of fall. The findings coincide with the significant correlation of STST completion time with TUG but not with FMA.
Supine-to-stand test reliability for people with stroke
Consistent with the studies conducted in patients with PD (6), osteoporosis (36) and apparently healthy community-dwelling older women (37), STST demonstrated excellent inter-rater, intra-rater and test-retest reliability in people with stroke. This might have been due to the well-trained raters, standardized testing environment and instructions, and use of a mean of the results measured by each rater. Compared with the study on people with PD (6), this study shows a higher test–retest reliability for STST. This may be due to people with stroke having less fluctuating physical function than people with PD. The high test–retest reliability is consistent with the results from people with relatively stable conditions, such as people with osteoporosis (36) and apparently healthy community-dwelling older women (37). A 7-day test–retest interval eliminated the change in the conditions of people with stroke over time.
Correlation of the supine-to-stand test with other stroke-specific impairment outcome measures
The STST completion time was not significantly correlated with that of the FMA and ankle muscle strength measures. Compared with muscle power, muscle strength has less impact on functional level, such as the STST (38). This is consistent with the findings of previous study (39) that lower limb strength was correlated with FTSST before a threshold of 10–15 kg and after the threshold, increase in muscle strength does not result in better FTSST performance.
The STST completion time exhibited a good negative correlation with 6MWT completion time. STST involves a sequential task, and 50% of people with stroke in the current study required hand support from the stool. This implies that the muscle endurance and exercise tolerance of people with stroke may have been suboptimal for completing STST. However, 6MWT also measures muscle endurance, exercise tolerance and balance performance (15). Thus, the relative contribution of muscle endurance and exercise tolerance to STST completion time requires further investigation.
The STST completion time showed a fair negative correlation with BBS score. People with better sit-to-stand control on BBS may have a shorter STST completion time, as BBS and STST reflect balance ability and contain sit-to-stand components. However, these outcome measures have different foci: the BBS assesses sit-to-stand performance in item 1, while STST examines the time required to move sequentially from supine to standing.
The STST completion time was not significantly correlated with the general LOS-RT, LOS-MV and LOS-DC scores. This is probably attributable to the various foci of the outcome measures that the LOS mainly assesses static balance, whereas the STST mainly evaluates dynamic balance. The LOS records how far and fast people can shift their COP without losing balance with their COP within their BOS. However, people with stroke have to shift their COP out of the BOS in a controlled manner in the STST. Meanwhile, the STST completion time demonstrated a fair negative correlation with the general scores for the LOS-EPE (r = –0.391 to –0.405) and LOS-ME scores (r = –0.437). Diminished LOS-EPE and LOS-ME may result in sit-back failure while completion of the STST requires adequate COP displacement.
A fair positive correlation was found between the STST completion time and TUG score. As mentioned, completing STST requires balance ability and muscle strength, while the TUG test, which has a sit-to-stand component, is correlated with the BBS (29). However, the TUG focuses on the walking and turning ability of people with stroke, but not supine to standing.
The STST completion time was also not significantly correlated with scores on the ABC-C, CIM-C and SF-12 scales, which assess the level of activity and participation. The confidence of people with stroke in performing daily tasks is influenced by environmental factors, such as education and occupational status. However, the STST predominantly examines physical function and was conducted in a laboratory setting, thereby eliminating the impacts of daily environments. Therefore, the STST may not comprehensively evaluate the activity and participation of people with stroke in this study.
Supine-to-stand test completion time cut-off
The optimal cut-off STST completion time of 5.25 s distinguishes the performance of people with stroke from that of healthy older adults, with a sensitivity of 81.1% and a specificity of 84.0%. The STST has a probability of 85.2% to differentiate the performance of people with stroke from that of healthy older adults, which indicated that the STST is sensitive and specific test with outstanding diagnostic power to discriminate the performance of people with stroke from that of healthy older adults.
Study limitations and future research
This study has several limitations. First, the administration of the STST has not been standardized in the literature, as previous studies have used different experimental settings and numbers of STST trials. The participants in a study (6) performed 1 trial of the STST, whereas the participants in another study (7) performed 10 trials of the STST. These studies performed the STST using low treatment tables or did not provide a stool (6, 7). Thus, further studies should establish standardized settings to eliminate inconsistency. Secondly, movement quality was not evaluated in this study. However, various compensatory strategies were observed in the participants, particularly between participants who used a stool for support and those who did not. Further studies should analyse the contribution of various compensatory strategies adopted to compensate for STST completion time. Thirdly, the profile of people with stroke in the current study is limited. They had a relatively high cognitive function (were able to follow instructions and had an AMT score > 7) and rather well-preserved motor function (median (IQR) FMA-LE score = 27.50 (24.00, 31.00); median (IQR) BBS score = 53.50 (50.25, 55.00)). Both cognitive and motor function play an important role in conducting the supine to stand movement in people with stroke. Therefore, the results of this study may not be highly generalized. Complementary research, including people with stroke with different levels of cognitive and motor impairment, is warranted. Fourthly, the current study sample size was estimated based on the reliability of the STST in patients with PD instead of stroke. Therefore, a larger sample size should be used in future studies in order to draw a more robust conclusion.
CONCLUSION
The STST is an easy-to-administer test for evaluating the supine-to-stand ability of people with stroke. Clinicians can use the STST to assess and monitor progress in physical function of people with stroke. In order to increase the generalizability of these results future studies should include a larger sample size of people with stroke with comorbidities.
ACKNOWLEDGEMENTS
This study was supported by the Research Funding of Faculty Collaborative Research Scheme between Social Sciences and Health Sciences (reference P0038986) of Faculty of Health and Social Sciences, The Hong Kong Polytechnic University, awarded to Professor Shamay Ng and her team.
The study was approved by the Hong Kong Polytechnic University Ethics Committee (HSEARS20210110002-01).
REFERENCES
- Schmid AA, Van Puymbroeck M, Altenburger PA, Miller KK, Combs SA, Page SJ. Balance is associated with quality of life in chronic stroke. Top Stroke Rehabil 2013; 20: 340–346.
- Koufaki P, Mercer TH, Naish PF. Effects of exercise training on aerobic and functional capacity of end-stage renal disease patients. Clin Physiol Funct Imaging 2002; 22: 115–124.
- Carr JH, Shepherd RB, Nordholm L, Lynne D. Investigation of a new motor assessment scale for stroke patients. Phys Ther 1985; 65: 175–180.
- Murphy MA, Olson SL, Protas EJ, Overby AR. Screening for falls in community-dwelling elderly. J Aging Phys Activity 2003; 11: 66–80.
- VanSant AF. Age differences in movement patterns used by children to rise from a supine position to erect stance. Phys Ther 1988; 68: 1330–1338.
- Schenkman M, Cutson TM, Kuchibhatla M, Chandler J, Pieper C. Reliability of impairment and physical performance measures for persons with Parkinson’s disease. Phys Ther 1997; 77: 19–27.
- Belt AB, Hertel TA, Mante JR, Marks T, Rockett VL, Wade C, et al. Movement characteristics of persons with Prader-Willi syndrome rising from supine. Ped Phys Ther 2001; 13: 110–121.
- Walter S, Eliasziw M, Donner A. Sample size and optimal designs for reliability studies. Stat Med 1998; 17: 101–110.
- Bergland A, Laake K. Concurrent and predictive validity of “getting up from lying on the floor”. Aging Clin Exp Res 2005; 17: 181–185.
- Lam SC, Wong Yy, Woo J. Reliability and validity of the abbreviated mental test (Hong Kong version) in residential care homes. J Am Geriatr Soc 2010; 58: 2255–2257.
- Platz T, Pinkowski C, van Wijck F, Kim I-H, Di Bella P, Johnson G. Reliability and validity of arm function assessment with standardized guidelines for the Fugl-Meyer Test, Action Research Arm Test and Box and Block Test: a multicentre study. Clin Rehabil 2005; 19: 404–411.
- Eng JJ, Kim CM, MacIntyre DL. Reliability of lower extremity strength measures in persons with chronic stroke. Arch Phys Med Rehabil 2002; 83: 322–328.
- Ng SS, Hui-Chan CW. Contribution of ankle dorsiflexor strength to walking endurance in people with spastic hemiplegia after stroke. Arch Phys Med Rehabil 2012; 93: 1046–1051.
- Ng SS, Hui-Chan CW. Ankle dorsiflexor, not plantarflexor strength, predicts the functional mobility of people with spastic hemiplegia. J Rehabil Med 2013; 45: 541–545.
- Macchiavelli A, Giffone A, Ferrarello F, Paci M. Reliability of the six-minute walk test in individuals with stroke: systematic review and meta-analysis. Neurol Sci 2021; 42: 81–87.
- Enright PL. The six-minute walk test. Respir Care 2003; 48: 783–785.
- Berg K, Wood-Dauphinee S, Williams J. The Balance Scale: reliability assessment with elderly residents and patients with an acute stroke. J Rehabil Med 1995; 27: 27–36.
- Summers SJ, Antcliff S, Waddington G, Wallwork S. Reliability and learning effects of repeated exposure to the Bertec Balance Advantage sensory organisation test in healthy individuals. Gait Posture 2022; 93: 205–211.
- Chien C-W, Hu M-H, Tang P-F, Sheu C-F, Hsieh C-L. A comparison of psychometric properties of the smart balance master system and the postural assessment scale for stroke in people who have had mild stroke. Arch Phys Med Rehabil 2007; 88: 374–380.
- Podsiadlo D, Richardson S. The Timed “Up & Go”: a test of basic functional mobility for frail elderly persons. J Am Geriatr Soc 1991; 39: 142–148.
- Mak MK, Lau AL, Law FS, Cheung CC, Wong IS. Validation of the Chinese translated activities-specific balance confidence scale. Arch Phys Med Rehabil 2007; 88: 496–503.
- Powell LE, Myers AM. The Activities-specific Balance Confidence (ABC) scale. J Gerontol A Biol Sci Med Sci 1995; 50: M28–M34.
- Bohannon RW, Maljanian R, Landes M. Test–retest reliability of Short Form (SF)-12 component scores of patients with stroke. Int J Rehabil Res 2004; 27: 149–150.
- Kosinski M, Keller S. SF-12: How to score the SF-12 physical and mental health summary scales. Boston, MA: The Health Institute, New England Medical Center 1995.
- Liu T-W, Ng SS, Ng GY. Translation and initial validation of the Chinese (Cantonese) version of Community Integration Measure for use in patients with chronic stroke. BioMed Res Int 2014; 2014: 623836.
- Koo TK, Li MY. A guideline of selecting and reporting intraclass correlation coefficients for reliability research. J Chiro Med 2016; 15: 155–163.
- PPortney LG, Watkins MP. Foundations of clinical research: applications to practice. Philadelphia, F. A. Davis Company, 2009.
- Streiner DL, Cairney J. What’s under the ROC? An introduction to receiver operating characteristics curves. Can J Psychiatry 2007; 52: 121–128.
- Chan PP, Tou JIS, Mimi MT, Ng SS. Reliability and validity of the timed up and go test with a motor task in people with chronic stroke. Arch Phys Med Rehabil 2017; 98: 2213–2220.
- Kwong PW, Ng SS. Cutoff score of the lower-extremity motor subscale of Fugl-Meyer assessment in chronic stroke survivors: a cross-sectional study. Arch Phys Med Rehabil 2019; 100: 1782–1787.
- Marsden J, Playford D, Day B. The vestibular control of balance after stroke. J Neurol Neurosurg Psychiatry 2005; 76: 670–679.
- Ng SS, Liu T-W, Tsoh J, Chen P, Cheng TS, Cheung MC, et al. Psychometric properties of the TRAIL walking test for people with stroke. Front Neurol 2022; 13: 821670.
- Ng S, Lau B, Law G, Wom C, Liu T-W, Tam E, et al. Sideways walk test: Reliability and association with lower limb motor function after stroke. J Rehabil Med 2016; 48: 657–665.
- Bohannon RW, Lusardi MM. Getting up from the floor. Determinants and techniques among healthy older adults. Physiother Theory Pract 2004; 20: 233–241.
- Schwickert L, Boos R, Klenk J, Bourke A, Becker C, Zijlstra W. Inertial sensor based analysis of lie-to-stand transfers in younger and older adults. Sensors 2016; 16: 1277.
- Purser JL, Pieper CF, Duncan PW, Gold DT, McConnell ES, Schenkman MS, et al. Reliability of physical performance tests in four different randomized clinical trials. Arch Phys Med Rehabil 1999; 80: 557–561.
- Moffett MA, Avers D, Bohannon RW, Shaw KL, Merlo AR. Performance and clinimetric properties of the timed up from floor test completed by apparently healthy community-dwelling older women. J Geriatr Phys Ther 2021; 44: 159–164.
- Alcazar J, Alegre LM, Van Roie E, Magalhães JP, Nielsen BR, González-Gross M, et al. Relative sit-to-stand power: aging trajectories, functionally relevant cut-off points, and normative data in a large European cohort. J Cachexia Sarcopenia Muscle 2021; 12: 921–932.
- Ferrucci L, Guralnik JM, Buchner D, Kasper J, Lamb SE, Simonsick EM, et al. Departures from linearity in the relationship between measures of muscular strength and physical performance of the lower extremities: the Women’s Health and Aging Study. J Gerontol A Biol Sci Med Sci 1997; 52: M275–M285.