ORIGINAL ARTICLE
RELATIVE AEROBIC LOAD OF WALKING IN PEOPLE WITH MULTIPLE SCLEROSIS
Arianne S. GRAVESTEIJN, PT, MSc1–3, Sjoerd T. TIMMERMANS, MD1,2, Jip AARTS, MSc1,4,5, Hanneke E. HULST, PhD3,4,6, Brigit A. DE JONG, MD, PhD3,7, Heleen BECKERMAN, PhD1–3 and Vincent DE GROOT, MD, PhD1–3
From the 1MS Center Amsterdam, Rehabilitation Medicine, Vrije Universiteit Amsterdam, Amsterdam UMC location VUmc, 2Amsterdam Movement Sciences Research Institute, Rehabilitation & Development, 3Amsterdam Neuroscience Research Institute, Neuroinfection & Neuroinflammation, Amsterdam, 4Leiden University, Faculty of Social Sciences, Institute of Psychology, Health, Medical and Neuropsychology Unit, Leiden, 5Department of Human Movement Sciences, Faculty of Behavioral and Movement Sciences, Vrije Universiteit Amsterdam, Amsterdam Movement Sciences, 6MS Center Amsterdam, Anatomy and Neuroscience, Vrije Universiteit Amsterdam, Amsterdam UMC location VUmc, 7MS Center Amsterdam, Neurology, Vrije Universiteit Amsterdam, Amsterdam UMC location VUmc, Amsterdam, The Netherlands
Objective: To examine the energy demand of walking relative to aerobic capacity in people with multiple sclerosis.
Design: Cross-sectional cohort study.
Patients: A total of 45 people with multiple sclerosis (32 females), median disease duration 15 years (interquartile range (IQR) 9; 20), median Expanded Disability Status Scale 4 (min–max range: 2.0; 6.0).
Methods: Aerobic capacity, derived from a cardiopulmonary exercise test and gas exchange measurements, assessed during a 6-min overground walk test at comfortable speed, were analysed. The relative aerobic load of walking was determined as the energy demand of walking relative to oxygen uptake at peak and at the first ventilatory threshold. Healthy reference data were used for clinical inference.
Results: People with multiple sclerosis walk at a mean relative aerobic load of 60.0% (standard deviation 12.8%) relative to peak aerobic capacity, and 89.1% (standard deviation 19.9%) relative to the first ventilatory threshold. Fourteen participants walked above the first ventilatory threshold (31%). Peak aerobic capacity was reduced in 45% of participants, and energy demands were increased in 52% of participants.
Conclusion: People with multiple sclerosis walk at a relative aerobic load close to their first ventilatory threshold. A high relative aerobic load can guide clinicians to improve aerobic capacity or reduce the energy demands of walking.
LAY ABSTRACT
People living with multiple sclerosis often experience walking problems, which may be increased by a high energy demand during walking and/or reduced aerobic fitness. In 45 people with multiple sclerosis, this study examined how much of the subject’s total available energy is required during walking; the so-called relative aerobic load of walking. Compared with healthy subjects, those with multiple sclerosis were found to use more energy during walking, while having less energy available. This may result in early exhaustion during walking and can have a negative effect on the daily lives of people with MS. It may be possible to address these effects by appropriate treatment; for example, through aerobic exercise training to improve aerobic fitness or the use of assistive devices to reduce energy demands during walking.
Key words: anaerobic threshold; cardiorespiratory fitness; energy metabolism; gait; rehabilitation.
Citation: J Rehabil Med 2024; 56: jrm13352. DOI: https://doi.org/10.2340/jrm.v56.13352.
Copyright: © Published by Medical Journals Sweden, on behalf of the Foundation for Rehabilitation Information. This is an Open Access article distributed under the terms of the Creative Commons Attribution 4.0 International License (https://creativecommons.org/licenses/by/4.0/)
Submitted: May 16, 2023; Accepted: Jan 11, 2024; Published: Feb 14, 2024
Correspondence address: Arianne S. Gravesteijn, Amsterdam UMC, Department of Rehabilitation Medicine, PO Box 7057, 1007 MB Amsterdam, The Netherlands. E-mail: a.gravesteijn@amsterdamumc.nl
Competing interests and funding: The authors have no conflicts of interest to declare.
In multiple sclerosis (MS), inflammation and degeneration of the central nervous system leads to numerous symptoms, such as loss of muscle strength, poor balance control, pain and fatigue, which, in turn, impact on daily activities, such as walking (1). In the first year of the disease approximately one-quarter of people living with MS (pwMS) already report problems with walking (2), increasing to almost half within 5 years after diagnosis (2). Walking problems consist of spatio-temporal changes (e.g. reduced walking speed, smaller step length, and increased double-support phase), which can contribute to loss of balance control and increased fall risk (3). Walking is considered one of the most important activities of daily life, since it is essential for daily functioning and is closely linked to quality of life (4).
The increased energy demands of walking, together with reduced aerobic capacity, may enhance MS-related walking problems. Several symptoms typical of MS, such as loss of muscle strength and balance control, can contribute to increased energy demands of walking. When walking at speeds similar to healthy controls (HC), pwMS require more energy (5). Furthermore, a systematic review of 40 studies showed that pwMS have a significantly reduced peak aerobic capacity, or so-called cardiorespiratory fitness (V̇O2peak), compared with age- and sex-matched HC (V̇O2peak 25.5 mL/kg/min in pwMS vs V̇O2peak 30.9 mL/kg/min in HC) (6). Moreover, increased energy demands may result in fatigue, which can lead to a more sedentary lifestyle that further reduces peak aerobic capacity, resulting in a downward spiral (7).
In addition to peak aerobic capacity, another important threshold can be determined during a cardiopulmonary exercise test (CPET): the first ventilatory threshold (VT1). The VT1 is the threshold between mild and moderate exercise intensity, and is the point at which aerobic energy supply is supplemented by anaerobic energy to sustain the required energy demand (8). Activities above the VT1 can be performed for a longer period of time, but will eventually lead to exhaustion, whereas activities below VT1 can be sustained for very long periods. A secondary ventilatory threshold (VT2), the threshold between moderate and high exercise intensity, can also be determined during a CPET (8). Activities performed above VT2 can be sustained only for very brief periods.
The energy demand of walking can be expressed both relative to the peak aerobic capacity (%V̇O2peak) and relative to VT1 (%V̇O2VT1). Walking above a relative aerobic load of 100%V̇O2VT1 will result in exhaustion, affecting walking ability (9). Currently no normative values exist, but relative aerobic load has been shown to range between 36% and 49% V̇O2peak in HC study populations (10, 11).
The relative aerobic load of walking is an, as yet, unexplored measure of physiological strain of walking in pwMS, which can give a better insight into the underlying limiting factors by combining the energetic demand of walking with the aerobic capacity. Therefore, the objective of the current study was to examine the relative aerobic load of walking (%V̇O2peak, %V̇O2VT1) in pwMS who experience walking problems. Both aerobic capacity and the energy demands of walking differ between females and males. In general, males with MS have a higher aerobic capacity, but also use more energy during walking compared with females (6, 12). It is therefore hypothesized that the relative aerobic load of walking would be similar for females and males. As regards overall relative aerobic load, it is hypothesized that a reduced peak aerobic capacity and an increased energy demand of walking will cause pwMS to walk at a high relative aerobic load relative to V̇O2peak, and close to 100%V̇O2VT1.
METHODS
Study design
A cross-sectional analysis of physiological and walking parameters was performed in 2 prospective cohorts (Exercise PRO-MS study and Clinical Care Protocol for Gait Disorders in MS) with similar testing procedures and analyses. This manuscript presents the first data collected in these studies. Both studies were conducted in accordance with the Declaration of Helsinki and participants gave written informed consent prior to participation. The Exercise PRO-MS study was approved by the medical ethics review board (MERB) of the VU University Medical Center (VUmc), Amsterdam. For the gait clinical care cohort, ethics approval was waived by the MERB of the VUmc, Amsterdam. Reference number Exercise PRO-MS (METC 2019.676), Reference number gait clinical care cohort (VUmc 2020.461).
In the current analysis pwMS, age ≥18 years with an EDSS of 2.0–6.0, without contraindications for CPET (i.e. no known cardiovascular, pulmonary or metabolic disease or symptoms of cardiovascular disease) were included; cohort-specific inclusion criteria are described below.
Exercise PRO-MS study. The Exercise PRO-MS study is a clinical exercise trial, with 4 measurement sessions each 16 weeks apart (13). PwMS were included in the Exercise PRO-MS study if they had gradual progression of neurological symptoms for 2 years or more. The current study used data from the first or second baseline measurement (i.e. extended baseline period). In most cases data from the first measurement was used, except for 3 participants in whom there was no steady-state oxygen uptake during walking or no maximal CPET. In these three cases, data from the second baseline measurement was used.
Clinical Care Protocol for Gait Disorders in MS. As part of usual care at the Department of Rehabilitation Medicine of Amsterdam UMC, location VUmc, pwMS who visit a rehabilitation physician with a question regarding their walking problems are referred for extensive gait analysis and CPET. Only pwMS who are able to walk for at least 6 min without a walking device were eligible. For research purposes, participants gave informed consent for data collection and use.
Procedures
All participants were scheduled for a CPET and a 6-min overground walking trial within a 2-week period. The median time interval between CPET and walk test was 6 days. Time between measurements was longer than the anticipated 2 weeks in 9 participants, due to sickness or the absence of a participant or assessor, with a maximum gap of 11 weeks in 1 participant.
Demographics and anthropometrics. Before the CPET and walking trial, age, sex, MS subtype, disease duration, height, weight and body mass index (BMI) were determined. In addition, a neurological examination was performed to determine disease severity, as measured by the EDSS (14).
Aerobic capacity. V̇O2peak and oxygen uptake at VT1 (V̇O2VT1) were derived from breath-by-breath gas exchange measurements (Cosmed Quark, Cosmed Benelux BV, The Netherlands) during a CPET on a cycle ergometer (Lode Excalibur Sport, The Netherlands) (15). All participants performed a ramp protocol (5–25 Watt/min) after a 3-min rest phase and a 3-min cycling warm-up phase at 0 Watt. The CPET is the gold standard when determining cardiorespiratory fitness (16), and is considered a valid and safe measure of cardiorespiratory fitness in most pwMS (17).
Energy demands of walking. All participants performed a 6-min overground walk test at a self-selected comfortable walking speed (CWS) on a 27- or 30-m oval track. Breath-by-breath V̇O2 was measured using a mobile gas exchange measurement system (K5, Cosmed Benelux BV, The Netherlands) (15). Both CWS (i.e. total distance travelled, in m/360 s) and travelled distance were determined. No verbal encouragement was given to patients during the test, in order to prevent conversation disturbing the gas exchange measurement.
Data analysis
Aerobic capacity. The CPET was considered maximal if participants reached a respiratory exchange ratio (RER) of 1.10 in combination with subjective signs of exhaustion (i.e. Borg rating of perceived exertion ≥ 17) (6, 18). In the Cosmed Omnia software, peak aerobic capacity was determined as the highest registered unprocessed binned time averaged V̇O2 over at least 20 s at the end ofthe ramp phase (15, 19).
VT1 was determined by a combination of the V-slope method (i.e. V̇O2 plotted against V̇CO2, with VT1 as the point where V̇CO2 exponentially increases) and the ventilation equivalent method (i.e. time plotted against the ventilatory equivalent (VE) of V̇O2 and V̇CO2, with VT1 as the point where VE/V̇O2 starts to increase) (8).
Energy demands of walking. In Matlab (version R2021b Mathwork, Natick, MA, USA) energy demand of walking, or so-called energy expenditure of walking (EEw), in this study presented as mL O2/kg/min, unless otherwise indicated, was derived from the binned time averaged last 3 min of interpolated (1 Hz) breath-by-breath data (15). To check for valid steady state V̇O2,only a minimal change in the V̇O2 slope was accepted (slope of linear curve fit < 0.00025 mL/kg/s) (20).
The energy demand of walking can also be expressed per distance travelled, the so-called energy cost of walking (ECw) in mL O2/kg/m or in J/kg/m, calculated using the following equations: EEw in J/kg/m according Lusk’s equation (1924) = (15,962 + 5155 * RER * (V̇O2 /1000) and ECw = EEw in either O2/kg/min or J/kg/min/(walking speed (m/s)) * 60)) (21).
Relative aerobic load of walking. The relative aerobic load of walking was determined as the EEw relative to either V̇O2peak and expressed as%V̇O2peak, or relative to V̇O2VT1 and expressed as %V̇O2VT1.
Statistical analysis
Statistical analysis was performed using STATA 14 statistical software (Statacorp LP, College Station, TX, USA). Normality of data was checked by visual examination of histograms and the Shapiro–Wilk test. Sex-based differences in EEw, aerobic capacity and relative aerobic load were assessed with an independent samples t-test, or Mann–Whitney U test when assumptions for normality were not met.
Aerobic capacity was compared with reference values to determine whether patients scored worse than age- and sex-matched HC (22). Participants who scored “very poor” (lowest 3%) or “poor” (lowest 3–11%) according to these reference values were classified as having reduced V̇O2peak (22). To compare the energy demand of walking with that of HC, a standard deviation (SD) of 1.5 or more was ranked as an above-average energy demand (21).
As age, sex, disease severity and disease subtype could potentially affect relative aerobic load, a multiple regression analysis was performed, using the enter method to include these factors (6, 7, 12, 22–25).
Both the EEw and ECw are related to walking speed (26, 27). The relationship between EEw and walking speed is best described by a positive linear relationship, whereas the relationship between ECw and walking speed is best described by a U-shaped curve (26, 27). This study also examined these relationships in the study cohort and additionally examined the relationship between relative aerobic load and walking speed using regression analysis.
RESULTS
Participant characteristics
In total, 30 pwMS enrolled in the Exercise PRO-MS study and 24 pwMS enrolled in the Clinical Care Protocol for Gait Disorders in MS. Two participants participated in both studies, but were recruited for the Exercise PRO-MS study prior to enrolment in the Clinical Care Protocol for Gait Disorders in MS. In the Exercise PRO-MS study, 2 participants were not able to walk overground for 6 min and were excluded from the analysis. Another participant in the Exercise PRO-MS study was excluded from the analysis due to an invalid steady state 6-min walk test during the first baseline and a measurement error during the second baseline. Four participants were excluded from the CPET. This resulted in a final group of 45 participants (23 from the Exercise PRO-MS study and 22 from Clinical Care Protocol for Gait Disorders in MS).
Demographics, disease-related characteristics and use of assistive devices during walking are reported in Table I. The Exercise PRO-MS study enrolled only patients with secondary progressive MS, resulting in a majority of patients with secondary progressive MS overall (58%).
| Total (n = 45) | Females (n = 32) | Males (n = 13) | |
| Age, years (mean (SD)) | 48.6 (10.1) | 48.2 (10.3) | 49.6 (9.9) |
| Multiple sclerosis subtype, n (%) Relapsing-remitting multiple sclerosis Secondary progressive multiple sclerosis Primary progressive multiple sclerosis |
16 (36) 26 (58) 3 (7) |
12 (38) 20 (63) – |
4 (31) 6 (46) 3 (23) |
| Disease duration, years (median (IQR)) | 15 (9; 20) | 17 (11; 23) | 11 (3; 17) |
| Expanded Disability Status Scale, median (IQR)a | 4 (3.0; 4.5) | 4 (2.8; 4.8) | 4 (3.5; 4.5) |
| Body weight, kg, median (IQR) | 77 (67; 83) | 73 (66; 82) | 79 (76; 83) |
| Body mass index, kg/m2, median (IQR) | 24.2 (22.6; 27.7) | 24.6 (22.1; 28.6) | 24.2 (23.7; 26.1) |
| Walking aid, n, (%) None Cane Crutch Walker |
39 (87) 3 (7) 2 (4) 1 (2) |
26 (81) 3 (9) 2 (6) 1 (3) |
13 (100) – – – |
| Ankle foot orthosis/functional electrostimulation/Foot-up, n (%) Yes No |
4 (9) 41 (91) |
4 (13) 28 (88) |
– 13 (100) |
| aTwenty-two subjects, based on neurological testing reported in patient files. | |||
| IQR: interquartile range; SD: standard deviation. | |||
Aerobic capacity
CPET performance, V̇O2peak and V̇O2VT1 are shown in Table II. According to the criteria for maximal exercise testing, 33 participants performed a maximal exercise test. VT1 could still be determined in the 12 participants with a submaximal CPET. V̇O2peak was significantly higher in males (2,366 mL/min) than in females (1,638 mL/min), z = –3.02, p = 0.003. When corrected for body weight, males had a higher V̇O2peak (28.9 mL/kg/min) than females (24.2 mL/kg/min), z = –1.72, p = 0.08. VT1 was higher in males (1,422 mL/min) than in females (1,115 mL/min), z = –2.83, p < 0.005, and VT1 adjusted for body weight was also higher in males (18.0 mL/kg/min) compared with females (14.5 mL/kg/min) z = –1.57, p = 0.12.
| Total (n = 45) | Females (n = 32) | Males (n = 13) | |
| Cardiopulmonary exercise test | |||
| Test performance Maximal Submaximal |
33 (73%) 12 (27%) |
23 (72%) 9 (28%) |
10 (77%) 3 (23%) |
| V̇O2peak, mL/kg/mina | 25.4 (19.6; 29.8) | 24.2 (18.7; 29.6) | 28.9 (23.9; 33.9) |
| V̇O2peak, mL/mina | 1,842 (1,499; 2,365) | 1,638 (1,432; 1,914) | 2,366 (1,917; 2,643) |
| V̇O2VT1, mL/kg/min | 16.5 (13.1; 20.1) | 14.5 (12.8; 20.2) | 18.0 (15.9; 20.1) |
| V̇O2VT1, mL/min | 1,242 (1,036; 1,425) | 1,115 (983; 1,310) | 1,422 (1,272; 1,624) |
| Overground walking | |||
| Comfortable walking speed, m/s | 1.09 (0.97; 1.24) | 1.10 (0.97; 1.24]) | 1.06 (0.97; 1.35) |
| Energy expenditure of walking, mL/kg/min | 14.3 (2.4) | 13.9 (2.2) | 15.3 (2.6) |
| Respiratory exchange ratio | 0.82 (0.80; 0.85) | 0.82 (0.80; 0.87) | 0.82 (0.80; 0.83) |
| %V̇O2peaka | 60.0 (12.8) | 62.8 (12.7) | 53.6 (10.9) |
| %V̇O2 VT1 | 89.1 (19.9) | 91.1 (21.0) | 84.3 (16.9) |
| Energy cost of walking, mL/kg/m | 0.22 (0.20; 0.24) | 0.22 (0.20; 0.24) | 0.24 (0.21; 0.25) |
| Energy cost of walking, J/kg/m | 4.44 (4.11; 4.99) | 4.41 (3.95; 4.93) | 4.76 (4.17; 5.04) |
| an = 33 (22 females and 10 males). | |||
| Data are presented as means (standard deviation; SD) for normally distributed data or medians (interquartile range; IQR) for non-normally distributed data. | |||
| %V̇O2peak: relative aerobic load relative to peak oxygen uptake; %V̇O2VT1: relative aerobic load relative to oxygen uptake at the first ventilatory threshold; V̇O2peak: peak oxygen uptake; V̇O2VT1: oxygen uptake at the first ventilatory threshold. | |||
Energy demands of walking
The energy expenditure of walking was lower in females (mean 13.9 mL/kg/min) than in males (mean 15.3 mL/kg/min), t (43) = –1.94, p = 0.06 (Table II). In 33 participants the relative aerobic load of walking was 60.0% of the maximal V̇O2peak, and was higher in females (mean 62.8%V̇O2peak) than in males (mean 53.6%V̇O2peak), t (31)=1.99, p = 0.06. Compared with the VT1 threshold, the relative aerobic load of walking was 89.1% relative to V̇O2VT1 (in 45 participants), and was higher in females (mean 91.1%V̇O2VT1) compared with males (84.3%V̇O2VT1) (t (43) = 1.03, p = 0.31).
Diagnostic interpretation
Compared with reference values for HC, 9 pwMS had a below-average aerobic capacity, 11 pwMS had an above-average ECw and 6 participants had aberrant ECw and cardiorespiratory fitness (Table IIIA). Ten of the 33 pwMS who performed a maximal CPET had a relative aerobic load > 100%V̇O2VT1 (Table IIIB). Of the 45 pwMS included in the study, 14 (31%) walked above their VT1 (> 100%V̇O2VT1) (Table IIIC). These findings indicate a high relative aerobic load, with a substantial number of pwMS walking at an energy expenditure above VT1.
Relationship between relative aerobic load and patient characteristics
A multiple regression analysis was performed to assess the relationship between relative aerobic load and age, sex, severity of MS (EDSS) and MS subtype. Outcomes are presented in Table IV and Fig. S1. Only EDSS added significantly to the model; p = 0.006. The overall model explained 46% of the variance in %V̇O2peak (R2 = 0.460).
The association between %V̇O2VT1 and age, sex, disease severity and MS subtype was not significant F(5, 39)= 1.12, p = 0.36, R2 = 0.126, and none of the variables added significantly to the model.
Relative aerobic load in relation to other physiological measures of walking
The current study also investigated the relationship between CWS and EEw per min, ECw per m, and relative aerobic load (Table V and Fig. 1). The relationship between CWS and ECw (mL/kg/m) was best described by a quadratic or U-curve function. The relationship between CWS and EEw (mL/kg/min) was best described by a linear model, with a significant increase in EEw of 5.7ml O2/kg/min (95% confidence interval (95% CI) 3.72; 7.67) for a 1 m/s faster walking speed. However, the slope for relative aerobic load was non-significant for both %V̇O2peak –13.9 (–35.3; 7.5) and %V̇O2VT1 6.5 (–15.6; 28.7).
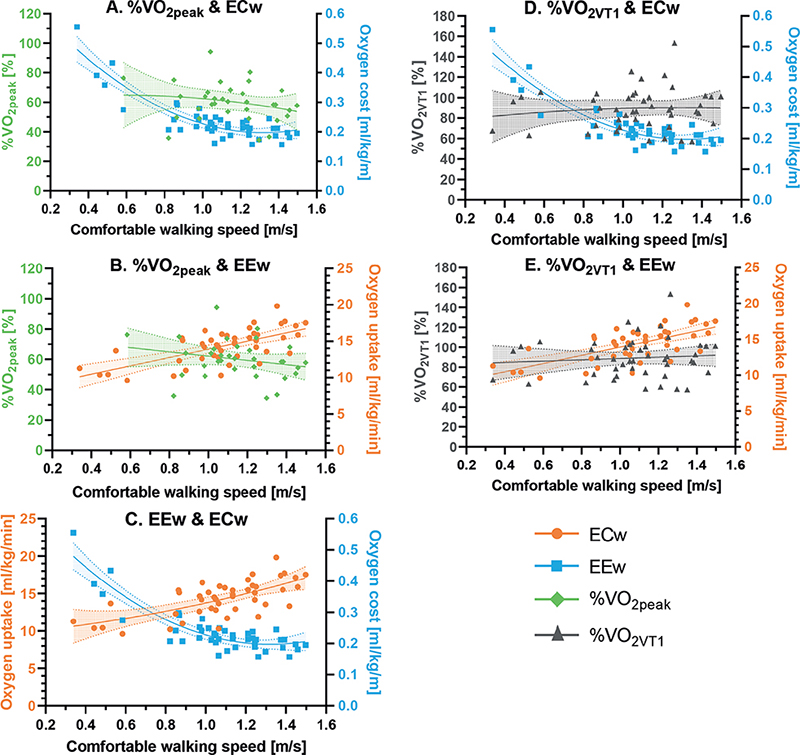
Fig. 1. The relationships between comfortable walking speed with: (A) energy cost of walking (ECw) and relative aerobic load relative to peak oxygen uptake (%VO2peak), (B) with energy expenditure of walking (EEw) and %VO2peak, (C) with EEw and ECw, (D) with ECw and relative aerobic load relative to the first ventilatory threshold (%VO2VT1) and, (E) with EEw and %VO2VT1.
DISCUSSION
The aim of this study was a better understanding of the relative aerobic load of walking in pwMS, based on aerobic capacity and the energy expenditure of walking. The study found a mean relative aerobic load of walking (at CWS) of 60.0%V̇O2peak and 89.1%V̇O2VT1. The study also found that almost one-third of pwMS walked above their VT1 during CWS, indicating a potentially unsustainable relative aerobic load.
Relative aerobic load of walking
To date, the relative aerobic load of walking has only been assessed in relation to amputation (11), stroke (10), cerebral palsy (28, 29) and matched HC in these studies. The relative aerobic load of walking in HC in these studies varied between 36.2%V̇O2peak (10) and 48.7%V̇O2peak (11), which is substantially lower than 60.0%V̇O2peak in our MS population. The relative aerobic load in traumatic amputation, stroke and cerebral palsy patients was approximately 50%V̇O2peak, and was even higher (73%V̇O2peak) in patients with vascular amputation (10, 11, 29). In the only study that investigated %V̇O2VT1, the HC group walked at 65%V̇O2VT1 (10), while a chronic stroke population allocated to more and less impaired groups had relative aerobic loads of 102%V̇O2VT1 and 97%V̇O2VT1, respectively. The relative aerobic load of 89.1%V̇O2VT1 in pwMS in the current study is therefore higher relative to HC but lower than chronic stroke patients.
Relative load might substantially influence walking. Approximately one-third of the current MS study population walked above their VT1, which will lead to exertion during comfortable walking. Earlier literature has shown that using ≥ 50% of V̇O2peak during the day results in exertion (30). The current study found %V̇O2peak of walking to be 60% at CWS, not taking into account factors in daily living, such as uneven surfaces or dual tasking. These additional factors are expected to contribute to an even higher relative aerobic load and will probably affect daily functioning, societal participation and quality of life.
Aerobic capacity
An important component of relative aerobic load is aerobic capacity. A median V̇O2peak of 25.4 mL/kg/min (IQR 19.6; 29.8) is in line with review findings in pwMS (mean V̇O2peak 25.5 mL/kg/min, SD 5.2), and is lower compared with HC (mean V̇O2peak 30.9, SD 5.4) (6). However, comparing V̇O2peak with reference values for age- and sex-matched HC is difficult, as several reference values exist and, due to heterogeneity in study populations and methodologies, an ideal set of reference values is not yet available (25). In the current study we compared our data with normative values used in clinical practice, derived from a literature review that included V̇O2peak data from 141 healthy, untrained, sedentary or mildly active individuals aged 6–75 years, compiled from 62 different studies conducted in North America, Europe, and Israel, all published prior to 1986. The testing modalities consisted of cycle ergometer (32 studies), treadmill (25 studies) or recumbent stepper (5 studies) (22). Using these normative values, 15 people were classified as having reduced V̇O2peak (below the 11th percentile), while 18 people had a “normal” V̇O2peak (22). However, other reference values result in different numbers. Compared with Danish norm values 23 people had a V̇O2peak below the 20th percentile (31), compared with German norm values 16 people scored below the 20th percentile (32), and compared with reference values from the USA only 9 participants had a V̇O2peak below the 20th percentile (33). On average, this is in line with the primarily used reference values in this study.
The ventilatory threshold VT1 marks the point at which the anaerobic energy supply becomes predominant, resulting in physiological changes that will lead to unsustainability of the activity (34). VT1 has received little attention, especially in pwMS (35, 36). Data from a large cohort of healthy individuals (N = 8,155) in the USA found a VT1 of 14.9 mL/kg/min (SD 4.1), with a significant difference between males (mean 15.3 mL/kg/min, SD 3.9) and females (mean 13.3 mL/kg/min, SD 4.3) (37). This is lower compared with our finding of 16.5 mL/kg/min for the total group, with 18.0 mL/kg/min in males and 14.6 mL/kg/min in females. Previous studies in pwMS reported V̇O2VT1 levels ranging from 13.6 to 18.7 mL/kg/min (35, 36), similar to the current findings. The higher V̇O2VT1 found in pwMS might be related to increased energy expenditure during daily activities, which might inflict training effects already during these activities (38). The VT1 could be an important measure, since this threshold is a marker for exhaustion during prolonged activities, which, in turn, impacts specific daily activities, such as walking (34). However, as determination of VT1 is rater-dependent and several different measurement techniques have been described (i.e. V-slope method, equivalents method), VT1 may be more prone to error (39). It is also questionable whether a ramp protocol is the best approach to determine VT1, as increments are very short (i.e. seconds), whereas increments of several minutes might allow more precise determination of VT1 (40, 41). An appropriate CPET protocol and set of reference values for both V̇O2peak and V̇O2VT1 are very important in the valid interpretation of these measures of aerobic fitness.
Energy demands of walking
When determining the relative aerobic load of walking, the other important component is energy expenditure during walking. According to Ainsworth’s compendium of physical activity in healthy people, walking at 1.1 m/s will result in an energy expenditure of 10.5 mL/kg/min (42), which is lower than the 14.6 mL/kg/min found in the current study. However, the energy expenditure per min of walking depends heavily on walking speed. In line with previous research, in the current study higher walking speeds resulted in significantly higher energy expenditure (26). To correct for dependency on walking speed ECw is often presented (27), expressed as mL O2/kg/m or J/kg/m. The ECw of participants in the current study was higher (median 4.4 J/kg/m) compared with HC aged 18–41 years (mean 3.4 J/kg/m, SD 0.4) and adults > 59 years (mean 3.8 J/kg/m, SD 0.4) (21). A recent systematic review reported an ECw of 0.18 mL O2/kg/m in HC and 0.23 mL O2/kg/m in pwMS, the latter being in line with the 0.22 mL O2/kg/m found in the current study (43).
The relationship between walking speed and ECw can be described by a U-shaped curve, which was also the case in the current study. Habitual walking speed is assumed to optimize to the lowest ECw (27). PwMS, however, walk at a lower CWS compared with HC (23), which might explain the increased ECw in this group (43). Nonetheless, in gait laboratory experiments pwMS are able to increase their walking speed to, for example, 1.5–1.8 m/s, which reduced or maintained the ECw (43). Clearly, the relationship between CWS and ECw is less well understood in pwMS. The current study was not able to demonstrate a significant relationship between the relative aerobic load of walking and walking speed, which may indicate that pwMS might chose a walking speed of approximately 60%V̇O2peak or just below VT1, as higher loads could be unsustainable for prolonged walking.
Strengths and limitations
This is the first study to examine the relative aerobic load of walking in pwMS who experience walking problems during daily living. One limitation is that V̇O2peak andV̇O2VT1 were measured during cycle ergometer CPET and compared with the energy expenditure of walking. Thus, relative aerobic load was a product of both cycling and walking assessments. In the current study, treadmill tests were not deemed feasible for pwMS with walking impairments; hence cycle ergometer CPETs were chosen despite possible deviation in relative aerobic load.
Clinical implications and future research
The relative aerobic load of walking is a comparatively new and unexplored measure of walking, which could potentially improve the clinical understanding of walking problems experienced by pwMS. It is often assumed that people adjust their walking speed to minimize the ECw (27, 43). However, pwMS with a reduced aerobic capacity might reduce their walking speed to lower energy expenditure and relative aerobic load, subsequently walking at a high energy cost. Optimizing towards an optimal ECw in these patients may result in a high, unsustainable aerobic load relative to V̇O2peak orV̇O2VT1.
To better understand and interpret a person’s relative aerobic load of walking, it would be useful to examine the relationship with different walking speeds in the same person, and establish an appropriate set of reference values based on a large group of both patients and HC.
The relative aerobic load of walking has important clinical implications, not only for walking but also for other daily activities. As both a reduced aerobic capacity and an increased energy demand contribute to a high relative aerobic load, interventions should take these contributing factors into consideration. When a high relative aerobic load is caused by a reduction in V̇O2peak or VT1, exercise interventions to improve cardiorespiratory fitness might be warranted (6). A meta-analysis demonstrated that aerobic exercise interventions improve aerobic capacity in pwMS (6). To specifically improve VT1, training intensities near or above VT1 might result in better outcomes (38, 44). Gait training, unsupported or supported, can help alleviate peripheral mitochondrial dysfunction and decrease additional anaerobic energy supply (45). A reduction in energy expenditure during walking can be effectively achieved with assistive devices, such as an ankle-foot orthosis or push-off specific muscle strength training (46, 47).
In conclusion, the relative aerobic load of walking in pwMS is high, and close toV̇O2VT1. To walk at a sustainable energy expenditure relative to either V̇O2peak orV̇O2VT1, pwMS may reduce their CWS, resulting in an increased ECw per metre. The relative aerobic load of walking can differentiate between problems related to aerobic capacity and those related to gait, and is therefore a valuable measure in clinical rehabilitation.
ACKNOWLEDGEMENTS
The authors would like to thank our colleague Koen Wishaupt (Amsterdam UMC location VUmc, Department of Rehabilitation Medicine, Vrije Universiteit Amsterdam, Amsterdam, The Netherlands) and the students (Amsterdam Movement Sciences Research Institute, Rehabilitation & Development, Amsterdam, The Netherlands) Tieme Arkema, Amber van der Kruit, Femke Janssen, Nienke Heida and Jaimy van der Hout for their assistance with measurements.
The Exercise PRO-MS study was supported by the Dutch MS Research Foundation (grant number 18-358f MS). The funding organization had no role in the study design, data collection, data analysis, interpretation of data, writing of the report and in the decision to submit the article for publication.
The Exercise PRO-MS study and Clinical Care Protocol for Gait Disorders in MS were both conducted in accordance with the Declaration of Helsinki and participants gave written informed consent prior to participation. The Exercise PRO-MS study was approved by the medical ethics review board (MERB) of the VU University Medical Center (VUmc), Amsterdam. For the gait clinical care cohort, ethics approval was waived by the MERB of the VUmc, Amsterdam.
Trial registration. The Exercise PRO-MS study was registered prospectively at the Dutch Trial Registry (number NL8265, date 06-01-2020). The Clinical Care Protocol for Gait Disorders in MS was not prospectively registered.
REFERENCES
- McGinley MP, Goldschmidt CH, Rae-Grant AD. Diagnosis and treatment of multiple sclerosis: a review. JAMA 2021; 325: 765–779. DOI: 10.1001/jama.2020.26858
- Kister I, Bacon TE, Chamot E, Salter AR, Cutter GR, Kalina JT, et al. Natural history of multiple sclerosis symptoms. Int J MS Care 2013; 15: 146–158. DOI: 10.7224/1537-2073.2012-053
- Comber L, Galvin R, Coote S. Gait deficits in people with multiple sclerosis: a systematic review and meta-analysis. Gait Posture 2017; 51: 25–35. DOI: 10.1016/j.gaitpost.2016.09.026
- Larocca NG. Impact of walking impairment in multiple sclerosis: perspectives of patients and care partners. Patient 2011; 4: 189–201. DOI: 10.2165/11591150-000000000-00000
- Sandroff BM, Motl RW, Suh Y. Accelerometer output and its association with energy expenditure in persons with multiple sclerosis. J Rehabil Res Dev 2012; 49: 467–475. DOI: 10.1682/jrrd.2011.03.0063
- Langeskov-Christensen M, Heine M, Kwakkel G, Dalgas U. Aerobic capacity in persons with multiple sclerosis: a systematic review and meta-analysis. Sports Med 2015; 45: 905–923. DOI: 10.1007/s40279-015-0307-x
- Motl RW, Sandroff BM, Suh Y, Sosnoff JJ. Energy cost of walking and its association with gait parameters, daily activity, and fatigue in persons with mild multiple sclerosis. Neurorehabil Neural Repair 2012; 26: 1015–1021. DOI: 10.1177/1545968312437943
- American Thoracic Society, American College of Chest Physicians. ATS/ACCP Statement on cardiopulmonary exercise testing. Am J Respir Crit Care Med 2003; 167: 211–277. DOI: 10.1164/rccm.167.2.211
- Poole DC, Rossiter HB, Brooks GA, Gladden LB. The anaerobic threshold: 50+ years of controversy. J Physiol 2021; 599: 737–767. DOI: 10.1113/JP279963
- Blokland I, Gravesteijn A, Busse M, Groot F, van Bennekom C, van Dieen J, et al. The relationship between relative aerobic load, energy cost, and speed of walking in individuals post-stroke. Gait Posture 2021; 89: 193–199. DOI: 10.1016/j.gaitpost.2021.07.012
- Wezenberg D, van der Woude LH, Faber WX, de Haan A, Houdijk H. Relation between aerobic capacity and walking ability in older adults with a lower-limb amputation. Arch Phys Med Rehabil 2013; 94: 1714–1720. DOI: 10.1016/j.apmr.2013.02.016
- Manca A, Cano A, Ventura L, Martinez G, Frid L, Deriu F, et al. Sex-based differences in oxygen cost of walking and energy equivalents in minimally disabled individuals with multiple sclerosis and controls. Int J MS Care 2022; 24: 54–61. DOI: 10.7224/1537-2073.2020-112
- Gravesteijn AS, Beckerman H, de Jong BA, Hulst HE, de Groot V. Neuroprotective effects of exercise in people with progressive multiple sclerosis (Exercise PRO-MS): study protocol of a phase II trial. BMC Neurol 2020; 20: 177. DOI: 10.1186/s12883-020-01765-6
- Kurtzke JF. Rating neurologic impairment in multiple sclerosis: an expanded disability status scale (EDSS). Neurology 1983; 33: 1444–1452. DOI: 10.1212/wnl.33.11.1444
- Nolte S, Rein R, Quittmann OJ. Data processing strategies to determine maximum oxygen uptake: a systematic scoping review and experimental comparison with guidelines for reporting. Sports Med 2023; 10.1007/s40279-023-01903-3. DOI: 10.1007/s40279-023-01903-3
- Albouaini K, Egred M, Alahmar A, Wright DJ. Cardiopulmonary exercise testing and its application. Postgrad Med J 2007; 83: 675–682. DOI: 10.1136/hrt.2007.121558
- Heine M, Hoogervorst EL, Hacking HG, Verschuren O, Kwakkel G. Validity of maximal exercise testing in people with multiple sclerosis and low to moderate levels of disability. Phys Ther 2014; 94: 1168–1175. DOI: 10.2522/ptj.20130418
- Borg GA. Psychophysical bases of perceived exertion. Med Sci Sports Exerc 1982; 14: 377–381.
- Holland AE, Dowman L, Fiore J Jr, Brazzale D, Hill CJ, McDonald CF. Cardiorespiratory responses to 6-minute walk test in interstitial lung disease: not always a submaximal test. BMC Pulm Med 2014; 14: 136. DOI: 10.1186/1471-2466-14-136
- Plasschaert F, Jones K, Forward M. Energy cost of walking: solving the paradox of steady state in the presence of variable walking speed. Gait Posture 2009; 29: 311–316. DOI: 10.1016/j.gaitpost.2008.09.015
- Das Gupta S, Bobbert MF, Kistemaker DA. The metabolic cost of walking in healthy young and older adults – a systematic review and meta analysis. Sci Rep 2019; 9: 9956. DOI: 10.1038/s41598-019-45602-4
- Shvartz E, Reibold RC. Aerobic fitness norms for males and females aged 6 to 75 years: a review. Aviat Space Environ Med 1990; 61: 3–11.
- Buoite Stella A, Morelli ME, Giudici F, Sartori A, Manganotti P, di Prampero PE. Comfortable walking speed and energy cost of locomotion in patients with multiple sclerosis. Eur J Appl Physiol 2020; 120: 551–566. DOI: 10.1007/s00421-019-04295-3
- Heine M, Wens I, Langeskov-Christensen M, Verschuren O, Eijnde BO, Kwakkel G, et al. Cardiopulmonary fitness is related to disease severity in multiple sclerosis. Mult Scler 2016; 22: 231–238. DOI: 10.1177/1352458515581437
- Paap D, Takken T. Reference values for cardiopulmonary exercise testing in healthy adults: a systematic review. Expert Rev Cardiovasc Ther 2014; 12: 1439–1453. DOI: 10.1586/14779072.2014.985657
- Ludlow LW, Weyand PG. Energy expenditure during level human walking: seeking a simple and accurate predictive solution. J Appl Physiol 2016; 120: 481–494. DOI: 10.1152/japplphysiol.00864.2015
- Ralston HJ. Energy-speed relation and optimal speed during level walking. Int Z Angew Physiol 1958; 17: 277–283. DOI: 10.1007/BF00698754
- Balemans AC, Bolster EA, Brehm MA, Dallmeijer AJ. Physical strain: a new perspective on walking in cerebral palsy. Arch Phys Med Rehabil 2017; 98: 2507–2513. DOI: 10.1016/j.apmr.2017.05.004
- Slaman J, Bussmann J, van der Slot WM, Stam HJ, Roebroeck ME, van den Berg-Emons RJ, et al. Physical strain of walking relates to activity level in adults with cerebral palsy. Arch Phys Med Rehabil 2013; 94: 896–901. DOI: 10.1016/j.apmr.2012.11.005
- Shephard RJ. Independence: a new reason for recommending regular exercise to your patients. Phys Sportsmed 2009; 37: 115–118. DOI: 10.3810/psm.2009.04.1691
- Eriksen L, Gronbaek M, Helge JW, Tolstrup JS. Cardiorespiratory fitness in 16 025 adults aged 18–91 years and associations with physical activity and sitting time. Scand J Med Sci Sports 2016; 26: 1435–1443. DOI: 10.1111/sms.12608
- Rapp D, Scharhag J, Wagenpfeil S, Scholl J. Reference values for peak oxygen uptake: cross-sectional analysis of cycle ergometry-based cardiopulmonary exercise tests of 10 090 adult German volunteers from the Prevention First Registry. BMJ Open 2018; 8: e018697. DOI: 10.1136/bmjopen-2017-018697
- Kaminsky LA, Imboden MT, Arena R, Myers J. Reference standards for cardiorespiratory fitness measured with cardiopulmonary exercise testing using cycle ergometry: data from the Fitness Registry and the Importance of Exercise National Database (FRIEND) Registry. Mayo Clin Proc 2017; 92: 228–233. DOI: 10.1016/j.mayocp.2016.10.003
- Myers J, Ashley E. Dangerous curves. A perspective on exercise, lactate, and the anaerobic threshold. Chest 1997; 111: 787–795. DOI: 10.1378/chest.111.3.787
- Hodges LD, Nielsen T, Baken D. Physiological measures in participants with chronic fatigue syndrome, multiple sclerosis and healthy controls following repeated exercise: a pilot study. Clin Physiol Funct Imaging 2018; 38: 639–644. DOI: 10.1111/cpf.12460
- Klaren RE, Sandroff BM, Fernhall B, Motl RW. Comprehensive profile of cardiopulmonary exercise testing in ambulatory persons with multiple sclerosis. Sports Med 2016; 46: 1365–1379. DOI: 10.1007/s40279-016-0472-6
- Vainshelboim B, Arena R, Kaminsky LA, Myers J. Reference standards for ventilatory threshold measured with cardiopulmonary exercise testing: the fitness registry and the importance of exercise: a national database. Chest 2020; 157: 1531–1537. DOI: 10.1016/j.chest.2019.11.022
- Londeree BR. Effect of training on lactate/ventilatory thresholds: a meta-analysis. Med Sci Sports Exerc 1997; 29: 837–843. DOI: 10.1097/00005768-199706000-00016
- Gaskill SE, Ruby BC, Walker AJ, Sanchez OA, Serfass RC, Leon AS. Validity and reliability of combining three methods to determine ventilatory threshold. Med Sci Sports Exerc 2001; 33: 1841–1848. DOI: 10.1097/00005768-200111000-00007
- Bentley DJ, Newell J, Bishop D. Incremental exercise test design and analysis: implications for performance diagnostics in endurance athletes. Sports Med 2007; 37: 575–586. DOI: 10.2165/00007256-200737070-00002
- Zuniga JM, Housh TJ, Camic CL, Bergstrom HC, Schmidt RJ, Johnson GO. The effect of different exercise protocols and regression-based algorithms on the assessment of the anaerobic threshold. J Strength Cond Res 2014; 28: 2507–2512. DOI: 10.1519/JSC.0000000000000440
- Ainsworth BE, Haskell WL, Whitt MC, Irwin ML, Swartz AM, Strath SJ, et al. Compendium of physical activities: an update of activity codes and MET intensities. Med Sci Sports Exerc 2000; 32: S498–504. DOI: 10.1097/00005768-200009001-00009
- Theunissen K, Plasqui G, Boonen A, Brauwers B, Timmermans A, Meyns P, et al. The relationship between walking speed and the energetic cost of walking in persons with multiple sclerosis and healthy controls: a systematic review. Neurorehabil Neural Repair 2021; 35: 486–500. DOI: 10.1177/15459683211005028
- Gaskill SE, Walker AJ, Serfass RA, Bouchard C, Gagnon J, Rao DC, et al. Changes in ventilatory threshold with exercise training in a sedentary population: the HERITAGE Family Study. Int J Sports Med 2001; 22: 586–592. DOI: 10.1055/s-2001-18522
- Manfredini F, Straudi S, Lamberti N, Patergnani S, Tisato V, Secchiero P, et al. Rehabilitation improves mitochondrial energetics in progressive multiple sclerosis: the significant role of robot-assisted gait training and of the personalized intensity. Diagnostics (Basel) 2020; 10: 834. DOI: 10.3390/diagnostics10100834
- Bregman DJ, Harlaar J, Meskers CG, de Groot V. Spring-like ankle foot orthoses reduce the energy cost of walking by taking over ankle work. Gait Posture 2012; 35: 148–153. DOI: 10.1016/j.gaitpost.2011.08.026
- Heine M, Richards R, Geurtz B, Los F, Rietberg M, Harlaar J, et al. Preliminary effectiveness of a sequential exercise intervention on gait function in ambulant patients with multiple sclerosis – a pilot study. Clin Biomech (Bristol, Avon) 2019; 62: 1–6. DOI: 10.1016/j.clinbiomech.2018.12.012