ORIGINAL REPORT
RASCH ANALYSIS OF THE FORGOTTEN JOINT SCORE IN PATIENTS WITH TOTAL HIP ARTHROPLASTY
Flavia STANO, PT1#, Leonardo PELLICCIARI, PhD2#, Fabio LA PORTA, PhD2, Daniele PISCITELLI, PhD3, Domenico ANGILECCHIA, MSc1,4, Maria SIGNORELLI, PT5, Giuseppe GIOVANNICO, MSc1, Sanaz POURNAJAF, MSc6* and Serena CASELLI, PhD7*
From the 1Department of Medicine and Health Science “Vincenzo Tiberio”, University of Molise, Campobasso, 2IRCCS Istituto delle Scienze Neurologiche di Bologna, Bologna, Italy, 3Department of Kinesiology, University of Connecticut, Storrs, CT, USA, 4Rehabilitation service – ASL, Bari, Italy, 5Rehabilitation Service “San Giovanni di Dio”, Adelfia, Italy, 6Neurorehabilitation Research Laboratory, Department of Neurological and Rehabilitation Sciences, IRCCS San Raffaele, Rome, Italy, 7Unità Operativa Complessa di Medicina Riabilitativa, Azienda Ospedaliero-Universitaria di Modena, Modena, Italy
#These authors contributed equally to this work and should be considerd as first authors. *Co-last authors
Objective: To assess the internal construct validity, including local independence, unidimensionality, monotonicity, and invariance, reliability, and targeting of the Forgotten Joint Score within the Rasch Measurement Theory framework.
Design: Cross-sectional study.
Patients: A total of 111 patients with total hip arthroplasty at least 3 months after surgery.
Methods: The Forgotten Joint Score was submitted to each subject during their rehabilitative treatment in an Italian centre and then to Rasch analysis.
Results: The base Rasch analysis showed a satisfactory fit to the model with strict unidimensionality and no differential item functioning. However, monotonicity (11 out of 12 items showed disordered thresholds) and local independence were violated. After rescoring 10 items and creating 5 subtests to account for local dependence, the scale satisfied all the other Rasch model requirements (i.e. invariance, local independence, monotonicity, unidimensionality, and multi-group invariance), with reliability indexes (> 0.850) for measurement at the individual level and proper targeting. A raw-score-to-measure conversion table was provided.
Conclusion: After structural (i.e. collapsing items categories) and non-structural (i.e. creating subtests) strategies, the Forgotten Joint Score satisfied the measurement requirements of the Rasch model, and it can be used in patients with total hip arthroplasty in clinical and research settings.
LAY ABSTRACT
The Forgotten Joint Score (FJS) is a questionnaire used to quantify a patient’s ability to forget their operated prosthetic joint. A recent study suggested shortcomings in FJS unidimensionality; that is, the ability to measure a single variable. Therefore, this study performed a deep psychometric analysis in 111 patients with total hip replacement. Most item thresholds were disordered, meaning patients could not coherently discriminate between the score categories. Furthermore, local dependence between items was found, showing that item responses were dependent among them. After structural modifications, that is, collapsing item categories to solve the disordered thresholds and non-structural modifications, that is, creating subtests to solve the local dependence, the FSJ showed good psychometric properties. Although the number of observations was sufficient for a calibration sample, further studies are needed to confirm these results. A conversion table has been provided to enable clinicians and researchers to use the FJS as an interval measure.
Key words: arthroplasty; hip; outcome assessment, healthcare; patient-reported outcome measures; psychometrics; replacement.
Citation: J Rehabil Med 2024; 56: jrm15774. DOI: https://doi.org/10.2340/jrm.v56.15774.
Copyright: © Published by Medical Journals Sweden, on behalf of the Foundation for Rehabilitation Information. This is an Open Access article distributed under the terms of the Creative Commons Attribution-NonCommercial 4.0 International License (https://creativecommons.org/licenses/by-nc/4.0/)
Submitted: Jul 3, 2023; Accepted: Nov 14, 2023; Published: Jan 10, 2024
Correspondence address: Leonardo Pellicciari, IRCCS Istituto delle Scienze Neurologiche di Bologna, Via Altura, 3, IT-40139 Bologna, Italy. E-mail: leonardo.pellicciari@gmail.com
Competing interests and funding: The authors have no conflicts of interest to declare.
Total hip arthroplasty (THA) is considered the standard care for treating end-stage hip osteoarthritis (1), providing pain relief, and improving function (2) and quality of life (3). In Italy in 2020, 30,980 hip arthroplasty interventions were performed, despite a decrease of 25% from 2019 due to the SARS-CoV-2 (COVID-19) pandemic period (4).
Patient-reported outcome measures (PROMs) showcase the effectiveness of THA from the patient’s perspective (5). PROMs encompass data reported directly by people about their symptoms, physical functioning, and quality of life (6), which may differ from those detected by healthcare professionals (7).
The Forgotten Joint Score (FJS) is a PROM consisting of 12 items, developed by Behrend et al. (8) to quantify “the patient’s ability to forget the operated joint” in everyday life in patients with THA or total knee arthroplasty (TKA), which is indirectly related to the patient’s quality of life after surgery. The items composing the questionnaire have a 5-Likert ordinal scale and assess the person’s awareness regarding the presence of a joint prosthesis while performing various activities of daily living (ADLs), such as lying in bed at night or sitting on a chair.
Although preliminary analyses supported the internal consistency, test-retest reliability (8), external construct validity, and responsiveness of the FJS in patients with THA (9), we recently conducted a psychometric study on the Italian FJS version in 111 patients with THA (10), evaluating the internal construct validity within the classical test theory (CTT) psychometric framework. After translation and cross-cultural adaptation of the FJS into Italian, the high internal consistency, both in terms of Cronbach’s alpha (= 0.944) and inter-item correlations (all correlations > 0.6), and the excellent test-rest reliability (intraclass correlation coefficient = 0.958) were confirmed. However, a confirmatory factor analysis (CFA) showed the initial data misfit to a 1-factor model, suggesting a lack of unidimensionality for the total score and the presence of local dependence between items FJS06 and FJS09. After accounting for this local dependence, the FJS fit to a 1-factor CFA improved significantly, except for the root mean square error of approximation (= 0.087), which was slightly above the recommended threshold (≤ 0.08) (11). Hence, the CFA findings highlighted the need for a more in-depth assessment of the internal construct validity of the FJS within the Rasch measurement theory framework.
Rasch analysis (12–15) is a statistical technique assessing the fit of subjects’ responses to a given scale or questionnaire according to the Rasch model requirements. Rasch measurement theory helps to identify and address potential violations of the internal construct validity model’s requirements and enables the evaluation of separation reliability and scale targeting to the sample. Given the properties of the Rasch model, it is possible to estimate item difficulties and person abilities on the same measurement continuum when data conforms to the model’s requirements. Moreover, the total score can be transformed from an ordinal to a linear interval-level scale, with the logit as the unit of measurement (12, 14).
Therefore, the aim of this study was to assess the internal construct validity, including local independence, unidimensionality, monotonicity and measurement invariance, reliability, and targeting of the FJS in patients with THA through Rasch analysis.
METHODS
Subjects and setting
Complete details of the study methodology, including the enrolment procedures, the setting, the sample and the scale descriptive statistics, have been published previously (10).
In summary, 111 adults (> 18 years old) who had undergone THA at least 3 months before the study were enrolled through a convenient sample method. Subjects with a poor understanding of the Italian language or with hip replacement revision or neurological, visual, or cognitive impairment were excluded.
The Italian FJS version (10) was administered to each subject during the rehabilitative treatment at the Rehabilitation Service “San Giovanni di Dio”, Adelfia, Italy, from December 2020 to December 2021.
The ethics commitee of IRCCS San Raffaele, Italy, approved the study protocol (number: RP 20/17)), which followed the principles outlined in the Declaration of Helsinki. Participants gave written informed consent to participate in the study.
Outcome measure
The FJS (8) comprises 12 items, investigating the patient’s awareness of the joint prosthesis during different ADLs. Each item is scored on a 5-point Likert scale: 0 = never, 1 = almost never, 2 = seldom, 3 = sometimes, 4 = mostly. According to the authors of the original version (8), all item responses must be summed and divided by the number of completed items. This mean value is subsequently multiplied by 25 to obtain a total score range from 0 to 100 points. Finally, the score is subtracted from 100 to change the direction of the final score in a way that high scores indicate a high degree of “forgetting” the prosthetic joint, that is, a low degree of awareness. A higher score indicated a higher ability to forget THA daily.
The current study calculated the total score by summing each item score, based on a previous Rasch analysis study on the FJS in patients with TKA by Niama Natta et al. (16), obtaining a measure of “awareness” of the prosthetic joint for each patient.
Rasch analysis
The FJS data were subjected to fitting to the Rasch model (12). Rasch analysis, which involves the evaluation of the Rasch model’s assumptions and requirements, has been discussed extensively elsewhere (12–15). This study was conducted utilizing the partial credit parameterisation of the Rasch model, which does not impose any restrictions on the item threshold parameters (17).
The methods employed to interpret the Rasch analysis output have been comprehensively described in previous publications (18–20). In summary, to elucidate the analysis outputs, the following summary statistics were reported:
Fit to the Rasch model: this pertains to the stochastically invariant ordering of the item. It is evaluated through the mean and standard deviation (SD) of the item and person fit residuals, as well as a summary χ2 interaction statistic. An acceptable fit to the model is attained when all individual item and person fit residuals are within ± 2.5. As a summary measure, the grouped SD value of the item and person fit residuals should also be ≤ 1.4 to indicate adequate fit (12). In addition, the summary item χ2 should not be significant after Bonferroni’s correction, indicating no deviation from the model’s expectations (21). The current study also evaluated the item characteristic curves, representing the discrepancy between the observed and predicted responses for each item based on the probabilistic relationship between a person’s ability and the item difficulty (12, 15).
Internal construct validity requirements:
◦ Unidimensionality: each scale item must measure a single underlying variable (13, 14). To evaluate this requirement, the current study employed a paired t-test on the separate person parameter estimates for each subject, obtained from 2 subsets of items identified through a principal component analysis of the residuals (22). Unidimensionality was ascertained by examining the proportion of significant tests (PST) and the lower limit of the binomial confidence interval for proportions (BCI), which was considered “strict” if less than 5%. We regarded unidimensionality as “acceptable” if only the BCI were below 5% (23).
◦ Monotonicity: this dictates that the likelihood of endorsing an FJS item or response option reflects the patient’s awareness about their operated joint. As per this principle, the increase in the underlying latent trait, i.e., awareness of their properly operated joint, should correspond to a parallel increase in the probability of endorsing items related to higher awareness (14, 24). The adequacy of this requirement is evaluated based on the percentage of items with disordered thresholds, with a value of 0% deemed optimal for ensuring adequate monotonicity.
◦ Local independence: this denotes that a person’s ability accounts for all the variation in their responses to an item, with no other systematic association between responses for a given ability level. To evaluate local independence, we used a local dependence relative cut-off (LDRC), calculated by adding 0.2 to the mean of the residual correlations after removing each item’s correlation with itself (i.e. equal to 1) (18, 25).
◦ Absence of differential item functioning (DIF): this requires that an item remain invariant across relevant subgroups or person factors (e.g. sex). This indicates that different groups of individuals, with equivalent levels of underlying characteristics within a given person factor, should respond similarly regardless of their group affiliation. The current study considered uniform and non-uniform DIF. To assess the presence of DIF, this study conducted a 2-way analysis of variance (ANOVA) for each item, comparing scores across each level of the person factor. DIF occurs when the ANOVA p-values fall significantly below the Bonferroni correction (14, 24). Specifically, we analysed sex (male vs female) and age (< 61 years vs ≥ 61 years, based on the median value of the sample) as person factors in the DIF analysis.
Targeting and reliability:
◦ Targeting: this pertains to the degree of matching between a scale measurement range and the distribution of the calibrating sample (14, 15). The floor and ceiling effects and the targeting index were examined to evaluate targeting. The targeting index was calculated as the ratio between the mean person location and the standard error of the measurement. Based on this assessment, the targeting was deemed “good” and “fair” within 1 standard error and 2 standard errors, correspondingly (26).
◦ Separation reliability: this refers to the ability of a scale to distinguish persons effectively based on their ability level. This was measured by various indices, including the Person Separation Index (PSI), Cronbach’s alpha (α), and the number of statistically distinct levels (strata) (14, 15, 26, 27). In addition, in cases where mistargetting was a concern, the Distribution-Independent Person Separation Index (DI-PSI) and the number of statistically Distinct Levels of Performance Ability (DLPA) were calculated (28). For individual person and group-level measurements, PSI or DI-PSI values of ≥ 0.85 and ≥ 0.70, respectively, are considered sufficient (29, 30).
When the data demonstrated non-conformity with the Rasch model, we progressively adjusted the scale to account for the violations of the internal construct validity requirements.
This iterative process was achieved through a post-hoc modification of individual items, which can be statistical and structural. The first, referred to as “statistical”, involves adjustments to the scale structure while keeping the total score range intact. These adjustments, such as “subtest creation” (13, 31, 32) and “item splitting” (14), primarily impact the conversion of total scores into estimates of the ability to address local independence violations and uniform DIF, respectively. Differently, the second approach, known as “structural”, actively modifies the scale structure through “item rescoring” (14, 15, 33) in case of disordered thresholds, or “item deleting” in case of misfitting or non-uniform DIF (31). These modifications affect the total score range and are used to resolve monotonicity violations and persistent model misfits, respectively. “Item rescoring” is accomplished by collapsing adjacent response categories and following established guidelines (34) to optimize statistical and clinical meaning (13, 33), while “item deleting” is employed as a last resort when other modifications have failed.
Given that the FJS has already been published and widely used as a questionnaire, our objective would be to prioritize the statistically conservative approach while minimizing the implementation of structure-modifying strategies, particularly in cases where the scale fails to attain satisfactory internal construct validity. Consequently, the fit of the scale to the Rasch model, internal construct validity requirements, reliability, and targeting were evaluated during the initial analysis of the scale. Subsequently, following each scale modification, these parameters were reassessed to confirm that the model fit was adequate. This process was iteratively conducted until no further alterations were necessary or feasible.
Should DIF be detected in the solution obtained so far, the influence of the item/ subtest splitting on the person estimates would be tested using the procedure presented by Maritz et al. (32). After item/subtest splitting, we would anchor the “split” solution on the “un-split” one, using an item/subtest free from the DIF, and compare the person estimates of the two solutions, calculating an effect size (Cohen’s d) of the paired t-test of the difference. A Cohen’s d < 0.2 would be considered negligible; thus, the DIF would not be adjusted for (32). Otherwise, the “split” solution would be chosen as the final (32).
Should a final fitting solution following the above modifications be found, its total score would be transformed into interval-level measurements, whose unit is the logit (12, 14, 15).
The Rasch analysis was conducted using the RUMM2030 software (version 5.4 for Windows. RUMM Laboratory Pty Ltd, Perth, Australia: 1997–2010; www.rummlab.com), employing a pairwise maximum likelihood estimation algorithm. A significance value of 0.05 was used throughout and adjusted for the number of tests by Bonferroni correction (35). A sample size of 111 observations would be sufficient to estimate item difficulty, with a significance level of 0.05 to ± 0.5 logits, irrespective of the targeting of persons to the items (36). The RUMM LogbookTM, an ad hoc Excel 2007TM application developed using Microsoft Visual BasicTM macros, was used to facilitate interpreting the results of each Rasch analysis (available on request to the corresponding author).
RESULTS
Sample characteristics
This study included 111 subjects (mean ± SD age = 63.7 ± 11.9 years; 59.5% male). The enrolled patients’ main demographic and clinical characteristics are reported in Table I. Detailed sample characteristics are available elsewhere (10).
Rasch analysis summary
The base Rasch analysis showed an adequate fit to the Rasch model for the questionnaire (Table II, “Base analysis”), which satisfied the item homogeneity or invariance requirement (χ2df = 15.812; p = 0.199). Indeed, also at the item level, there was no model overfit or underfit with fit residuals within ± 2.5. Beyond this, there were no significant χ2 for all the items, which indicates the satisfaction of the stochastic invariance of the item hierarchy. Also, the scale showed a strict unidimensionality, as the PST was 3.8%, and the Lower Bound of the BCI for proportions (LBCI) was 0%. However, there were disordered thresholds for 11 items out of 12, suggesting a violation of the monotonicity requirement. In addition, 5 pairs of items had residual correlations above the LDRC (here set at 0.116, indicative of a violation of the local independence requirement).
| N | Analysis name | Fit to the Rasch model | Internal construct validity requirements | Reliability and targeting | ||||||||||||||
| FitRes Items | FitRes Persons | Item-trait interaction | Unidimensionality | Other internal construct validity requirements | Separation reliability | Targeting | ||||||||||||
| Mean | SD | Mean | SD | χ2df | p-value | PSTa | LBCIa | T-DTb | LDc | T-DIFd | PSIe | αe | PL Mean | PL SD | SEMf | Targeting indexg | ||
| 1 | Base analysis | 0.102 | 0.940 | –0.283 | 1.460 | 15.812 | 0.199 | 3.8% | 0.0% | 91.7% | 5 | 0 | 0.899 | 0.944 | –0.260 | 1.484 | 0.472 | –0.551 |
| 2 | After rescoring | 0.062 | 0.889 | –0.317 | 1.423 | 11.812 | 0.458 | 8.6% | 3.8% | 0% | 4 | 0 | 0.907 | 0.940 | –0.425 | 1.730 | 0.528 | –0.806 |
| 3 | After subtesting | 0.275 | 0.617 | –0.344 | 1.197 | 1.965 | 0.854 | 1.0% | 0.0% | 0% | 0 | 0 | 0.879 | 0.909 | –0.342 | 1.399 | 0.487 | –0.702 |
| Recommended values | [–2.5, 2.5] | < 1.4 | [–2.5, 2.5] | < 1.4 | – | < p-value corrected for Bonferroni | < 5.0a | < 5.0 | 0% | 0 | 0 | ≥ 0.85e | ≥ 0.85e | 0.000 | – | – | [–2, 2]g | |
aUnidimensionality is achieved when PST is < 5% or the lower bound of its BCI is < 5%. bThe T-DT statistic is calculated as the percentage of items with disordered thresholds out of the total items. The values range from zero to 100%, where zero indicates the absence of items with disordered thresholds. cLD value shows the number of item pairs with adjusted residual correlations above the local dependence relative cut-off, calculated as the mean of all the residual correlations (excluding the correlation of items with themselves) plus 0.2. dThe T-DIF summary statistic is calculated as the absolute value of the base 10 logarithms of all p-values for uniform and non-uniform DIF across all items and all person factors below the Bonferroni-corrected p-value. The values range from zero to infinite, where zero indicates no DIF. eA value > 0.850 indicates the measurement precision at the individual level, whereas a value > 0.700 indicates precision only at the group level. Values < 0.700 will make the instrument unsuitable for any measurement, as it cannot distinguish 2 groups of persons at the very least. fSEM is calculated with the formula:  , where SD is the person location standard deviation, and reliability is the PSI with extremes. gThe targeting index is calculated as the ratio between the mean person measures and the SEM. Targeting is good and respectively fair when the mean person measure is beyond [–1 +1] and [–2, +2] SEM the mean item measure (set by default at 0 logits). , where SD is the person location standard deviation, and reliability is the PSI with extremes. gThe targeting index is calculated as the ratio between the mean person measures and the SEM. Targeting is good and respectively fair when the mean person measure is beyond [–1 +1] and [–2, +2] SEM the mean item measure (set by default at 0 logits). |
||||||||||||||||||
| N: analysis number; FitRes: fit residual; SD: standard deviation; χ2df: χ2 and its degrees of freedom; p: Bonferroni-corrected χ2 probability value; PST: the proportion of significant t-test carried out on the estimates: that within a principal component analysis of residuals: loaded positively and negatively (factor loading >±0.3) on the first component; LBCI: lower bound confidence interval at 95% for PST; T-DT: percentage of items with disordered thresholds; LD: number of item pairs with residual correlations above the local dependence relative cut-off; T-DIF: total DIF load; PSI: person separation index; α: Cronbach’s alpha; PL mean: person location mean; PL SD: person location standard deviation; SEM: standard error of measurement of the person locations. | ||||||||||||||||||
In the next steps of analysis, several item modifications were performed to achieve a final fitting solution of the scale:
All items, except for items FJS11 and FJS08, which recovered ordered thresholds after the rescoring of the other items, were rescored as they showed disordered thresholds (Table II, “After rescoring analysis”, Table III). The responses “almost never” and “seldom” were collapsed consistently for all rescored items;
“Subtests” were created between clusters of items that demonstrated some left-over local dependence, obtaining a 5-subtest solution (FJS01-FJS02; FJS03-FJS11; FJS04-FJS05-FJS07; FJS06-FJS12; FJS08-FJS09-FJS10).
After these modifications, the final solution for the FJS showed a good fit to the Rasch model (χ2df = 1.965; p = 0.854) (Table II, After subtesting analysis”). In addition, the scale satisfied all the other internal construct validity requirements in terms of monotonicity (no disordered thresholds), local independence (no pairs of residual correlations of items above the LDRC), strictly unidimensionality (overall PST = 1.0%, LBBCI = 0%), and invariance at the subgroup level (no DIF for the person factors assessed: sex, age). The item parameters and fit statistics for this analysis are reported in Table III.
| Analysis “number 2 – After rescoring” | Item parameters and fit statistics | Scoring model | ||||||||
| Item label | Loc | SE | FR | χ2 | p* | 0 | 1 | 2 | 3 | 4 |
| FJS08 – Awareness when standing up from a low-sitting position? | –0.845 | 0.115 | 0.856 | 0.23 | 0.631 | 0 | 1 | 2 | 3 | 4 |
| FJS11 – Awareness taking a walk/hiking? | –0.506 | 0.110 | –0.58 | 0.33 | 0.566 | 0 | 1 | 2 | 3 | 4 |
| FJS07 – Awareness walking on uneven ground? | –0.177 | 0.140 | –0.924 | 0.97 | 0.324 | 0 | 1 | 1 | 2 | 3 |
| FJS09 – Awareness standing for long periods of time? | –0.168 | 0.132 | –0.198 | 0.02 | 0.903 | 0 | 1 | 1 | 2 | 3 |
| FJS03 – Awareness when you are walking for more than 15 min? | –0.075 | 0.135 | 0.930 | 0.22 | 0.636 | 0 | 1 | 1 | 2 | 3 |
| FJS06 – Awareness climbing stairs? | –0.049 | 0.136 | 0.724 | 1.93 | 0.164 | 0 | 1 | 1 | 2 | 3 |
| FJS02 – Awareness sitting on a chair for more than 1 h? | 0.016 | 0.134 | 0.818 | 0.41 | 0.524 | 0 | 1 | 1 | 2 | 3 |
| FJS10 – Awareness doing housework or gardening? | 0.083 | 0.136 | –0.285 | 0.41 | 0.521 | 0 | 1 | 1 | 2 | 3 |
| FJS12 – Awareness doing your favourite sport? | 0.126 | 0.144 | –0.014 | 0.18 | 0.676 | 0 | 1 | 1 | 2 | 3 |
| FJS05 – Awareness traveling in a car? | 0.312 | 0.137 | –1.188 | 3.78 | 0.052 | 0 | 1 | 1 | 2 | 3 |
| FJS01 – Awareness in bed at night? | 0.593 | 0.137 | 1.533 | 2.35 | 0.125 | 0 | 1 | 1 | 2 | 3 |
| FJS04 – Awareness taking a bath/shower? | 0.691 | 0.138 | –0.934 | 1.02 | 0.312 | 0 | 1 | 1 | 2 | 3 |
| Analysis “number 3 – After subtesting” | Item parameters and fit statistics | Scoring model | ||||||||
| Subtest label | Loc | SE | FR | χ2 | p** | |||||
| FSJ03 – FSJ11 | –0.314 | 0.074 | 0.422 | 0.14 | 0.712 | 0–7 | ||||
| FSJ08 – FSJ09 – FSJ10 | –0.296 | 0.063 | 0.339 | 0.24 | 0.623 | 0–10 | ||||
| FSJ06 – FSJ12 | 0.119 | 0.088 | 0.526 | 0.03 | 0.874 | 0–6 | ||||
| FSJ04 – FSJ05 – FSJ07 | 0.162 | 0.067 | –0.769 | 1.43 | 0.232 | 0–9 | ||||
| FSJ01– FSJ02 | 0.329 | 0.085 | 0.859 | 0.13 | 0.714 | 0–6 | ||||
| FJS items and subtests are ordered by progressively increasing the difficulty from top to bottom. The location is expressed in logits. | ||||||||||
| For analysis “number 2 – After rescoring”, the degree of freedom for each χ2 was 1 for all items. *The Bonferroni-corrected p-value indicating statistical significance at the 0.05 level was 0.004. | ||||||||||
| For analysis “number 3 – After subtesting”, the degrees of freedom for each χ2 were 1 for all subtests. **The Bonferroni-corrected p-value indicating statistical significance at the 0.05 level was 0.008. | ||||||||||
| FJS: Forgotten Joint Score; Loc: Location; SE: standard error; FR: fit residual; χ2: chi-square; p: χ2 probability. | ||||||||||
All the subjects’ responses fitted the model except for 4 under-fitting subjects, showing fit residuals > 2.5. The targeting FJS graph (Fig. 1) of the final analysis (Table II, “After subtesting analysis”) highlighted that persons were spread across 7 logits, with a negligible floor (5.4%) and no ceiling effects (0%).
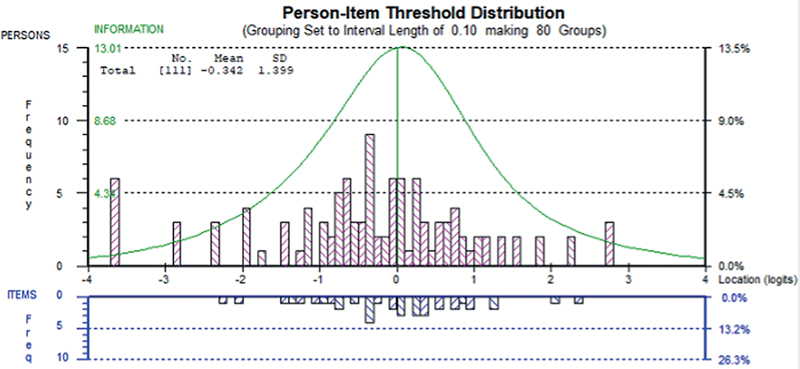
Fig. 1. Targeting of the Forgotten Joint Score (FJS) (N = 111, analysis “number 3 –After subtesting”). In the figure, persons and items are displayed, respectively, in the upper and the lower part of the graph, separated by the logit scale. Grouping set to interval length of 0.10, making 80 groups. Freq: frequency; No: number; SD: standard deviation.
The mean person ability of –0.342 logits and a targeting index of –0.702 indicated a proper matching between person ability and item difficulty, set by default at 0 logits.
The separation reliability, expressed as PSI and Cronbach’s alpha, was 0.879 and 0.909, respectively, indicating the precision of measurement at the individual level. Therefore, given the PSI, persons could be separated into 3.9 strata, the statistically distinct levels of awareness of the operated hip reliably distinguished by the scale.
The item hierarchy (Table III, “After rescoring analysis”) suggested that the activities in which the awareness of the operated hip is higher for most people are linked to postural changes and walking (FJS08: standing up from a low-sitting position, FJS11: taking a walk/hiking, FJS07: walking on uneven ground). Conversely, the activities in which the awareness of the operated hip is lower concern maintaining a static, fixed position (FJS05: travelling in a car, FJS01: in bed at night, FJS04: taking a bath/shower).
Based on the item calibration, it was possible to construct a table to convert the scale raw scores into interval-level estimates of the awareness of the prosthetic hip (Table IV).
| Rai score | Logit scale | ± 95% CI | 0–60 original scaling | ± 95% CI |
| 0 | –3.679 | 2.319 | 0.0 | 9.4 |
| 1 | –2.875 | 1.648 | 6.6 | 6.7 |
| 2 | –2.336 | 1.286 | 10.9 | 5.2 |
| 3 | –1.975 | 1.090 | 13.9 | 4.4 |
| 4 | –1.702 | 0.966 | 16.1 | 3.9 |
| 5 | –1.481 | 0.878 | 17.9 | 3.6 |
| 6 | –1.297 | 0.811 | 19.4 | 3.3 |
| 7 | –1.138 | 0.759 | 20.7 | 3.1 |
| 8 | –0.998 | 0.717 | 21.8 | 2.9 |
| 9 | –0.872 | 0.682 | 22.9 | 2.8 |
| 10 | –0.759 | 0.653 | 23.8 | 2.7 |
| 11 | –0.655 | 0.627 | 24.6 | 2.6 |
| 12 | –0.558 | 0.608 | 25.4 | 2.5 |
| 13 | –0.468 | 0.590 | 26.2 | 2.4 |
| 14 | –0.382 | 0.576 | 26.9 | 2.3 |
| 15 | –0.301 | 0.564 | 27.5 | 2.3 |
| 16 | –0.223 | 0.557 | 28.2 | 2.3 |
| 17 | –0.147 | 0.551 | 28.8 | 2.2 |
| 18 | –0.072 | 0.545 | 29.4 | 2.2 |
| 19 | 0.001 | 0.543 | 30.0 | 2.2 |
| 20 | 0.074 | 0.543 | 30.6 | 2.2 |
| 21 | 0.147 | 0.545 | 31.2 | 2.2 |
| 22 | 0.221 | 0.547 | 31.8 | 2.2 |
| 23 | 0.296 | 0.553 | 32.4 | 2.3 |
| 24 | 0.373 | 0.561 | 33.0 | 2.3 |
| 25 | 0.453 | 0.572 | 33.7 | 2.3 |
| 26 | 0.536 | 0.586 | 34.3 | 2.4 |
| 27 | 0.623 | 0.602 | 35.1 | 2.5 |
| 28 | 0.717 | 0.623 | 35.8 | 2.5 |
| 29 | 0.818 | 0.649 | 36.6 | 2.6 |
| 30 | 0.928 | 0.680 | 37.5 | 2.8 |
| 31 | 1.052 | 0.721 | 38.6 | 2.9 |
| 32 | 1.195 | 0.772 | 39.7 | 3.1 |
| 33 | 1.363 | 0.847 | 41.1 | 3.4 |
| 34 | 1.571 | 0.943 | 42.8 | 3.8 |
| 35 | 1.842 | 1.082 | 45.0 | 4.4 |
| 36 | 2.216 | 1.298 | 48.0 | 5.3 |
| 37 | 2.793 | 1.691 | 52.7 | 6.9 |
| 38 | 3.684 | 2.413 | 60.0 | 9.8 |
| Person estimates are expressed in logits and into a 0–60 scale (FJS original scaling). | ||||
| This conversion table can only be used if patients are assessed on all items of the FJS (i.e. without missing responses). The modified raw scores are to be used for the FJS items, as detailed in Table III. | ||||
DISCUSSION
This paper analysed the internal construct validity, reliability, and targeting of the FJS within the Rasch measurement theory framework in patients with THA. After assessing the same properties within the CTT framework in a previous study (10), we concluded the need for a more in-depth assessment of its internal construct validity based on an root mean square error of approximation (RMSEA) value slightly above the recommended threshold shown by CFA results. In this work, after structural and non-structural strategies to cope respectively with the violation of the monotonicity and local independence requirements, the FJS confirmed the satisfaction of all the internal construct validity requirements of the Rasch model (i.e., unidimensionality, invariance, local independence, monotonicity, multi-group invariance), with reliability indexes adapted for individual-level measurement and proper targeting. A raw-score-to-measure conversion table was provided, which can be used in clinical and research settings for patients with THA. Although the number of available observations was sufficient for a calibration sample, further studies would be needed to confirm these results.
In comparing the two described analysis frameworks of the internal construct validity (CTT vs Rasch measurement theory), both expressed a good fit of all items to the different requested requirements. Furthermore, it is possible to find a difference in the violation of local dependence highlighted by the CFA and the Rasch analysis. Indeed, CFA showed a significant modification index between only 2 items (10). Differently, in the Rasch analysis context with more in-depth analysis based on measures of person estimates (vs ordinal scores in CFA), 5 pairs of items signalled a significant residual, which highlighted that responses to these items were governed by the response to other items and not only by the degree of the latent trait (i.e. “response dependence”) (37). The presence of response dependence was also sustained by the reduction of the reliability estimate (PSI delta = 0.03), compared to the anaysis n°3 “After subtesting”, in which we accounted for local dependence, and the previous one (37). Given the common presence of local dependence in Rasch analyses on health outcome scale data, its detailed assessment is fundamental considering its impact on the scale’s internal construct validity (38). Our analysis strategy was to manage local dependency based on clinical and statistical considerations. Although the clinical conceptual perspective of the highlighted dependence was unclear in some cases, we attempted to provide a clinical rationale for the item content that made up the subtests. For example, FJS01 and FJS02 concern static positions, FJS08, FJS09, and FJS10 quantify activities performed in a standing position, and FJS03 and FJS11 refer to gait. Finally, in the subtest composed of FJS04, FJS05, and FJS07, the first two items refer to activities that involve maintaining a position for a prolonged period. At the same time, the FSJ07 refers to walking on uneven ground. All three activities may be related to postural control and balance requests in different positions to maintain stability and prevent falls, especially when taking a bath/shower or walking on uneven ground. However, this conceptual rationale only partially explains these correlations, and we cannot exclude that this result was due to the relatively small sample size.
To our knowledge, this is the first study reporting on the Rasch analysis of the Italian version of the FJS in patients with THA. Previously, Giesinger et al. in 2013 (39) developed a computer-adaptive version of the FJS in patients with THA and TKA after running a Rasch analysis, and recently, in 2019, Niama Natta et al. (16) performed a Rasch analysis of the FJS in patients undergoing knee arthroplasty.
Considering the Rasch analyses, it can be initially shown that a different parameterization of the Rasch model was used between the three studies. In our work, as previously indicated, the partial credit model was used, which does not impose any restrictions on the item threshold parameters (17). In Giesinger (39) and Niama Natta’s (16) studies, the rating scale model was used, which provides that thresholds do not have to be equally spaced within an item, but the threshold constraints are equal across all items (17), having obtained a non-significant likelihood-ratio test.
Comparing the base analyses, the questionnaire showed an overall satisfactory fit to the model (current study: χ2 = 15.812, p-value = 0.12; Giesinger’s study (39): RMSEA = 0.11; Niama Natta’s study (16): χ2 = 34.112, p-value = 0.08), and almost all items showed disordered thresholds for two of the samples (current: 11/12; Niama Natta: 9/12), while Giensinger et al. (39) found no disordered thresholds using the rating scale model.
Regarding local dependence, the other two articles (16, 39) found fewer items with significant residual correlations. In this regard, it is essential to note that, in Giesinger (39) and Niama Natta’s (16) studies, respectively, a fixed cut-off of 0.25 and 0.30 were considered, unlike the current study, in which the cut-off was calculated about each analysis and so lower than the fixed. This difference may have led to a possible underdetection of local dependence in these samples. In addition, no analogies were highlighted between the pairs of items involved in significant residual correlations of the considered studies.
After the common item rescoring of the disordered score categories in the current analysis and in Niama Natta’s one, where the “almost never” category was consistently combined with the “seldom” one in a single category, going from 5 scoring categories to 4 scoring categories, a notable difference between the three Rasch analyses was the analytical strategy. Given the presence of local dependence between pairs of items, the analytical approach of Niama Natta et al. (16) was “structural”. Indeed, 3 FJS items (FJS03, FJS05 and FJS11) were deleted as they had residual correlations with other items above the cut-off of 0.3 and worse psychometric characteristics. In contrast, this violation has been managed through a conservative “statistical” technique called “item subtesting” in the current study. Finally, in Giesinger’s work (39), no strategy was reported to handle local dependence.
Considering the final solutions obtained, we noticed how using a more conservative analytical strategy allowed us to keep the 12 original items, unlike Niama Natta’s final version composed of 9 items (16). Both scales showed an excellent fit to the Rasch model, a satisfactory unidimensionality, and an optimal targeting of the item’s difficulty compared with the subject’s ability. The measurement range of FJS for TKA (Niama Natta) was wider than approximately 1 logit. Still, the scale showed a slightly lower separation reliability level (PSI = 0.84 vs 0.88) due to the lower scoring thresholds (27 vs 38) caused by deleting the above 3 items. On the contrary, Giesinger’s paper did not realize any modifications to the scale, keeping the initial solution and obtaining the already cited satisfactory fit to the model and a Cronbach’s alpha value (= 0.97) higher than the current sample (= 0.91). This discrepancy could be due to the reduced number of items (5 subtests) of our final version on which we calculated this statistic and the unsolved local dependence in Giesinger’s sample. It is well known that Cronbach’s alpha is sensitive to the item number, i.e. the higher the item number, the higher the alpha value, and it is also inflated by positive local dependence (37). Furthermore, the discrepancy in internal consistency findings between the two studies may be due to our FJS versions’ lower total score than Giesinger’s version, as we rescored several items that presented disordered thresholds while they did not. No further information was available in Giensinger’s study about targeting. Finally, no items of the three samples were affected by DIF by sex and age, as already proved by Behrend et al. (8) in the original version.
Furthermore, given the item hierarchy shown in the three studies’ results, it is interesting to note that among the activities in which the awareness of the operated hip was higher for most people, there is the postural change from a low-sitting position to the standing position, both in patients with the knee (Niama Natta) (16) and hip prostheses (current study), and the standing for longer period and the walking on uneven ground are present in the two THA samples (39). On the other hand, among the activities in which the awareness of a knee or hip prosthesis is lower, being in bed at night and taking a bath/shower are reported by all three studies. From a biomechanical and neurophysiological point of view, the observed similarity in results could be attributed to the fact that individuals with THA and TKA may have kinesthetic and proprioceptive impairments on the ipsilateral lower limb (40), which can cause persistent static stability dysfunction, muscle weakness, and range of motion restrictions (41, 42). Thus, the awareness of having a joint prosthesis will probably increase during movement and functional activities, especially in demanding tasks and weight-bearing, which may provide sensory feedback and proprioceptive input, increasing the perception of prosthesis awareness. On the other hand, prosthesis awareness may decrease when a patient is required to maintain a specific position for a long time.
Finally, our and Niama Natta’s (16) studies developed raw-score-to-measure conversion tables usable in clinical and research contexts for patients with THA and those with TKA. As in previous works, the current results highlight the importance of using interval-level measures, which support the appropriate use of parametric statistics in clinical trials and the correct interpretation of the variable changes intra- and inter-subject, unlike the raw scores (18, 19). However, the conversion table can be used only if no missing items are present and the raw scores of the rescored items are modified, as detailed in Table III (section “Scoring model”).
This study has some limitations. Although the number of available observations was sufficient for a calibration sample, a larger sample would have further minimized the risk of capitalizing on chance concerning the fit to the model. Given this limitation, it would be desirable to conduct further studies with internal construct validity assessment of the FJS in the Rasch measurement theory framework on other samples, also composed of subjects with different aetiologies in which an internal construct validity assessment has already been performed within the CTT psychometric framework (e.g. anterior cruciate ligament reconstruction, patellar dislocation, quadriceps tendon rupture reconstruction). Moreover, the rescoring changes were made post-hoc, so these might not be the same if new response categories were presented to subjects completing the scale.
In conclusion, after structural and non-structural strategies, this study supports the internal construct validity, reliability, and targeting of the FJS within the Rasch measurement theory framework in a sample of patients with THA.
ACKNOWLEDGEMENTS
Publication of this article was supported by the “Ricerca Corrente” funding from the Italian Ministry of Health.
The study protocol was approved by the IRCCS San Raffaele, Italy (number: RP 20/17).
The raw data supporting the conclusions of this article are available for download at Zenodo.org (according to the license Creative Commons Attribution 4.0 International) from the following link: https://doi.org/10.5281/zenodo.10067398.
REFERENCES
- Charnley J. Arthroplasty of the hip. a new operation. Lancet 1961; 1: 1129–1132. DOI: 10.1016/s0140-6736(61)92063-3
- Hussein IH, Zalikha AK, Tuluca A, Crespi Z, El-Othmani MM. Epidemiology of obese patients undergoing revision total knee arthroplasty: understanding demographics, comorbidities, and propensity weighted analysis of inpatient outcomes. J Am Acad Orthop Surg Glob Res Rev 2022; 6: e21.00263. DOI: 10.5435/JAAOSGlobal-D-21-00263
- Ethgen O, Bruyere O, Richy F, Dardennes C, Reginster JY. Health-related quality of life in total hip and total knee arthroplasty. A qualitative and systematic review of the literature. J Bone Joint Surg Am 2004; 86: 963–974. DOI: 10.2106/00004623-200405000-00012
- Torre M, Ceccarelli S, Biondi A, Carrani E, Cornacchia A, Mari V, et al. Registro Italiano ArtroProtesi. Report Annuale 2021. Roma; 2022.
- Pennington MW, Grieve R, van der Meulen JH. Lifetime cost effectiveness of different brands of prosthesis used for total hip arthroplasty: a study using the NJR dataset. Bone Joint J 2015; 97-B: 762–770. DOI: 10.1302/0301-620X.97B6.34806
- Basch E, Barbera L, Kerrigan CL, Velikova G. Implementation of patient-reported outcomes in routine medical care. Am Soc Clin Oncol Educ Book 2018; 38: 122–134. DOI: 10.1200/EDBK_200383
- Staniszewska S, Haywood KL, Brett J, Tutton L. Patient and public involvement in patient-reported outcome measures: evolution not revolution. Patient 2012; 5: 79–87. DOI: 10.2165/11597150-000000000-00000
- Behrend H, Giesinger K, Giesinger JM, Kuster MS. The “forgotten joint” as the ultimate goal in joint arthroplasty: validation of a new patient-reported outcome measure. J Arthroplasty 2012; 27: 430–436.e431. DOI: 10.1016/j.arth.2011.06.035
- Longo UG, De Salvatore S, Piergentili I, Indiveri A, Di Naro C, Santamaria G, et al. Total hip arthroplasty: minimal clinically important difference and patient acceptable symptom state for the forgotten joint score 12. Int J Environ Res Public Health 2021; 18: 2267. DOI: 10.3390/ijerph18052267
- Angilecchia D, Stano F, Signorelli M, Giovannico G, Pournajaf S, Pellicciari L. Psychometric properties of the Italian version of the Forgotten Joint Score in patients with total hip arthroplasty. Int J Rehabil Res 2022; 45: 343–349. DOI: 10.1097/MRR.0000000000000549
- Hu L-t, Bentler PM. Cutoff criteria for fit indexes in covariance structure analysis: conventional criteria versus new alternatives. Struct Equat Model 2009; Volume 6.
- Andrich D. Rasch models for measurement. London: Sage Publications; 1988.
- La Porta F, Franceschini M, Caselli S, Cavallini P, Susassi S, Tennant A. Unified Balance Scale: an activity-based, bed to community, and aetiology-independent measure of balance calibrated with rasch analysis. J Rehabil Med 2011; 43: 435–444. DOI: 10.2340/16501977-0797
- Tennant A, Conaghan PG. The Rasch measurement model in rheumatology: what is it and why use it? When should it be applied, and what should one look for in a Rasch paper? Arthritis Rheum 2007; 57: 1358–1362. DOI: 10.1002/art.23108
- Hobart J, Cano S. Improving the evaluation of therapeutic interventions in multiple sclerosis: the role of new psychometric methods. Health Technol Assess 2009; 13: iii, ix–x, 1–177.
- Niama Natta DD, Thienpont E, Bredin A, Salaun G, Detrembleur C. Rasch analysis of the Forgotten Joint Score in patients undergoing knee arthroplasty. Knee Surg Sports Traumatol Arthrosc 2019; 27: 1984–1991. DOI: 10.1007/s00167-018-5109-x
- Wright BD. Model selection: Rating Scale Model (RSM) or Partial Credit Model (PCM)? Rasch Measure Trans 1998; 12: 641–642
- Pellicciari L, Piscitelli D, Basagni B, De Tanti A, Algeri L, Caselli S, et al. ‘Less is more’: validation with Rasch analysis of five short-forms for the Brain Injury Rehabilitation Trust Personality Questionnaires (BIRT-PQs). Brain Inj 2020; 34: 1741–1755. DOI: 10.1080/02699052.2020.1836402
- Caselli S, Kreiner S, Ianes AB, Piperno R, F LAP. The Early Functional Abilities-revised may bridge the gap between the disorder of consciousness and the functional independence scales: evidence from Rasch analysis. Eur J Phys Rehabil Med 2022; 58: 805–817. DOI: 10.23736/S1973-9087.22.07522-0
- Pellicciari L, Piscitelli D, Caselli S, La Porta F. A Rasch analysis of the Conley Scale in patients admitted to a general hospital. Disabil Rehabil 2019; 41: 2807–2816. DOI: 10.1080/09638288.2018.1478000
- La Porta F, Caselli S, Susassi S, Cavallini P, Tennant A, Franceschini M. Is the Berg Balance Scale an internally valid and reliable measure of balance across different etiologies in neurorehabilitation? a revisited Rasch analysis study. Arch Phys Med Rehabil 2012; 93: 1209–1216. DOI: 10.1016/j.apmr.2012.02.020
- Smith E. Detecting and evaluating the impact of multidimensionality using item fit statistics and principal com-ponent analysis of residuals. J Appl Meas 2002; 3: 205–231
- La Porta F, Giordano A, Caselli S, Foti C, Franchignoni F. Is the Berg Balance Scale an effective tool for the measurement of early postural control impairments in patients with Parkinson’s disease? Evidence from Rasch analysis. Eur J Phys Rehabil Med 2015; 51: 705–716.
- Kreiner S. The Rasch model for dichotomous items. In: Christensen KB, Kreiner S, Mesbah M, editors. in Rasch Models in Health. London UK, Hoboken NJ: ISTE Ltd and John Wiley & Sons, Inc; 2013
- Christensen KB, Makransky G, Horton M. Critical Values for Yen’s Q3: Identification of Local Dependence in the Rasch Model Using Residual Correlations. Appl Psychol Meas 2017; 41: 178–194. DOI: 10.1177/0146621616677520
- Fisher WPj. Rating scale instrument quality criteria. Rasch Measurement Transactions 2007; 21:1: 1095.
- Kreiner S, Christensen KB. Person parameter estimation and measurement in Rasch Models. In: Christensen KB, Kreiner S, Mesbah M, editors. In: Rasch Models in Health. London UK, Hoboken NJ: ISTE Ltd and John Wiley & Sons, Inc; 2013.
- Wright BD. Separation, reliability and skewed distributions: statistically different levels of performance. Rasch Measure Trans 2001; 14.
- Reeve BB, Hays RD, Bjorner JB, Cook KF, Crane PK, Teresi JA, et al. Psychometric evaluation and calibration of health-related quality of life item banks: plans for the Patient-Reported Outcomes Measurement Information System (PROMIS). Med Care 2007; 45: S22–31. DOI: 10.1097/01.mlr.0000250483.85507.04
- Revicki DA, Chen W, Tucker CA. Developing item banks for patient-reported health outcomes. In: Reise PS, Revicki DA, editors. Handbook of Item Response Theory Modeling: applications to typical performance assessments. New York; 2014.
- Lundgren Nilsson A, Tennant A. Past and present issues in Rasch analysis: the functional independence measure (FIM) revisited. J Rehabil Med 2011; 43: 884–891. DOI: 10.2340/16501977-0871
- Maritz R, Tennant A, Fellinghauer C, Stucki G, Prodinger B. The Functional Independence Measure 18-item version can be reported as a unidimensional interval-scaled metric: Internal construct validity revisited. J Rehabil Med 2019; 51: 193–200. DOI: 10.2340/16501977-2525
- Franchignoni F, Horak F, Godi M, Nardone A, Giordano A. Using psychometric techniques to improve the Balance Evaluation Systems Test: the mini-BESTest. J Rehabil Med 2010; 42: 323–331. DOI: 10.2340/16501977-0537
- Linacre JM. Optimizing rating scale category effectiveness. J Appl Meas 2002; 3: 85–106.
- Bland J, Altman D. Multiple significance tests: the Bonferroni method. Br Med J 1995; 310: 170. DOI: 10.1136/bmj.310.6973.170
- Linacre JM. Sample size and item calibration stability. Rasch Meas Trans 1994;7:328.; 7: 328.
- Marais I. Local dependence. In: Christensen KB, Kreiner S, Mesbah M, editors. in Rasch models in health. London UK, Hoboken NJ: ISTE Ltd and John Wiley & Sons, Inc; 2013.
- Caselli S, Sabattini L, Cattaneo D, Jonsdottir J, Brichetto G, Pozzi S, et al. When ‘good’ is not good enough: a retrospective Rasch analysis study of the Berg Balance Scale for persons with multiple sclerosis. Front Neurol 2023; 14: 1171163. DOI: 10.3389/fneur.2023.1171163
- Giesinger JM, Kuster MS, Holzner B, Giesinger K. Development of a computer-adaptive version of the forgotten joint score. J Arthroplasty 2013; 28: 418–422. DOI: 10.1016/j.arth.2012.08.026
- Aman JE, Elangovan N, Yeh IL, Konczak J. The effectiveness of proprioceptive training for improving motor function: a systematic review. Front Hum Neurosci 2014; 8: 1075. DOI: 10.3389/fnhum.2014.01075
- Di Laura Frattura G, Bordoni V, Feltri P, Fusco A, Candrian C, Filardo G. Balance remains impaired after hip arthroplasty: a systematic review and best evidence synthesis. Diagnostics (Basel) 2022; 12: 684. DOI: 10.3390/diagnostics12030684
- Moutzouri M, Gleeson N, Billis E, Tsepis E, Panoutsopoulou I, Gliatis J. The effect of total knee arthroplasty on patients’ balance and incidence of falls: a systematic review. Knee Surg Sports Traumatol Arthrosc 2017; 25: 3439–3451. DOI: 10.1007/s00167-016-4355-z