REVIEW ARTICLE
ASSOCIATION BETWEEN FEAR OF FALLING AND FALLS FOLLOWING ACUTE AND CHRONIC STROKE: A SYSTEMATIC REVIEW WITH META-ANALYSIS
Tamis W. PIN, PHD, Stanley J. WINSER, PHD, Wayne L. S. CHAN, PHD, Bolton CHAU, PHD, Shamay NG, PHD, Thomson WONG, PHD, Margaret MAK, PHD AND Marco PANG, PHD
From the Department of Rehabilitation Sciences, The Hong Kong Polytechnic University, Kowloon, Hong Kong
Objectives: To examine the association between falls and fear of falling in people with stroke and to evaluate the differences between patients with acute stroke and those with chronic stroke with regard to any such association.
Methods: Articles were searched in Medline, CINAHL, AMED, Embase, PsycINFO, Cochrane Library of Reviews and PEDro from inception until March 2023. Experimental, observational or explorative studies investigating the association between fear of falling and falls in people with stroke were included. Articles were screened by 2 independent reviewers. Data were extracted by an independent reviewer.
Results: A total of 26 reports were included in this review (n = 2863). Fear of falling, assessed by a single-question survey, was significantly associated with falls (relative risk = 1.44; 95% confidence interval (95% CI) = 1.22, 1.70; I2 = 0%) in people with acute stroke. Significant mean differences in fear of falling, based on the Falls Efficacy Scale (mean difference = 12.80; 95% CI = 1.81, 23.78; I² = 28%) and Activities-specific Balance Confidence Scale (mean difference = –9.99; 95% CI = –15.36, –4.62; I² = 57%), were also reported between fallers and non-fallers in people with chronic stroke.
Conclusion: A small, but significant, association exists between falls and fear of falling in both acute and chronic stroke patients.
LAY ABSTRACT
Falls are common in people with stroke and often lead to serious injuries, such as fractures and hospital admission. Fear of falling has been identified as a risk factor for falls in older adults. However, the association between fear of falling and falls has not been thoroughly investigated. This systematic review included 26 studies with 2863 people with stroke. Our analysis showed that there is a small and significant association between fear of falling and falls in stroke patients. A single-question survey on fear of falling can be used to predict falls in people with acute stroke. The Falls Efficacy Scale and Activities-specific Balance Confidence Scale can be used to identify fallers in people with chronic stroke. Fear of falling should be addressed in falls prevention and management in people with stroke.
Key words: stroke; accidental falls; self-efficacy; meta-analysis; systematic review.
Citation: J Rehabil Med 2024; 56: jrm18650. DOI: https://doi.org/10.2340/jrm.v56.18650.
Copyright: © Published by Medical Journals Sweden, on behalf of the Foundation for Rehabilitation Information. This is an Open Access article distributed under the terms of the Creative Commons Attribution-NonCommercial 4.0 International License (https://creativecommons.org/licenses/by-nc/4.0/)
Submitted Sep 6, 2023; Accepted: Nov 14, 2023; Published: Jan 16, 2024
Correspondence address: Wayne Chan, Department of Rehabilitation Sciences, The Hong Kong Polytechnic University, 11 Yuk Choi Road, Hung Hom, Hong Kong. Email: wayne.ls.chan@polyu.edu.hk
Competing interests and funding: The authors have no conflicts of interest to declare.
Stroke is one of the most common neurological conditions, with a prevalence of 101 million worldwide reported in 2019 (1). Stroke was the second leading cause of mortality globally and the third leading cause of combined death and disability in 2019 (1). In Hong Kong, the incidence of stroke was 314.4 per 100,000 in 2007 (2).
Falls are a frequent complication for people with stroke (3). In a prospective study of approximately 500 patients, 22% of the patients with stroke experienced falls (4). In the acute stage, the falls incidence for people with stroke has been reported to be 2.2–4.9 falls per person-year and 1.3–6.5 falls per person-year during the inpatient rehabilitation period, while the rate of falls among healthy older adults is 0.65 falls per person-year (3). This rate is 1.4–5.0 falls per person-year for community-dwelling stroke survivors (3). A fall may lead to fall-related injuries, such as bruises and fractures, which, in turn, lead to increased dependency of the individuals with stroke in the long term (5). This places a large burden on the individuals, their carers, and the healthcare system (1, 3, 6).
Exploring factors related to falls risk, in order to predict future falls for people with stroke, is necessary so that specific interventions can be put in place for falls prevention (3, 7, 8). Reduced balance, gait abnormalities, motor impairment and history of previous falls have been identified as significant predictors for future falls for people with stroke (3, 5–7, 9, 19). Non-motor factors, such as depression and cognitive impairment, are also associated with future falls for this population group (3, 7).
Fear of falling (FoF) is an interesting potential falls risk factor, in that it might be a cause and an outcome of falls in people with stroke (3, 5, 11). Close to 90% of people with stroke developed a FoF after a fall (12). This FoF will lead to restriction of physical activities, in the hope of reducing the chance of falls (6). This will then cause reduction in physical activity and, hence, physical deconditioning, in people with stroke (3). These factors are themselves risk factors for falls (7, 8). Fig. 1 summarizes the interaction between falls and FoF (3).
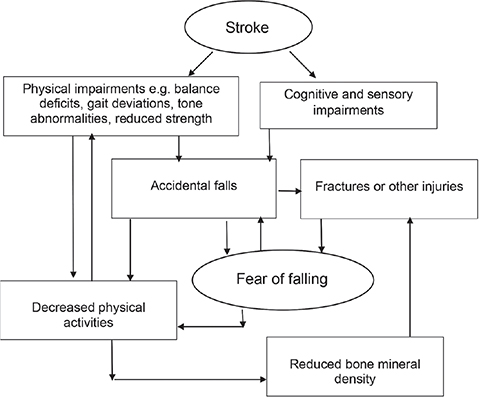
Fig. 1. Interaction of falls and fear of falling in people with stroke.
Although FoF has been identified as a risk factor for falls among community-dwelling older adults (11), its association in people with stroke has not been thoroughly investigated using a systematic approach. In a recent systematic review, using FoF as an independent variable, past falls history has been identified as one of the significant predictors for FoF in people with stroke, but the main shortfall of this review is that it does not consider the overall grade of evidence of the included studies (13). Hence, the current review took a more rigorous approach, using falls as an independent variable to explore the following research questions:
- Is there is an association between falls and FoF in people with stroke?
- If this association exists, is there any difference between people with stroke at the acute and chronic stages?
METHODS
Identification and selection of studies
Systematic searches were conducted in Medline, CINAHL, AMED, Embase, PsycINFO, Cochrane Library of Reviews and PEDro from database inception until early March 2023 by the first author (TWP). These databases were chosen due to their relevance to stroke management. The search terms were constructed under the themes of “stroke”’ and “FoF”, used as a keyword search if supported in the database, and/or as a wildcard search, and then were finally combined. Cerebral infarction, intracranial embolism and thrombosis, intracranial arteriovenous malformations and cerebrovascular disorders were used under the theme of stroke. Balance confidence, FoF and fall-related self-efficacy were used under the theme of FoF (Table SI shows the search strategy for the Medline database). The reference lists of key papers and relevant systematic reviews were also searched for citation tracking and by hand.
In this systematic review, a fall was defined as an event when there is a displacement of the body to a level of knee height or lower through an uncontrolled, involuntary action (14). FoF is commonly assessed by either directly asking the participants if they were afraid of falling or the confidence level of a person in performing common daily activities without falling as an operationalization of the FoF (15). The latter is frequently tested using Falls Efficacy Scale (FES) (16) or Activities-specific Balance Confidence Scale (ABC) (17). Furthermore, the acute stage of stroke was defined as less than 3 months post-stroke and the chronic stage as 6 months post-stroke. The timelines for these stages are commonly accepted in clinical settings (18).
The inclusion criteria for the current review were: (i) experimental, observational or explorative studies; (ii) the study participants had a confirmed diagnosis of stroke; (iii) current or historical FoF of the study participants were explicitly assessed by a self- or clinician-rated symptom-rating scale or other quantitative measure; (iv) the participants were older than 18 years of age; (v) the participants were divided into 2 groups: those who had fallen at least once and those who had not fallen; and (vi) the studies were published in English language peer-reviewed journals. The exclusion criteria were: (i) protocols, conference proceedings and expert opinions (if a protocol was found, citation tracking would be performed if the study was completed and published); (ii) studies of mixed groups of people with neurological conditions, but relevant data, would be included if the results for participants with stroke could be separated; and (iii) full text was not retrievable.
After removing duplicates, the titles and abstracts were screened by 2 independent reviewers (first author, TWP and a research colleague, WS) and followed by full-text reading for any queries. Discrepancies between the 2 reviewers were discussed. Unresolved discrepancies were discussed with a third reviewer (MM).
Data extraction
The following data were extracted from all included studies: authors, year of publication, study design, study sample size, and participants’ characteristics including age, mean duration post-stroke, percentage of males, number of participants classified as fallers or non-fallers, and outcome measure(s) used for measuring falls and FoF. Data extraction was carried out by the first author (TWP).
The outcome of interest (independent variable) was falls in people with stroke in association with FoF (dependent variable) expressed as an odds ratio (OR) or relative risk ratio (RR). If sufficient data were available and had not been already reported in the original study, descriptive and test statistics showing the association between falls and FoF were converted to an OR or RR with 95% CI.
Data synthesis
A meta-analysis was performed using Review Manager 5.4.1 (19) if sufficient data were available from the included studies according to various outcome measures of the FoF. From each study included in the meta-analysis, quantitative data regarding the associations between the FoF and the outcome of falls or no falls were extracted and/or calculated based on the raw data available in the publications. No attempt was made to contact the authors for any clarification of the results of the included studies. A more robust random-effects model was used to estimate the overall effect size, as heterogeneity was expected among the included studies with the significance level set at p < 0.05. The Q statistic or χ2 and the I2 statistic were used to examine the heterogeneity of the effect sizes. Sensitivity analyses of the pooled results were performed based on participant subgroups, i.e. acute and chronic stroke (20), methodological quality, i.e. random vs fixed effect models, and quality of individual studies (21).
Assessment of characteristics of studies
The Scottish Intercollegiate Guidelines Network (SIGN) methodology checklists for cohort studies and case-control studies (22) were used to assess the quality of the included studies independently by the 2 reviewers (TWP and WS) (Table SII). Fourteen questions are used to assess the risk of bias and confounding, with the final grade of the study rated either “high quality” or “acceptable” or “unacceptable” (22). The reviewers were not blinded to the authors of the included studies, and all the included studies were graded. Any disagreement regarding the SIGN grades was resolved with consensus and opinions to be sought from the third reviewer (MM) if unresolved. It was arbitrarily determined that studies that yielded less than 7 positive answers ( < 50%) to the 14 questions would have “unacceptable” study quality, ≥ 7 to 10 positive answers (50% to 70%) as “acceptable” quality and ≥ 10 (≥ 70%) as “high quality”.
The Grading of Recommendations, Assessment, Development, and Evaluation (GRADE) system was used to rate the quality of overall evidence (23). The quality of the body of evidence based on the included studies was classified as high, moderate, low or very low quality (23). The rating of the level of evidence begins as high quality for randomized controlled trials (RCTs) and low quality for observational studies. The quality of the evidence is rated down according to the recommended 5 criteria (23) (Table SIII). The level of evidence could be rated up based on 3 criteria: large study effect, dose-response gradient and plausible confounding factors (24–29).
RESULTS
Flow of studies through the review
The search yielded 2,835 studies, of which 46 were relevant (Fig. 2). One publication (30) was added from the reference list of a related systematic review (31). Full texts of these 47 articles were screened and another 19 articles were further removed. Among the remaining 28 publications, some research studies generated more than 1 publication. After considering whether new data was added in new publications of the same studies, 26 reports (5, 30, 32–55), based on 23 research studies, were included in the current review (see Fig. 2 for details).
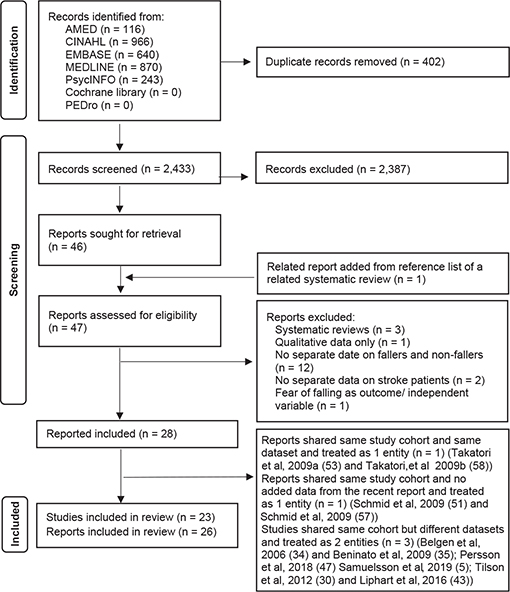
Fig. 2. Flow diagram of included studies.
Characteristics of studies
Table I shows the characteristics of the study settings, study participants and the numbers of reported fallers in each study. Most of the studies were conducted in a non-acute setting. Ten studies (5, 30, 33, 37, 38, 40, 43, 45, 54, 55) reported longitudinal data on the study participants, with a follow-up duration that varied from 1 week up to 12 months post-baseline. All except 1 study (48) reported the proportion of fallers (mean = 40%, range 13–75%).
| Study | Study aims | Sample size/males (%) | Mean age (SD, years) | Mean duration post-stroke (SD, months) | Follow-up | First/recurrent fallers | Proportion of all fallers |
| Akosile et al. 2011 (32) | To investigate relationship between fall, fall risk, FoF and physical functioning in stroke survivors | 26/17 (65) | 55.6 (9.9) | 15.0 (19.2) | NA | 1/4 | 19% |
| Andersson et al. 2008 (33) | To investigate relationship between FoF and functional abilities in stroke survivors | 140/78 (56) | Median = 75, range 35–94 | NA | Half up to 6 months, half up to 12 months | Total fallers = 58 | 41% |
| Belgen et al. 2006b (34) | To determine the relationship between capacity-based and self-efficacy measures to fall history and the predictors for falls in stroke survivors | 50/31 (62) | 59.9 (11.9) | 62.2 (62.1) | NA | 9/11 | 40% |
| Beninato et al. 2009b(35) | To determine the relationship between clinical outcome measures and falls in stroke survivors | 27/15 (56) | 57.2 (12.4) | Median = 34, range 11–312 | NA | 13/9 | 67% |
| Bugdayci et al. 2011 (36) | To determine the differences in features of falls and functional outcome measures between fallers and non-fallers in sub-acute stroke patients | 99/42 (42) | 62.0 (11.8) | 5.2 (2.3) | NA | 17/0 | 17% |
| Forsberg et al. 2013 (37) | To examine the reliability and validity of the Swedish version of ABC scale in stroke survivors | 67/42 (63) | 68.1 (11.2) | 55.2 (66.0)a | 1 week | 13/6 | 28% |
| Goh et al. 2016 (38) | To compare the fall history and to evaluate the relationships between falls factors and FoF between older adults with and without stroke | 75/49 (65) | 66.6 (6.9) | 39.4 (48.0) | 1 month | 14/9 | 31% |
| Handelzalts et al. 2020 (39) | To investigate if clinical measures of proactive balance could differentiate between fallers and non-fallers and to investigate the relationship between reactive and proactive balance abilities in sub-acute stroke patients | 48/38 (79) | 60.8 (8.6) | 1.6 (0.7)a | NA | Total fallers = 36 | 75% |
| Jalayondeja et al. 2014 (40) | To determine if the assessment findings at first month could predict fallers in the 6 months post-stroke and to describe the characteristics of fallers and non-fallers in stroke survivors | 97/59 (62) | 61.9 (11.1) | NA but data collections at 3- and 6-months post-stroke | 6 months | 12/13 | 26% |
| Kongwattanakul et al. 2020 (41) | To use structural equation model of clinical outcomes to predict falls in stroke survivors | 236/153 (65) | 62.5 (10.3) | 38.5 (61.1)a | NA | Total fallers = 88 | 37% |
| Lim et al. 2012 (42) | To investigate falls incidence and risk factors for falls in stroke survivors | 330/177 (54) | 67.9 (13.4) | 20.8 (8.0)a | NA | Total fallers = 62 | 19% |
| Liphart et al. 2016c (43) | Secondary analysis of RCT (30) to assess the discordance between perceived and measured balance and to examine the impact on walking speed and falls in stroke survivors | 352/196 (56) | 61.6 (12.7) | 2.1 (0.4)a at randomization and data collections at 2 months and 12 months post-stroke | 12 months | 84/127 | 60% |
| Liu et al. 2015 (44) | To examine if walking endurance, subjective balance confidence and fear avoidance behaviour were predictors to community reintegration in stroke survivors | 57/40 (70) | 61.1 (6.7) | 97.7 (52.1)a | NA | Total fallers = 12 | 21% |
| Pal et al. 2005 (45) | To investigate concurrent and construct validity and the test-retest reliability of ABC scale and FES in stroke survivors | 24/14 (58) | 75.7 (6.5) | 84 (98.8) | 5 months | 6/7 | 54% |
| Pang & Eng 2008 (46) | To investigate if fall-related self-efficacy could predict balance, mobility, and falls in stroke survivors with low bone mass. | 39/21 (54) | 66.7 (9.1) | 6.5 (5.7) | NA | 12/5 | 44% |
| Persson et al. 2018d (47) | To examine if different baseline characteristics were associated with falling during hospitalization in acute stroke patients | 504/253 (50) | Median = 77, IQR 67–84.8 | 0.1 (0.2)a | NA | 52/13 | 13% |
| Portnoy et al. 2017 (48) | To assess if clinical measures of balance and centre of pressure movement during standing, sit-to-stand and functional reaching were correlated with subjective balance confidence and falls incidence in stroke survivors when compared with healthy young and older controls | 21/13 (62) | 61.4 (10.1) | 17.0 (10.2) | NA | Not provided | Not provided |
| Sahin et al. 2019 (49) | To examine specificity and sensitivity of Balance Evaluation Systems Test in determining the falls risk in stroke survivors | 50/30 (60) | 58.5 (17.7) | 31.4 (49.8)a | NA | Total fallers = 26 | 52% |
| Samuelsson et al. 2019d (5) | Follow-up study (47) to investigate if factors present shortly after stroke were associated with falls over the first 12 months post-stroke in stroke survivors | 348/179 (51) | 75.6 (11.1) | Data collections at 12 months post-stroke | 12 months | Total fallers = 140 | 40% |
| Schinkel-Ivy et al. 2016 (50) | To investigate if variables in quiet standing balance, gait, and reactive stepping were different and if these variables related to balance confidence between individuals with and without FoF in acute stroke patients based on medical record data | 208/113 (54) | 66.6 (12.9) | 0.6 (0.6)a | NA | Total fallers = 99 | 48% |
| Schmid et al. 2009e (51) | To examine FoF incidence and if this immediate post-stroke FoF were correlated to quality of life, occupational performance, psychological and cognitive measures in acute stroke patients | 28/18 (64) | 59.0 (10.0) | 0.2 (0.1)a | NA | Total fallers = 8 | 29% |
| Schmid et al. 2015 (52) | To investigate the FoF prevalence and compare balance, anxiety, depression, activity and participation and stroke severity in people with and without FoF in stroke survivors | 77/58 (75) | 64.1 (8.8) | 53.1 (44.3) | NA | Total fallers = 56 | 73% |
| Takatori et al. 2009af (53) | To assess the discordance between perceived postural limits and falls and if this relation could predict people of high falls risk in sub-acute stroke patients | 76/45 (59) | 68.7 (12.0) | 6.1 (4.7) | NA | 16/21 | 49% |
| Tilson et al. 2012c (30) | RCT to investigate falls incidence and if clinical outcomes at 2 months post-stroke could predict falls at 12 months post-stroke in stroke survivors randomized to either 2 walking programmes or 1 strength training home programme | 408/224 (55) | 62.0 (12.7) | 2.1 (0.4)a at randomization and data collections at 2 months and 12 months post-stroke | 12 months | 88/147 | 58% |
| Tsang & Pang 2020 (54) | To investigate predictive validity of different single-task and dual-task walking tests for falls in stroke survivors | 91/64 (70) | 62.7 (8.3) | 105.6 (63.6)a | 12 months | 14/15 | 32% |
| Wei et al. 2017 (55) | To develop a prediction model for falls using a multidimensional physical assessments and psychological evaluation in stroke patients | 112/60 (54) | 69.6 (10.3) | NA | 6 months | Total faller = 37 | 33% |
| aRe-calculated based on available data from studies. bShared same study cohort but reported different data and hence treated as 2 entities. cShared same study cohort but reported different data and hence treated as 2 entities. dShared same study cohort but reported different data and hence treated as 2 entities. eSchmid 2009 (51) and Schmid 2011 (57) shared same study cohort without extra data added from Schmid 2011 (57) and hence treated as 1 entity (Schmid 2009 (51)). fTakatori 2009a (53) and Takatori 2009b (58) with overlapped datasets and treated as 1 entity (Takatori 2009a (53)). | |||||||
| ABC: Activities-specific Balance Confidence; FES: Falls Efficacy Scale; FoF: fear of falling; NA: not available; RCT: randomized controlled trial; SD: standard deviation. | |||||||
All, except 1 RCT (30), were observational cohort studies (Table II). Over half of the 26 studies (n = 15) used falls recall by the participants as the outcome measure of their falls records, and another 8 studies (30, 40, 43, 45, 47, 50–52) used phone follow-ups or visits in addition to the falls recall. Four studies (36, 47, 50, 53) used the falls data from the medical records of the participants (Table II). The outcome measures used to assess the FoF were a single-question survey using a dichotomous yes or no answer (i.e. whether the participants were afraid of falling) (n = 6 studies) (5, 34, 47, 50–52), FES and its various versions (n = 9 reports) (32–34, 38, 40, 41, 45, 51, 55) and ABC and its various translations (n = 12 studies) (30, 35, 37, 39, 43–46, 48–50, 54). Two studies did not indicate how the FoF was assessed (36, 42). Four studies (34, 44, 45, 50) used more than 1 outcome measure for the FoF (Table II).
| Study | Study design | Measurement of falls | Measurement of fear of falling | Findings on falls and fear of falling |
| Akosile et al. 2011 (32) | Prospective observational single-cohort study with retrospective falls data | Falls recall in past 6 months | Falls Efficacy Scale Swedish version | Spearman correlation r = –0.27 (p = 0.18) in all fallers. Fearful and no fear defined by scoring below or above 8. |
| Andersson et al. 2008 (33) | Prospective observational single-cohort study with retrospective falls data | Falls recall in the last 6 or 12 months | Falls Efficacy Scale Swedish version | All fallers- Univariate analysis OR = 5.1 (95% CI 2.4–10.6). Multivariate analysis OR = 5.0 (95% CI 1.6–15.7) when compared between low and high self-efficacy score (defined as scored below and above group median respectively) Significantly more fallers scored low fall-related self-efficacy (χ2 = 19.9, p < 0.001) |
| Belgen et al. 2006b (34) | Prospective observational single-cohort study with retrospective falls data | Falls recall in past 6 months | Asking if the participants were afraid of falling (yes, no) and to rank fear of falling on a 10-point ordinal scale of 1 (no fear) to 10 (the worst fear you can imagine) | All fallers- 2.4 times (95% CI 1.1–4.9) more likely to be afraid of falling Multiple fallers- 5.6 times (SD 1.3–23) more likely to be afraid of falling |
| Falls Efficacy Scale Swedish version (FES-S)g | All fallers- Significant difference in FES-S between non-fallers (20.9, SD 9.2) vs first time and multiple fallers (28.0, SD 14.8) (p = 0.04) FES-S = 17.5 best differentiated fallers from non-fallers with sensitivity = 0.90, specificity = 0.53 and AUC = 0.71 |
|||
| Beninato et al. 2009b (35) | Prospective observational single-cohort study with retrospective falls datah | Falls recall in past 6 months | Activities-specific Balance Confidence Scale (ABC) | Multiple fallers scored significantly lower in ABC than non-faller/1 fall (p < 0.001) ABC = 81.1 to predict multiple falls with sensitivity = 1.00, specificity = 0.72, AUC = 0.92 (SD 0.82–1.02), LR + = 3,60 (SD 1.71–7.57) and LR– = 0 |
| Bugdayci et al. 2011 (36) | Prospective observational single-cohort study | Current medical records | Not provided | Spearman correlation r = 0.14 (p = 0.16) in all fallersa |
| Forsberg et al. 2013 (37) | Prospective observational single-cohort study with retrospective falls data | Falls recall in past 3 months | Activities-specific Balance Confidence scale Swedish version (ABC-S) | Mann–Whitney U test showed no significant difference in ABC-S score between fallers (n = 48, median = 42 IQR 34–65) and non-fallers (median = 58, IQR 38–72) (p = 0.13) |
| Goh et al. 2016 (38) | Prospective observational cohort study with retrospective falls data and control grouph | Falls recall in past 12 months | Falls Efficacy Scale- International (FES-I) | Unadjusted OR = 0.99 (95% CI 0.27–3.63) (p = 0.99) when compared fallers and non-fallers who both scored over FES-I cut-off point = 27 |
| Handelzalts et al. 2020 (39) | Prospective observational single-cohort study | When the participant fell into and supported by the supportive harness | Activities-specific Balance Confidence Scale | One-way ANOVA showed no significant difference among the 3 groups of fallers and non-fallers (p = 0.125) |
| Jalayondeja et al. 2014 (40) | Prospective observational single-cohort study | Phone calls every 2 weeks from research assistants and falls diary by patients prospectively from 1 month to 6 months post-stroke | Fall Efficacy Scale (FES) | Significant difference in FES between fallers (66.3 SD 36.6 at 1 month, 56.6 SD 34.3 at 3 months, 46.2, SD 31.1 at 8 months) and non-fallers (49.3, SD 36.9 at 1 month, 33.6, SD 32.1 at 3 months, 30.3, SD 30.8 at 6 months) (p < 0.05) Adjusted OR = 4.1 (95% CI 1.19–14.07) (p < 0.05) to predict fallers at 6 months post-stroke with FES cut-off point ≥ 33 at 3 to 6 months post-stroke |
| Kongwattanakul et al. 2020 (41) | Prospective observational single-cohort study with retrospective falls data | Falls recall in past 6 months | Fall Efficacy Scale (FES) | Significant difference in FES between fallers (68.5 SD 50.8) and non-fallers (38.5 SD 43.8) (p < 0.0001) |
| Lim et al. 2012 (42) | Prospective observational single-cohort study | Falls recall since stroke onset until phone interview | Not provided | χ2 test showed > 50% of fallers had FoF and 25% of non-fallers had FoF (p < 0.001, no raw data given) |
| Liphart et al. 2016c (43) | Prospective observational single-cohort study | Monthly falls calendar prospectively with phone follow-ups up to 12 months post-baseline | Activities-specific Balance Confidence Scale (ABC) | Post-hoc pairwise comparisons after χ2 showed those with low ABC (≤ 66) and BBS (≤ 42) scores fell significantly more than those with low ABC score but high BBS (> 42) scores (p = 0.0001) |
| Liu et al. 2015 (44) | Prospective observational single-cohort study with retrospective falls data | Falls recall in the past 6 months | Survey of Activities and Fear of Falling in the Elderly Chinese version (SAFE-C) | No significant difference in SAFE-C between fallers (20.58 SD 18.19) and non-fallers (10.58 SD 10.03) (p = 0.090) |
| Activities-specific Balance Confidence Scale Chinese version (ABC-C) | No significant difference in ABC-C between fallers (73.02 SD 16.91) and non-fallers (74.25 SD 16.80) (p = 0.823) | |||
| Pal et al. 2005 (45) | Prospective observational single-cohort study | Falls diary by patients and fortnightly phone call follow-ups prospectively 5 months post-baseline | Fall Efficacy Scale (FES) | Spearman’s correlation r = –0.024 (p = 0.910) between FES and number of falls |
| Activities-specific Balance Confidence Scale (ABC) | Spearman’s correlation r = 0.014 (p = 0.948) between ABC and number of falls | |||
| Pang & Eng 2008 (46) | Prospective observational single-cohort study with retrospective falls data | Falls recall in the past 12 months | Activities-specific Balance Confidence Scale (ABC) | Adjusted OR = 0.18 (95% CI 0.04–0.97) (p = 0.04) when compared with those below (≤ 80) and above (> 80) cut-off ABC score Trend of significance for higher ABC score in non-fallers (76.7 SD 16.6) than fallers (67.2 SD 17.1) (p = 0.084) |
| Persson et al. 2018d (47) | Prospective observational single-cohort study | Falls register by hospital staff and with retrospective audit if deviations found between reported numbers and medical records | Asking if the participants were afraid of falling (yes, no) | Univariate analysis Hazard ratio = 1.93 (95% CI 1.06 –3.52) (p = 0.031) but insignificant in multivariate analysis Hazard ratio |
| Portnoy et al. 2017 (48) | Prospective observational singel cohort study with control groups | Falls recall since stroke onset | Activities-specific Balance Confidence Scale (ABC) | No significant correlation between ABC score (52.4 SD 24.5) and number of falls (2.2 SD 2.1) (p = 0.866) |
| Sahin et al. 2019 (49) | Prospective observational single-cohort study with retrospective falls data | Falls recall in the past 12 months | Activities-specific Balance Confidence Scale (ABC) | Significant difference in ABC between fallers (median 39.69 IQR 20.46–55.00) and non-fallers (68.44, IQR 51.87–78.12) (p = 0.001) ABC ≥ 55.31 predicted fallers with sensitivity = 0.750, specificity = 0.808, AUC = 0.786 (95% CI 0.657–0.916), LR+ = 3.23 (95% CI 2.4–4.4) and LR– = 0.26 (95% CI 0.09–0.70) |
| Samuelsson et al. 2019d (5) | Prospective observational single-cohort study with retrospective falls data | Falls recall prospectively by self-reported answer in standardized questionnaire at 6 and 12 months post-stroke | Asking if the participants were afraid of falling (yes, no) | Univariate OR = 2.49 (95% CI 1.51–3.80) (p = 0.0002) but non-significant in multivariate analysis |
| Schinkel-Ivy et al. 2016 (50) | Retrospective observational single-cohort study | Past falls record in hospital | Asking if the participants were afraid of falling (yes, no) | χ2 test showed no significant correlation between falls history and FoF (p = 0.089) |
| Activities-specific Balance Confidence Scale (ABC) | Independent t-test (n = 134) showed significant difference in ABC score between fear group (50.3 95% CI 44.4, 56.2) and non-fear group (71.9 95% CI 66.7, 77.1) (p < 0.001) | |||
| Schmid et al. 2009 (51)e | Prospective observational single-cohort study with retrospective falls data | Falls recalls before stroke, during stroke and during hospital stay after stroke | Asking if the participants were afraid of falling (yes, no) | No significant difference in numbers of self-reported falls since stroke between those reporting FoF or no FoF (5/15 reporting FoF vs 3/13 no FoF, p = 0.431) |
| Falls Efficacy Scale Swedish version (FES-S) | Significant difference in FES-S scores between those with (28.57 SD 6.25) and without FoF (35.58 SD 10.54) (p = 0.034) | |||
| Schmid et al. 2015 (52) | Prospective observational single-cohort study with retrospective falls data | Falls recall post-stroke | Asking if the participants were afraid of falling (yes, no) | χ2 test showed no significant correlation between FoF and falls history (p = 0.623) χ2 test showed no significant correlation between FoF and repeated falls (p = 0.214) |
| Takatori et al. 2009af (53) | Prospective observational single-cohort study with retrospective falls data | Falls record in hospital in the past 5 months | Visual analogue scale (line of 10 cm long) from “not at all afraid” to “unbearably fearful”. Participants marked the line to record FoF during a maximum forward reaching movement. | Independent t-test showed no significant difference in FoF between zero/single fallers (2.9 SD 3.2) and multiple fallers (3.5 SD 2.9) (p > 0.05) |
| Tilson et al. 2012c (30) | Randomized controlled trial | Monthly falls calendar prospectively with phone follow-ups for 12 months post-baseline | Activities-specific Balance Confidence Scale (ABC) | ANOVA showed significantly lower ABC score in recurrent/injurious fallers (40.0 SD 22.5) compared with non-fallers (49.8 SD 23.8) and first/non-injurious fallers (44.2 SD 24.9) (p < 0.01) |
| Tsang & Pang 2020 (54) | Prospective observational single-cohort study | Falls recall prospectively with monthly phone call follow-ups for 12 months post-baseline | Activities-specific Balance Confidence Scale Chinese version (ABC-C) | Significant difference in ABC-C score in fallers (67.0 SD 14.3) and non-fallers (75.2 SD 14.2) (p = 0.010) Adjusted OR = 0.961 (95% CI 0.920–1.004) (p = 0.073) in multivariate analysis |
| Wei et al. 2017 (55) | Prospective observational single-cohort study | Falls recall prospectively for 6 months post-baseline with additional research personnel visits at 4, 12 and 24 weeks post-baseline. | Modified Fall Efficacy Scale (mFES) | Significant difference in mFES in fallers (74.9 SD 31.3) and non-fallers (108.5 SD 29.0) (p < 0.001) |
| aCalculated based on raw data provided from the study. bShared same study cohort but reported different data and hence treated as 2 entities. cShared same study cohort but reported different data and hence treated as 2 entities. dShared same study cohort but reported different data and hence treated as 2 entities. eSchmid 2009 (51) and Schmid 2011 (57) shared same study cohort without extra data added from Schmid 2011 (57) and hence treated as 1 entity (Schmid 2009 (51)). fTakatori 2009a (53) and Takatori 2009b (58) with overlapped datasets and hence treated with 1 entity (Takatori 2009a (53)). gSuspected using Falls Efficacy Scale instead of Falls Efficacy Scale-Swedish version based on the definitions of scoring stated in the main text and the results of the fallers and non-faller. hAccording to the definitions of the SIGN list, these studies should be cohort studies instead of case-control study. | ||||
| ANOVA: analysis of variance; AUC: an area under the curve; BBS: Berg Balance Scale; 95% CI: 95% conference interval; FoF: fear of falling; IQR: intraquartile range; LR+: positive likelihood ratio; LR–: negative likelihood ratio; OR: odds ratio; RR: relative risk ratio; SD: standard deviation. | ||||
The findings between the FoF and falls for all the included studies are summarized in Table II. Ten studies showed statistically significant higher OR in falls if the FoF was present (33, 34, 40) and significant higher FoF score in the fallers than non-fallers (30, 33–35, 40–43, 49, 55). In contrast, 10 studies showed no statistically significant correlation between the FoF and falls (32, 36–38, 45, 48, 52) and no difference in the FoF score between the fallers and non-fallers (39, 44, 53). Six studies showed mixed significant and non-significant correlations between the FoF and falls in their data analyses (5, 46, 47, 50, 51, 54).
Quality of included studies and evidence
The SIGN grades of the 26 studies are listed in Table III. Twenty-three studies (5, 30, 33–35, 37–52, 54, 55) are graded with “acceptable” study quality and 3 (32, 36, 53) with “unacceptable” quality. The quality of evidence according to the GRADE is listed in Table IV. The quality of evidence ranged from low to very low.
| Study | 1.1 | 1.2 | 1.3 | 1.4 | 1.5 | 1.6 | 1.7 | 1.8 | 1.9 | 1.10 | 1.11 | 1.12 | 1.13 | 1.14 | Final grade |
| Akosile et al. 2011 (32) | Yes | Doesn’t apply | No | No | 100% | Doesn’t apply | Yes | Doesn’t apply | Can’t say | Yes | Yes | No | Can’t say | No | Unacceptable |
| Andersson et al. 2008 (33) | Yes | Doesn’t apply | Yes | No | 100% | Doesn’t apply | Yes | No | Yes | Yes | Yes | No | No | Yes | Acceptable |
| Belgen et al. 2006a (34) | Yes | Doesn’t apply | Doesn’t apply | No | 100% | Doesn’t apply | Yes | Yes | Yes | Yes | Yes | No | Yes | Yes | Acceptable |
| Beninato et al. 2009a (35) | Yes | Doesn’t apply | Doesn’t apply | No | 100% | Doesn’t apply | Yes | Can’t say | Yes | Yes | Yes | No | Yes | Yes | Acceptable |
| Bugdayci et al. 2011 (36) | Yes | Doesn’t apply | Doesn’t apply | No | 100% | Doesn’t apply | Can’t say | Can’t say | Yes | Can’t say | Yes | No | Yes | Yes | Unacceptable |
| Forsberg et al. 2013 (37) | Yes | Doesn’t apply | Doesn’t apply | No | 98.5% | Doesn’t apply | Yes | No | Yes | Yes | Yes | Yes | Yes | Yes | Acceptable |
| Goh et al. 2016 (38) | Yes | Yes | No | No | 100% | Doesn’t apply | Yes | Can’t say | Yes | Yes | Yes | No | Yes | Yes | Acceptable |
| Handelzalts et al. 2020 (39) | Yes | Doesn’t apply | Doesn’t apply | No | 100% | Doesn’t apply | Yes | No | Yes | Yes | Yes | No | Yes | Yes | Acceptable |
| Jalayondeja et al. 2014 (40) | Yes | Doesn’t apply | Doesn’t apply | No | 73% | Doesn’t apply | Yes | No | Yes | Yes | Yes | Yes | Yes | Yes | Acceptable |
| Kongwattanakul et al. 2020 (41) | Yes | Doesn’t apply | Doesn’t apply | No | 100% | Doesn’t apply | Yes | Yes | Yes | Yes | Yes | No | Yes | Yes | Acceptable |
| Lim et al. 2012 (42) | Yes | Doesn’t apply | Doesn’t apply | No | 82% | Doesn’t apply | Yes | No | Yes | Yes | Yes | No | Yes | Yes | Acceptable |
| Liphart et al. 2016b (43) | Yes | Doesn’t apply | No | No | 86% | Doesn’t apply | Yes | Yes | Yes | Yes | Yes | Yes | No | Yes | Acceptable |
| Liu et al. 2015 (44) | Yes | Doesn’t apply | Doesn’t apply | No | 100% | Doesn’t apply | Yes | No | Yes | Yes | Yes | No | Yes | Yes | Acceptable |
| Pal et al. 2005 (45) | Yes | Doesn’t apply | Doesn’t apply | No | 100% | Doesn’t apply | Yes | No | Yes | Yes | Yes | Yes | No | Yes | Acceptable |
| Pang & Eng 2008 (46) | Yes | Doesn’t apply | Doesn’t apply | No | 100% | Doesn’t apply | Yes | No | Yes | Yes | Yes | No | Yes | Yes | Acceptable |
| Persson et al. 2018c (47) | Yes | Doesn’t apply | Doesn’t apply | No | 100% | Doesn’t apply | Yes | No | Yes | Yes | Yes | No | Yes | Yes | Acceptable |
| Portnoy et al. 2017 (48) | Yes | Yes | No | No | 100% | Doesn’t apply | Yes | No | No | Yes | Yes | No | No | Yes | Acceptable |
| Sahin et al. 2019 (49) | Yes | Doesn’t apply | Doesn’t apply | No | 100% | Doesn’t apply | Yes | No | Yes | Yes | Yes | No | Can’t say | Yes | Acceptable |
| Samuelsson et al. 2019c (5) | Yes | Doesn’t apply | Doesn’t apply | No | 71% | Doesn’t apply | Yes | No | Yes | Yes | Yes | Yes | Yes | Yes | Acceptable |
| Schinkel-Ivy et al. 2016 (50) | Yes | Doesn’t apply | Doesn’t apply | No | 100% | Doesn’t apply | Yes | No | Yes | Yes | Yes | No | Yes | Yes | Acceptable |
| Schmid et al. 2009 (51)d | Yes | Doesn’t apply | Doesn’t apply | No | 100% | Doesn’t apply | Yes | No | Yes | Yes | Yes | No | No | Yes | Acceptable |
| Schmid et al. 2015 (52) | Yes | Doesn’t apply | Doesn’t apply | No | 100% | Doesn’t apply | Yes | No | Yes | Yes | Yes | No | No | Yes | Acceptable |
| Takatori et al. 2009ae (53) | Yes | Doesn’t apply | Doesn’t apply | No | 100% | Doesn’t apply | Yes | No | Yes | Can’t say | Can’t say | No | No | Yes | Unacceptable |
| Tilson et al. 2012b (30) | Yes | Yes | No | No | 100% | Doesn’t apply | Yes | Yes | Yes | Yes | Yes | Yes | No | Yes | Acceptable |
| Tsang & Pang 2020 (54) | Yes | Doesn’t apply | Doesn’t apply | No | 100% | Doesn’t apply | Yes | No | Yes | Yes | Yes | No | Yes | Yes | Acceptable |
| Wei et al. 2017 (55) | Yes | Doesn’t apply | Doesn’t apply | No | 80% | Doesn’t apply | Yes | No | Yes | Yes | Yes | No | Yes | Yes | Acceptable |
| Refer to Table SII for the details of each scoring criterion. | |||||||||||||||
| aShared same study cohort but reported different data and hence treated as 2 entities. bShared same study cohort but reported different data and hence treated as 2 entities. cShared same study cohort but reported different data and hence treated as 2 entities. dSchmid 2009 (51) and Schmid 2011 (57) shared same study cohort without extra data added from Schmid 2011 (57) and hence treated as 1 entity (Schmid 2009 (51)). eTakatori 2009a (53) and Takatori 2009b (58) shared same study cohort and treated as 1 entity (Takatori 2009a (53)). | |||||||||||||||
| Outcome | Certainty assessment | Summary of findings | ||||||||
| Risk of bias | Inconsistency | Indirectness | Imprecision | Publication bias | Overall certainty of evidence | Study event rates (%) | Relative risk ratio (95% CI) | |||
| With no fear of falls | With fear of falls | |||||||||
| Single-question survey | ||||||||||
| All stages | 1,300 (7 observational studies) | Not serious | Not serious | Not serious | Not serious | None | ⨁⨁○○ Low | 412/900 (45.8%) | 241/400 (60.3%) | Relative risk 1.31 (1.14–1.51) |
| Acute stage | 740 (3 observational studies) | Not serious | Not serious | Not serious | Not serious | None | ⨁⨁○○ Low | 242/568 (42.6%) | 94/172 (54.7%) | Relative risk 1.44 (1.22–1.70) |
| Chronic stage | 560 (4 observational studies) | Not serious | Seriousa | Not serious | Not serious | None | ⨁○○○ Very low | 170/332 (51.2%) | 147/228 (64.5%) | Relative risk 1.21 (0.96–1.54) |
| FES | ||||||||||
| Chronic stage | 171 (3 observational studies) | Not serious | Not serious | Not serious | Not serious | None | ⨁⨁○○ Low | 115 | 56 | Mean difference 6.71 higher (0.41 higher to 13.01 higher) |
| ABC | ||||||||||
| Chronic stage | 305 (6 observational studies) | Not serious | Not serious | Not serious | Not serious | None | ⨁⨁○○ Low | 206 | 99 | Mean difference 9.99 lower (15.36 lower to 4.62 lower) |
| aInconsistent results using either random or fixed effect model. | ||||||||||
Association between FoF and falls assessed using a single-question survey
Seven studies including 1,300 participants (5, 34, 36, 47, 50–52) with methodological quality ranging from unacceptable to acceptable showed a significant association between FoF and falls with an overall RR of 1.31 (95% CI 1.14–1.51, Z = 3.77, p = 0.0002; I² = 35%) (Fig. 3a). The quality of evidence according to GRADE for this pooling was low. The level of heterogeneity was moderate (I2 = 35%). Further sensitivity analyses did not reveal any difference by using the random or fixed model effects and by removing the only study with an “unacceptable” quality (36) (Table SIII). Three studies (47, 50, 51) were pooled to examine the RR of falls during acute stroke (Fig. 3b). A significant RR of 1.44 (95% CI 1.22–1.70, Z = 4.23, p < 0.0001; I2 = 0%) was found. The quality of evidence was low. The level of heterogeneity was low (I2 = 0%). No significant difference was found after sensitivity analyses by using the random or fixed model effects and by removing the only retrospective study (50) (Table SIV). Four studies (5, 34, 36, 52) were pooled and an overall non-significant RR of falls with moderate heterogeneity in chronic stroke was found (RR of 1.21, 95% CI 0.96–1.54, Z = 1.61, p = 0.11; I² = 61%) (Fig. 3c). The quality of evidence was very low. Sensitivity analysis has shown significant difference in the result if using the fixed model effect with RR = 1.33 (95% CI 1.15–1.55; Z = 3.75 p = 0.0002; I² = 61%) (Table SIV).
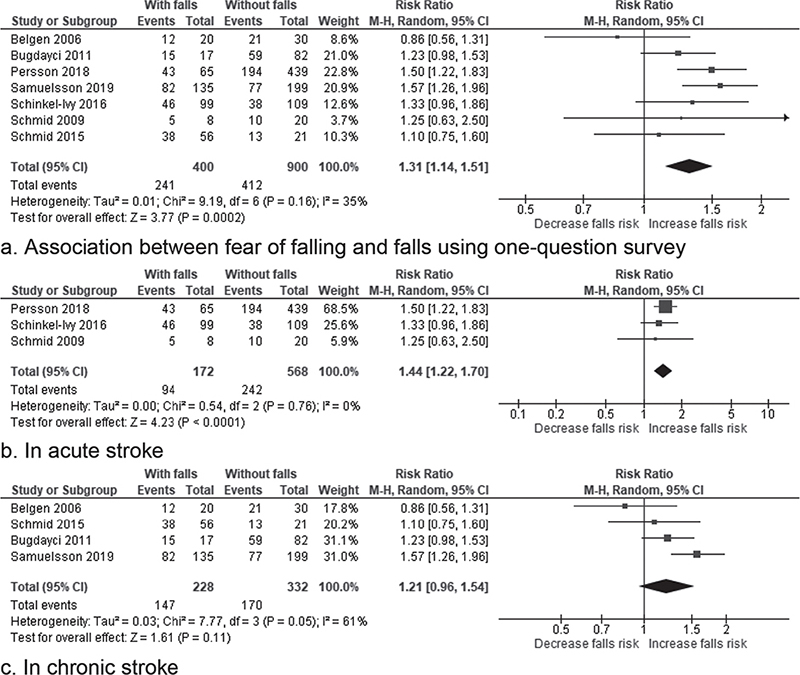
Fig. 3. Forest plot of the association between fear of falling and falls using a single-question survey. (a) Forest plot of the association between fear of falling and falls using a single-question survey in patients with stroke. (b) Forest plot of the association between fear of falling and falls using a single-question survey in patients with acute stroke. (c) Forest plot of the association between fear of falling and falls using a single-question survey in patients with chronic stroke. 95% CI: 95% confidence interval.
Association between fear of falling and falls assessed using Falls Efficacy Scale
Four studies used the original FES to measure FoF (34, 40, 41, 45). One study (40) measured the FoF of the participants at both acute and chronic stages. As this is the only study examining FoF in the acute stroke, no meta-analysis was performed. For the chronic stroke, the meta-analysis of 4 studies (34, 40, 41, 45) of “acceptable” methodological quality showed a significant difference in the FoF scores between the fallers and non-fallers (12.80, 95% CI 1.81–23.78, Z = 2.88, p = 0.02, I² = 79%) (Fig. 4a). The quality of evidence was low. Sensitivity analysis did not show a significant difference in using the random or fixed effect models (Table SIV). However, if the study with participants with explicitly more severe spasticity was removed (41), the pooled mean difference remained significant (6.71, 95% CI 0.41–13.01, Z = 2.09, p = 0.04) with a significantly reduced heterogeneity, I² = 28% (Tau² = 8.93; χ² = 2.78, p = 0.25) (Fig. 4b and Table SIV).
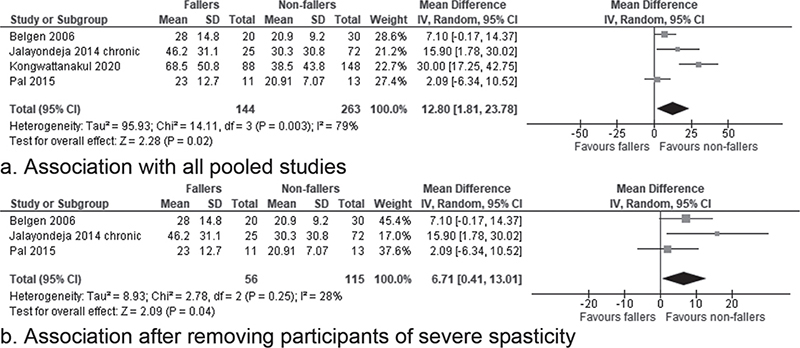
Fig. 4. Forest plot of the association between fear of falling and falls using Falls Efficacy Scale in the chronic stage of stroke. (a) Association with all pooled studies. (b) Association after removing participants of severe spasticity.
Association between FoF and falls assessed using ABC and its translated versions
Only 2 studies (30, 39) used the ABC on participants with acute stroke and, hence, no meta-analysis was conducted. The meta-analysis of the 7 studies on participants with chronic stroke (35, 37, 44–46, 49, 54) of “acceptable” methodological quality revealed a significant difference in the FoF scores between fallers and non-fallers (–12.60, 95% CI –20.75 to –4.55, Z = 3.05, p = 0.002 with high heterogeneity I² = 87%) (Fig. 5a). The quality of evidence was low. Sensitivity analysis did not show a significant difference using the random or fixed effect models (Table SIII). If the study with participants with explicitly better balance were removed (49), the pooled mean difference remained significant (–9.99; 95% CI –15.36 to –4.62, Z = 3.64, p = 0.0003) with a reduced heterogeneity, I² = 57% (Tau² = 23.56; χ² = 11.07, p = 0.04) (Fig. 5b and Table SIII).
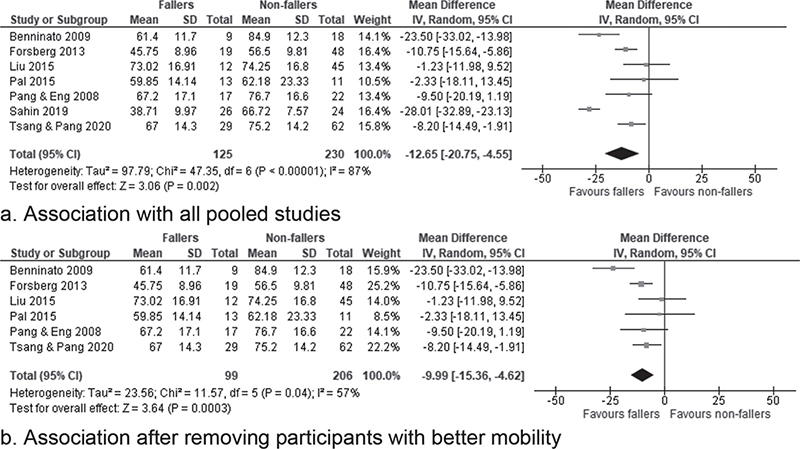
Fig. 5. Forest plot of the association between fear of falling and falls using and Activities-specific Balance Confidence Scale and its various translations in chronic stage of stroke. (a) Association with all pooled studies. (b) Association after removing participants with better mobility.
DISCUSSION
To our knowledge, this is the first systematic review with meta-analysis to rigorously examine the association between falls and FoF in people with stroke. A total of 26 publications based on 23 research studies among 2863 participants with stroke were included in this review. The review found low-level evidence to support that stroke patients with FoF had a higher risk of falls compared with their counterparts without FoF (Table IV). Using a simple question if they were afraid of falling, an overall small, but significant, increase of 31% in the falls risk was found if the person answered yes to this question (Fig. 3a). In the acute stage of stroke, this risk was estimated as 44% for those with a positive answer (Fig. 3b). With the small RR found, it appears that there may be other risk factors contributing to the falls in people with stroke besides their FoF, such as poor balance, abnormal gait, previous falls and impaired cognition (3, 7). There is very low level of evidence to support the association between FoF and falls in the chronic stage if using the single-question survey (Fig. 3c). In chronic stroke, there is low level of evidence to support that those with a lower perceived confidence in avoiding falls during daily activities would have more falls (pooled mean difference of FES = 12.80 and of ABC = –9.99 between the fallers and non-fallers, Figs 4 and 5, respectively).
To answer a research question on the association between the falls and FoF in people with stroke, the most appropriate study design is an observational cohort study (56). According to the scoring criteria of the SIGN checklist, the maximal score for single cohort observational studies is +, i.e. “acceptable” study quality (22). Among the 26 included studies, 23 were of a single cohort (88%), 2 had a comparison group (8%) and 1 RCT (4%) (Table II). Although 3 studies might have potentially granted a higher study quality (i.e. ++), flaws were found in some scoring criteria, raising the possibility of risk of bias, and hence they were downgraded to an “acceptable” study quality (30, 38, 48) (Table III). According to the GRADE criteria, the body of evidence from observational studies starts at a low level (23). Overall low evidence quality reported in this review is essentially due to the study design. Among the included studies with a longitudinal design, data lost to follow-up were high. Strategies to reduce the lost to follow-up data need to be addressed. In addition, the use of blinded assessors and consistent assessments across the study groups at each time-point need to be considered for future studies. Future studies with more rigorous methodological quality are required to examine the association between falls and FoF in people with stroke.
A single-question survey on FoF demonstrated an increased falls risk for people with acute stroke while insignificant among chronic stroke. The latter may be due to the insensitivity of the single-question survey to pick subtle changes in the FoF (16). The use of more objective measures for estimating the FoF, such as the FES or the ABC, reported a significant association between the falls and FoF among patients with chronic stroke. These findings suggest the need for the use of objective measures for FoF estimation among chronic stroke patients rather than using the single-question survey. Our sensitivity analysis further supports the use of FES among patients with less severe post-stroke spasticity (Fig. 4b) and ABC for those with poor to average balance ability (Fig. 5b). Nevertheless, considering the quality of the evidence, these conclusions should be interpreted with caution. Another precaution in interpreting the current findings is that using the single-question survey and standardized outcome measures, such as FES and ABC, may assess different constructs of the FoF (15). The single-question survey is to directly examine the participant’s feeling about falling. The FES and ABC are to assess the operationalized continuum of the FoF into the perceived self-confidence in carrying out common daily activities (16, 17). Both tools were developed based on Bandura’s theory, in which one’s cognitive judgement of their feeling of FoF would influence their decision whether to perform a particular activity, such as reaching for an object on a high shelf (16, 17). This may explain why the single-question survey was unable to show the significant association between the FoF and falls at the chronic stage of stroke. When a person with stroke has returned to their community, their FoF may be manifested into a lack of confidence, inability in performing activities in their daily life safely without falling, and inability to remain active or keep up with their peers (Fig. 1).
Based on the current findings from the best available body of evidence, we speculate that assessment of FoF should be part of the management for this population group, using a single question regarding whether they are afraid of falling at the acute stage, and a more formal outcome measure, such as the FES or ABC, at the chronic stage (11). Education on how to deal with FoF should be included in the fall prevention programmes. Open discussion of this fear in a supportive environment allows people with stroke to understand that FoF could sometimes be beneficial in protecting them from unnecessary falls. Instead of totally eliminating FoF, this type of “healthy” FoF should be differentiated from that restricting them to have the much-needed physical exercises and activities. Education of patients regarding how to recover after a fall and conducting a hazard assessment for falls in the patient’s home are further suggestions to assist people with stroke to minimize an “unhealthy” FoF.
Study limitations
The current review has several limitations. As previously identified as disadvantages of cohort studies (56), the quality of the included studies was limited due to to sample size, non-blinded assessments on the study participants, lack of a comparison group, and lack of follow-up (Tables I–III). Despite a significant association between falls and FoF in people with stroke, the causal relationship could not be confirmed, as most of the included studies were of cross-sectional design rather than longitudinal prospective observations. Selective reporting bias could not be eliminated in this review, as several studies were excluded because of not reporting separate data of FoF of the fallers and non-fallers or separate data on the stroke sub-group (Fig. 2). Lastly, the possibility of language bias could not be eliminated, as the search was restricted to studies published in English. The strengths of this review include: (i) stringent criteria for study inclusion; (ii) use of standardized quality appraisal tools for assessing the methodological quality and the quality of evidence; (iii) the study methodology, including independent reviewers for study search and quality appraisal, ensures comprehensiveness and accuracy of the systematic review; and (iv) the choice of a quantitative approach to pool the findings using a meta-analysis ensures accuracy of the review findings.
Conclusion
This is the first systematic review with meta-analyses to rigorously examine the association between falls and FoF in people with stroke. This review demonstrates low-level evidence for a small and significant association between falls and FoF among both acute and chronic stroke patients. Objective measures for FoF estimation, such as FES and ABC, need to be considered while assessing patients with chronic stroke. Management of FoF should be part of the management, especially among patients with stroke. High-quality studies with prospective design are necessary to confirm these findings.
ACKNOWLEDGEMENTS
This review was supported by the Research Area Seed Fund, The Hong Kong Polytechnic University (grant number: ZVUH). The internal research grant in the University paid for the salary of research personnel and study materials. The funder was not involved in the study design, data collection and analysis, writing of the manuscript, and decision to submit the article for publication.
REFERENCES
- Feigin VL, Stark BA, Johnson CO, Roth GA, Bisignano C, Abady GG, et al. Global, regional, and national burden of stroke and its risk factors, 1990–2019: a systematic analysis for the Global Burden of Disease Study 2019. The Lancet Neurol 2020; 20: 795–820. DOI: 10.1016/S1474-4422(21)00252-0
- Woo J, Ho SC, Goggins W, Chau PH, Lo SV. Stroke incidence and mortality trends in Hong Kong: implications for public health education efforts and health resource utilisation. Hong Kong Med J 2014; 20: 24–29.
- Weerdesteyn V, De Niet M, Van Duijnhoven HJR, Geurts ACH. Falls in individuals with stroke. J Rehabil Res Dev 2008; 45: 1195–1214. DOI: 10.1682/JRRD.2007.09.0145
- Stolze H, Klebe S, Zechlin C, Baecker C, Friege L, Deuschl G. Falls in frequent neurological diseases: Prevalence, risk factors and aetiology. J Neurol 2004; 251: 79–84. DOI: 10.1007/s00415-004-0276-8
- Samuelsson CM, Hansson P-O, Persson CU. Early prediction of falls after stroke: a 12-month follow-up of 490 patients in The Fall Study of Gothenburg (FallsGOT). Clin Rehabil 2019; 33: 773–783. DOI: 10.1177/0269215518819701
- Forster A, Young J. Incidence and consequences of falls due to stroke: a systematic inquiry. BMJ 1995; 311: 83–86. DOI: 10.1136/bmj.311.6997.83
- Xu T, Clemson L, O’Loughlin K, Lannin NA, Dean C, Koh G. Risk factors for falls in community stroke survivors: a systematic review and meta-analysis. Arch Phys Med Rehabil 2018; 99: 563–573. DOI: 10.1016/j.apmr.2017.06.032
- Campbell GB, Matthews JT. An integrative review of factors associated with falls during post-stroke rehabilitation. J Nurs Scholarsh 2010; 42: 395–404. DOI: 10.1111/j.1547-5069.2010.01369.x
- Minet LR, Peterson E, von Koch L, Ytterberg C. Occurrence and predictors of falls in people with stroke. Stroke 2015; 46: 2688–2690. DOI: 10.1161/STROKEAHA.115.010496
- Jönsson A-C, Lindgren I, Delavaran H, Norrving B, Lindgren A. Falls after stroke: a follow-up after ten years in Lund Stroke Register. J Stroke Cerebrovasc Dis 2021; 30: 105770. DOI: 10.1016/j.jstrokecerebrovasdis.2021.105770
- Friedman SM, Munoz B, West SK, Rubin GS, Fried LP. Falls and fear of falling: Which comes first? A longitudinal prediction model suggests strategies for primary and secondary prevention. J Am Geriatr Soc 2002; 50: 1329–1335. DOI: 10.1046/j.1532-5415.2002.50352.x
- Watanabe Y. Fear of falling among stroke survivors after discharge from inpatient rehabilitation. Int J Rehabil Res 2005; 28: 149–152. DOI: 10.1097/00004356-200506000-00008
- Xie Q, Pei J, Gou L, Zhang Y, Zhong J, Su Y, et al. Risk factors for fear of falling in stroke patients: a systematic review and meta-analysis. BMJ Open 2022; 12: e056340. DOI: 10.1136/bmjopen-2021-056340
- Teasell R, McRae M, Foley N, Bhardwaj A. The incidence and consequences of falls in stroke patients during inpatient rehabilitation: factors associated with high risk. Arch Phys Med Rehabil 2002; 83: 329-333. DOI: https://doi.org/10.1053/apmr.2002.29623
- Jørstad EC, Hauer K, Becker C, Lamb SE. Measuring the psychological outcomes of falling: a systematic review. J Am Geriatr Soc 2005; 53: 501–510. DOI: 10.1111/j.1532-5415.2005.53172.x
- Tinetti ME, Richman D, Powell L. Falls efficacy as a measure of fear of falling. J Gerontol 1990; 45: 239–243. DOI: 10.1093/geronj/45.6.P239
- Powell LE, Myers AM. The Activities-specific Balance Confidence (ABC) scale. J Gerontol: Series A 1995; 50A: M28–M34. DOI: 10.1093/gerona/50A.1.M28
- Wu P, Zeng F, Li YX, Yu BL, Qiu LH, Qin W, et al. Changes of resting cerebral activities in subacute ischemic stroke patients. Neural Regen Res 2015; 10: 760–765. DOI: 10.4103/1673-5374.156977
- Review Manager 5 (RevMan 5) [Computer program]. Version 5.4. Copenhagen: The Cochrane Collaboration, 2020.
- Clemens B, Lamb SE. Manual for the fall prevention classification system: Version 1. 2007. [Accessed 2023 March 27]. Available from: http://www.profane.eu.org/documents/Falls_Taxonomy.pdf
- Page MJ, Higgins JPT, Sterne JAC. Assessing risk of bias due to missing results in a synthesis. In: Higgins JPT, Thomas J, Chandler J, et al, eds. Cochrane Handbook for Systematic Reviews of Interventions version 62. Cochrane; 2021:chap 13. [Assessed March 27, 2023] Available from www.training.cochrane.org/handbook.
- Sleith C. SIGN Methodology checklists. Scottish Intercollegiate Guidelines Network, Healthcare Improvement Scotland. [Accessed 2023 March 27]. Available from: https://www.sign.ac.uk/what-we-do/methodology/checklists/
- Balshem H, Helfand M, Schünemann HJ, Oxman AD, Kunz R, Brozek J, et al. GRADE guidelines: 3. Rating the quality of evidence. J Clin Epidemiol 2011; 64: 401–406. DOI: 10.1016/j.jclinepi.2010.07.015
- Guyatt GH, Oxman AD, Sultan S, Glasziou P, Akl EA, Alonso-Coello P, et al. GRADE guidelines: 9. Rating up the quality of evidence. J Clin Epidemiol 2011; 64: 1311–1316. DOI: 10.1016/j.jclinepi.2011.06.004
- Guyatt GH, Oxman AD, Vist G, Kunz R, Brozek J, Alonso-Coello P, et al. GRADE guidelines: 4. Rating the quality of evidence-study limitations (risk of bias). J Clin Epidemiol 2011; 64: 407–415. DOI: 10.1016/j.jclinepi.2010.07.017
- Guyatt GH, Oxman AD, Kunz R, Woodcock J, Brozek J, Helfand M, et al. GRADE guidelines: 7. Rating the quality of evidence-inconsistency. J Clin Epidemiol 2011; 64: 1294–1302. DOI: 10.1016/j.jclinepi.2011.03.017
- Guyatt GH, Oxman AD, Kunz R, Woodcock J, Brozek J, Helfand M, et al. GRADE guidelines: 8. Rating the quality of evidence-indirectness. J Clin Epidemiol 2011; 64: 1303–1310. DOI: 10.1016/j.jclinepi.2011.04.014
- Guyatt GH, Oxman AD, Kunz R, Brozek J, Alonso-Coello P, Rind D, et al. GRADE guidelines 6. Rating the quality of evidence-imprecision. J Clin Epidemiol 2011; 64: 1283–1293. DOI: 10.1016/j.jclinepi.2011.01.012
- Guyatt GH, Oxman AD, Montori V, Vist G, Kunz R, Brozek J, et al. GRADE guidelines: 5. Rating the quality of evidence-publication bias. J Clin Epidemiol 2011; 64: 1277–1282. DOI: 10.1016/j.jclinepi.2011.01.011
- Tilson JK, Wu SS, Cen SY, Feng Q, Rose DR, Behrman AL, et al. Characterizing and identifying risk for falls in the LEAPS study: a randomized clinical trial of interventions to improve walking poststroke. Stroke 2012; 43: 446–452. DOI: 10.1161/STROKEAHA.111.636258
- Abou L, Alluri A, Fliflet A, Du Y, Rice LA. Effectiveness of physical therapy interventions in reducing fear of falling among individuals with neurologic diseases: a systematic review and meta-analysis. Arch Phys Med Rehabil 2021; 102: 132–154. DOI: 10.1016/j.apmr.2020.06.025
- Akosile C, Fabunmi A, Umunnah J, Okoye C. Relationships between fall indices and physical function of stroke survivors in Nigeria. Int J Ther Rehabil 2011; 18: 487–491.
- Andersson ÅG, Kamwendo K, Appelros P. Fear of falling in stroke patients: Relationship with previous falls and functional characteristics. Int J Rehabil Res 2008; 31: 261–264. DOI: 10.1097/MRR.0b013e3282fba390
- Belgen B, Beninato M, Sullivan PE, Narielwalla K. The association of balance capacity and falls self-efficacy with history of falling in community-dwelling people with chronic stroke. Arch Phys Med Rehabil 2006; 87: 554–561. DOI: 10.1016/j.apmr.2005.12.027
- Beninato M, Portney LG, Sullivan PE. Using the International Classification of Functioning, Disability and Health as a framework to examine the association between falls and clinical assessment tools in people with stroke. Phys Ther 2009; 89: 816–825. DOI: 10.2522/ptj.20080160
- Bugdayci D, Paker N, Dere D, Özdemir E, Ince N. Frequency, features, and factors for falls in a group of subacute stroke patients hospitalized for rehabilitation in Istanbul. Arch Gerontol Geriatr. 2011; 52: e215–e219. DOI: 10.1016/j.archger.2010.11.014
- Forsberg A, Nilsagard Y. Validity and reliability of the Swedish version of the Activities-Specific Balance Confidence Scale in people with chronic stroke. Physiother Can 2013; 65: 141–147. DOI: 10.3138/ptc.2011-54
- Goh HT, Nadarajah M, Hamzah NB, Varadan P, Tan MP. Falls and fear of falling after stroke: a case-control study. PM and R 2016; 8: 1173–1180. DOI: 10.1016/j.pmrj.2016.05.012
- Handelzalts S, Gray G, Steinberg-Henn F, Soroker N, Melzer I. Characteristics of proactive balance and gait performance in subacute stroke patients demonstrating varying reactive balance capacity: a research study. NeuroRehabilitation 2020; 46: 491–500. DOI: 10.3233/NRE-203039
- Jalayondeja C, Sullivan PE, Pichaiyongwongdee S. Six-month prospective study of fall risk factors identification in patients post-stroke. Geriatri Gerontol Int 2014; 14: 778–785. DOI: 10.1111/ggi.12164
- Kongwattanakul K, Hiengkaew V, Jalayondeja C, Sawangdee Y. A structural equation model of falls at home in individuals with chronic stroke, based on the international classification of function, disability, and health. PLoS One. 2020; 15: 24. DOI: 10.1371/journal.pone.0231491
- Lim JY, Jung SH, Kim WS, Paik NJ. Incidence and risk factors of poststroke falls after discharge from inpatient rehabilitation. PM and R 2012; 4: 945–953. DOI: 10.1016/j.pmrj.2012.07.005
- Liphart J, Gallichio J, Tilson JK, Pei Q, Wu SS, Duncan PW. Concordance and discordance between measured and perceived balance and the effect on gait speed and falls following stroke. Clin Rehabil 2016; 30: 294–302. DOI: 10.1177/0269215515578294
- Liu TW, Ng SS, Kwong PW, Ng GY. Fear avoidance behavior, not walking endurance, predicts the community reintegration of community-dwelling stroke survivors. Arch Phys Med Rehabil 2015; 96: 1684–1690. DOI: 10.1016/j.apmr.2015.05.005
- Pal J, Hale L, Skinner M. Investigating the reliability and validity of two balance measures in adults with stroke. Int J Ther Rehabil 2005; 12: 308–315. DOI: 10.12968/ijtr.2005.12.7.19545
- Pang MYC, Eng JJ. Fall-related self-efficacy, not balance and mobility performance, is related to accidental falls in chronic stroke survivors with low bone mineral density. Osteoporos Int 2008; 19: 919–927. DOI: 10.1007/s00198-007-0519-5
- Persson CU, Kjellberg S, Lernfelt B, Westerlind E, Cruce M, Hansson P-O. Risk of falling in a stroke unit after acute stroke: The Fall Study of Gothenburg (FallsGOT). Clin Rehabil 2018; 32: 398–409. DOI: 10.1177/0269215517728325
- Portnoy S, Reif S, Mendelboim T, Rand D. Postural control of individuals with chronic stroke compared to healthy participants: Timed-Up-and-Go, Functional Reach Test and center of pressure movement. Eur J Phys Rehabil Med 2017; 53: 685–693. DOI: 10.23736/S1973-9087.17.04522-1
- Sahin IE, Guclu-Gunduz A, Yazici G, Ozkul C, Volkan-Yazici M, Nazliel B, Tekindal MA. The sensitivity and specificity of the balance evaluation systems test-BESTest in determining risk of fall in stroke patients. NeuroRehabilitation 2019; 44: 67–77. DOI: 10.3233/NRE-182558
- Schinkel-Ivy A, Inness EL, Mansfield A. Relationships between fear of falling, balance confidence, and control of balance, gait, and reactive stepping in individuals with sub-acute stroke. Gait Posture 2016; 43: 154–159. DOI: 10.1016/j.gaitpost.2015.09.015.
- Schmid AA, Acuff M, Doster K, Gwaltney-Duiser A, Whitaker A, Damush T, et al. Poststroke fear of falling in the hospital setting. Top Stroke Rehabil 2009; 16: 357–366. DOI: 10.1310/tsr1605-357
- Schmid AA, Arnold SE, Jones VA, Ritter MJ, Sapp SA, Van Puymbroeck M. Fear of falling in people with chronic stroke. Am J Occup Ther 2015; 69: 1–5. DOI: 10.5014/ajot.2015.016253
- Takatori K, Okada Y, Shomoto K, Shimada T. Does assessing error in perceiving postural limits by testing functional reach predict likelihood of falls in hospitalized stroke patients? Clin Rehabil 2009; 23: 568–575. DOI: 10.1177/0269215509102957
- Tsang CSL, Pang MYC. Association of subsequent falls with evidence of dual-task interference while walking in community-dwelling individuals after stroke. Clin Rehabil 2020; 34: 971–980. DOI: 10.1177/0269215520923700
- Wei T-S, Liu P-T, Chang L-W, Liu S-Y. Gait asymmetry, ankle spasticity, and depression as independent predictors of falls in ambulatory stroke patients. PLoS One 2017; 12: e0177136. DOI: 10.1371/journal.pone.0177136
- Song JW, Chung KC. Observational studies: cohort and case-control studies. Plast Reconstr Surg 2010; 126: 2234–2242. DOI: 10.1097/PRS.0b013e3181f44abc
- Schmid AA, Van Puymbroeck M, Knies K, Spangler-Morris C, Watts K, Damush T, Williams LS. Fear of falling among people who have sustained stroke: a 6-month longitudinal pilot study. Am J Occup Ther 2011; 65: 125–132. DOI: 10.5014/ajot.2011.000737
- Takatori K, Shomoto K, Shimada T. Relationship between self-perceived postural limits and falls among hospitalized stroke patients. J Phys Ther Sci 2009; 21: 29–35. DOI: 10.1589/jpts.21.29