ORIGINAL REPORT
VALIDITY, INTRA-RATER RELIABILITY AND NORMATIVE DATA OF THE NEUROFLEXOR™ DEVICE TO MEASURE SPASTICITY OF THE ANKLE PLANTAR FLEXORS AFTER STROKE
Gaia Valentina PENNATI1, MD, PhD, Loïc CARMENT2, PhD, Alison K. GODBOLT1, MRCP, MD, Jeanette PLANTIN1, PT, PhD, Jörgen BORG1, MD, PhD and Påvel G. LINDBERG1,2, PT, PhD
From the 1Department of Clinical Sciences, Division of Rehabilitation Medicine, Karolinska Institutet, Danderyd Hospital, Stockholm, Sweden and 2Institut de Psychiatrie et Neurosciences de Paris, Inserm U1266, Université de Paris, Paris, France
Objective: Quantification of lower limb spasticity after stroke and the differentiation of neural from passive muscle resistance remain key clinical challenges. The aim of this study was to validate the novel NeuroFlexor foot module, to assess the intra-rater reliability of measurements and to identify normative cut-off values.
Methods: Fifteen patients with chronic stroke with clinical history of spasticity and 18 healthy subjects were examined with the NeuroFlexor foot module at controlled velocities. Elastic, viscous and neural components of passive dorsiflexion resistance were quantified (in Newton, N). The neural component, reflecting stretch reflex mediated resistance, was validated against electromyography activity. A test-retest design with a 2-way random effects model permitted study of intra-rater reliability. Finally, data from 73 healthy subjects were used to establish cut-off values according to mean + 3 standard deviations and receiver operating characteristic curve analysis.
Results: The neural component was higher in stroke patients, increased with stretch velocity and correlated with electromyography amplitude. Reliability was high for the neural component (intraclass correlation coefficient model 2.1 (ICC2,1) ≥ 0.903) and good for the elastic component (ICC2,1 ≥ 0.898). Cut-off values were identified, and all patients with neural component above the limit presented pathological electromyography amplitude (area under the curve (AUC) = 1.00, sensitivity = 100%, specificity = 100%).
Conclusion: The NeuroFlexor may offer a clinically feasible and non-invasive way to objectively quantify lower limb spasticity.
LAY ABSTRACT
Spasticity is a sensorimotor impairment, which often occurs after stroke as well as after other injuries to the central nervous system. Spasticity is characterized by increased resistance to passive stretch of weak muscles due to increased reflex activity. Spasticity is currently measured clinically while the examiner passively stretches a muscle. However, the clinical method cannot differentiate resistance due to increased reflex activity from resistance due to muscle stiffness, which can develop over time in weakened muscles. The aim of this study was to evaluate the novel NeuroFlexor foot module, which was developed to quantify and distinguish nerve and muscle components of resistance during passive stretching of the lower limb muscles. By quantifying these factors, one can obtain more reliable information than the clinical examination allows. NeuroFlexor measurements in 15 patients in the chronic stage after stroke and 18 healthy individuals allowed the validity of the method to be evaluated by assessing the relationship with velocity of stretch and by simultaneously examining the reflex activity using surface electromyography. The reliability of NeuroFlexor measurements was studied by comparing repeated measurements. Finally, the study established normal NeuroFlexor values from 73 healthy individuals. The results suggest that the NeuroFlexor foot module may be a valid, reliable and easy-to-use objective method to quantify lower limb spasticity.
Key words: stroke; muscle spasticity; stretch reflex; outcome assessment; lower extremity; pilot.
Citation: J Rehabil Med 2023; 55: jrm00356. DOI: https://dx.doi.org/10.2340/jrm.v55.2067
Copyright: © Published by Medical Journals Sweden, on behalf of the Foundation for Rehabilitation Information. This is an Open Access article distributed under the terms of the Creative Commons Attribution-NonCommercial 4.0 International License (https://creativecommons.org/licenses/by-nc/4.0/)
Accepted: Oct 18, 2022; Published: Mar 3, 2023
Correspondence address: Gaia Valentina Pennati, Department of Clinical Sciences, Division of Rehabilitation Medicine, Karolinska Institute, Danderyds sjukhus, Entrévägen 8 SE-182 88 Stockholm, Sweden. E-mail: gaia.valentina.pennati@ki.se
Competing interests and funding: PGL is a shareholder in the company Aggero MedTech AB manufacturing the NeuroFlexor instrument. The remaining authors have no conflicts of interest to declare.
Spasticity is an important sensorimotor impairment arising from injuries to the central nervous system, which is frequently associated with activity and participation restrictions that impact negatively on patients’ quality of life (1–4). For example, spasticity of the ankle plantarflexors, together with muscle weakness, pain, prolonged altered posture and limb non-use, probably contributes to disordered gait (5, 6). As defined by Lance (7) in 1980, spasticity is a “sensorimotor disorder” characterized by “a velocity-dependent increase in tonic stretch reflexes”, “resulting from hyperexcitability of the stretch reflex”. Conventional clinical assessment methods (e.g. the Ashworth scale (8) and the Tardieu scale (9), and their modified versions (10, 11)) are based mainly on subjective rating of passive movement resistance without specific testing of stretch reflex responses and without controlling for velocity. Therefore, the validity and reliability of these clinical scales have been questioned (12–15). Pathological changes in passive muscle properties and connective tissue, especially alterations in elasticity associated with muscle shortening and contracture (16), may also contribute to enhancement of the resistance to passive movement after stroke, and thus confound the assessment finding. An accurate evaluation of spasticity and other underlying mechanisms of stretch resistance is important for diagnosis, choice and timing of treatment (17–19). Increased resistance that is predominantly of neural origin (i.e. involving hyperexcitability of stretch reflex) would be expected to respond to intramuscular injection of botulinum toxin A (20–22) or to transcutaneous electrical nerve stimulation (23, 24). In contrast, other methods, such as stretching techniques, would be more effective if the predominant contribution to the increased resistance is elastic (25, 26). Novel tools, which incorporate kinetic or kinematic characteristics to objectively measure hyper-resistance and electrical activity in the muscles, in addition to stiffness, are therefore needed to enhance the evaluation of spasticity (27).
The NeuroFlexor™ device (Aggero MedTech AB, Älta, Sweden) quantifies and distinguishes the components of the resistance to a passive movement, i.e. the active neural force produced by muscle contractions induced by stretch reflexes (spasticity), and the passive contributions reflecting changes in mechanical properties (viscosity and elasticity). A biomechanical algorithm was developed for the NeuroFlexor hand module to evaluate spasticity in the upper limb, and its validity, reliability and sensitivity to change were described previously (28–31). The primary aim of the current study was to determine the validity and reliability of the new NeuroFlexor foot module. A secondary aim was to provide normative data from a representative sample of healthy subjects, and to establish cut-off values for the accurate measurement of lower limb spasticity.
METHODS
Participants
A total of 15 patients (11 male; mean (SD) age 51.13 (11.87) years) in the chronic phase after stroke (≥ 6 months after onset), with varying degrees of muscle weakness and spasticity as assessed clinically, were examined using the NeuroFlexor foot module. Exclusion criteria comprised severe contractures, which prevented the passive range of movement required for NeuroFlexor assessment (i.e. at least 30°); any other neurological or rheumatological disorder; recent fractures of the lower limb; presence of a pacemaker or other stimulators; pregnancy; inability to communicate; or to understand information about the study. Patients who received intramuscular injections as treatment for spasticity could participate only if the time since their last treatment was at least 3 months. The control group comprised 73 healthy adult individuals (26 male; 40.96 mean (SD) age (12.60) years) and with no history of neurological disease, constituted the control group.
Written informed consent was obtained from all participants. The study was approved by the Regional Ethics Review Board in Stockholm (DNR: 2016/2213-31/2). All procedures complied with the Declaration of Helsinki.
Characteristics of the study population
Data regarding age and sex were collected. Anthropometric measurements, such as height, body weight and calf circumference, were also recorded. In addition, information about patients’ stroke type (ischaemia or haemorrhage) and lesioned hemisphere, and time to inclusion from stroke onset were obtained and are summarized in Table I.
Clinical measures
Passive and active range of motion (ROM) of the ankle were measured using a goniometer to evaluate limitation in joint movement related to changes in muscle and connective tissue, and to minimize the risk of discomfort or injury during NeuroFlexor assessment. The Modified Ashworth scale (MAS) (10), a 6-point ordinal scale (from 0 = no spasticity, to 4 = fixed muscle contracture), was used to rate the resistance encountered clinically during passive muscle stretching. Despite the limitations mentioned, MAS is widely applied, both in clinical practice and in research, for spasticity evaluation, and it was therefore used for comparison. Finally, the presence of clonus elicited during MAS assessment was recorded as: no clonus, mild-moderate = 1 – 10 beats, and sustained > 10 beats.
NeuroFlexor foot module
The NeuroFlexor foot module was used to quantify passive movement resistance (in Newton, N) during ankle dorsi-flexion. As described previously (28), it incorporates a biomechanical algorithm allowing the stretch reflex mediated force (i.e. spasticity) to be distinguished from the passive mechanical components contributing to the resistance (viscous-elastic component). Briefly, resting tension (P0) reflects the tonic muscle tension of the lower limb before the onset of movement. Elasticity (EC) is the length-dependent resisting force that increases as muscles and tendons are stretched (32). EC is estimated at the end of a slow stretch (5°/s) that does not activate stretch reflexes. A high value of EC reflects lower elastic property of the tissues. Viscosity (VC) is the velocity-dependent resisting force produced by friction of sliding muscle fibres. It assumes its highest value during the initial acceleration (approximately 35 ms after the movement onset) and continues at a lower level during the remaining muscle stretch at high velocity. Finally, the neural component (NC) is the active force produced by muscle contractions induced by stretch reflexes, which is estimated in the model at the maximal muscle stretch by subtracting EC and VC from the total resisting force.
The NeuroFlexor foot module measurement was performed on the paretic foot in stroke patients and on the dominant side in healthy subjects. Participants were seated on a height-adjustable chair in a comfortable seating position, with the foot placed on the device platform, and were instructed to relax during the testing session. Passive dorsiflexion of the ankle was measured in the stroke patients and a sub-group (n = 18) of healthy subjects at different isokinetic velocities ordered in 3 randomized sequences to minimize order effects: (a) 5, 120, 180, 240°/s; (b) 120, 5, 240, 180°/s and (c) 240, 120, 180°/s. The range of ankle movement was from 35° of plantarflexion to 5° of dorsiflexion (i.e. 40° stretch) or, in case of limited joint movement, from 35° of plantarflexion to 5° of plantarflexion (i.e. 30° stretch). The knee joint was positioned at 45° of flexion. A single value of NC, EC and VC was calculated by a dedicated software (NeuroFlexor Scientific, Release 1.0.0, Aggero MedTech AB, Älta, Sweden) at the end of the test by averaging 4 resisting forces produced during slow movement (5°/s) and 9 resisting force to fast movement (120, 180 or 240°/s). In the stroke patients, a second NeuroFlexor test was performed with a 10-min interval between sessions to assess intra-rater reliability.
A total of 73 healthy subjects were evaluated during passive stretch at 2 velocities (slow (5°/s) and fast (240°/s)) and with the 2 ranges of ankle movement (from 35° of plantarflexion to 5° of plantarflexion, and from 35° of plantarflexion to 5° of dorsiflexion), in order to obtain normative NeuroFlexor data.
Surface electromyography
In stroke patients and a sub-group (n = 18) of healthy subjects, surface electromyography (EMG) of medial gastrocnemius and soleus muscles was recorded with the NeuroFlexor assessment during the whole passive movement from onset until full ankle dorsiflexion.
For EMG recordings, disposable gelled Ag/AgCl electrodes were used. EMG signals were amplified with a Grass LP511 Ac Amplifier (Grass Technologies, Astro-Med, Inc., West Warwick, RI, USA), sampled at 1 kHz using a CED Power1401 (Cambridge Electronic Designs, Cambridge, UK) and rectified. The root mean square of the EMG signal, with a 50 ms sliding window, was computed to generate the EMG amplitude during the whole NeuroFlexor movement from onset until full dorsiflexion of ankle. Data were acquired with Spike2 software (Version 7.12; CED) and analysed off-line using custom-written programmes in MATLAB R2021a (The MathWorks, Inc., Natick, MA, USA).
Statistical analysis
To compute statistical power, values of NeuroFlexor NC previously recorded in chronic stroke patients (33) (n = 20, mean 11.24, SD (11.96)) and in healthy subjects (28) (n = 13, mean 0.0 (SD 2.0)) were used. A 1-sided power calculation indicated a sample size of n=14 to achieve power = 0.8, p < 0.05. Descriptive statistics are presented as mean (standard deviation; SD) for normally distributed continuous data and as median (interquartile range; IQR) for ordinal and not normally distributed data (detected with the Shapiro–Wilk test). Spearman’s rank correlation (rs) was conducted to measure the correlation between NeuroFlexor components and age and anthropometric measurements. Sex differences were evaluated with a Mann–Whitney U test. In addition, the Mann–Whitney U test was used to evaluate differences between NC quantified in stroke patients and in healthy subjects at different stretch velocities.
After natural log transformation (applied to correct skewed distribution), a repeated measures analysis of variance (rm-ANOVA) investigated the difference in NC quantified at 120, 180 and 240°/s in the stroke patients. A further rm-ANOVA was performed in the sub-group of healthy subjects. In addition, a non-parametric Friedman test was conducted to confirm the differences in stroke patients’ NC depending on stretch velocities. Spearman’s rank correlation (rs) was used to investigate relationships between EMG signal and NC, and between the clinically scored muscle tone according to MAS and NC and the NeuroFlexor total resistance force.
To assess reliability, a 2-way random effects model, single measure, absolute-agreement, was used to generate an intraclass correlation coefficient model 2.1 (ICC2,1) with 95% CI. To rate the ICC coefficients, Currier’s suggestion (34) was used: 0.90 – 0.99 = high reliability, 0.80 – 0.89 = good reliability, 0.70 – 0.79 = fair reliability, and ≤ 0.69 = poor reliability. In addition, a test-retest repeatability coefficient, as an expression of the smallest real difference between measurements, was calculated by multiplying the standard error of measurement (SEM) by 2.77 (i.e. 1.96 × √2) (35). SEM represents the within-subjects standard deviation and was calculated as SD × √(1–ICC). A paired t-test was used to assess any systematic bias between the 2 sessions.
In healthy subjects, cut-off values for the NeuroFlexor components were established by adding 3 SD to the mean (32), after elimination of outliers defined with the interquartile method. This conservative approach ensured that almost all healthy subjects fall within the cut-off score and, therefore, that a measured value above the limit could be considered pathological. In addition, limits of normality of stretch-induced EMG amplitude were established for gastrocnemius and soleus muscles, by adding 3 SD to the mean. Receiver operating characteristic (ROC) curve analysis was then used to validate cut-off values for NC for both 30° and 40°, by comparing with pathological EMG amplitudes.
The level of statistical significance was set at p ≤ 0.05. All statistical analyses were performed using IBM SPSS Statistics for Windows, Version 27.0 (IBM Corp., Armonk, NY, USA).
RESULTS
Validity of the NeuroFlexor foot module: velocity dependence of the neural component
Values, in median (IQR), of NeuroFlexor components and amplitude of electromyography signal recorded at different velocities, are shown in Table II. Stroke patients had statistically significantly higher NC compared with healthy subjects at 120, 180 and 240°/s (U = 16.50, p < 0.001, U = 11.00, p < 0.001 and U = 19.00, p < 0.001, respectively). NC, EC and total resistance did not differ between male and female (p > 0.18) stroke patients. In healthy subjects, there was no sex difference for NC. However, males had statistically significantly higher EC and total resistance compared with females (U = 216, p < 0.001 and U = 231, p < 0.001, respectively). Age did not correlate significantly with any NeuroFlexor components.
| Variables | Stroke patients (N = 15) | Healthy subjects (n = 18) | ||||
| 120°/s Median (IQR) | 180°/s Median (IQR) | 240°/s Median (IQR) | 120°/s Median (IQR) | 180°/s Median (IQR) | 240°/s Median (IQR) | |
| NeuroFlexor foot module (Newton) | ||||||
| NC | 22.62* (36.27) | 27.58* (42.30) | 35.88* (45.13) | 6.89* (4.46) | 9.09* (5.91) | 12.32* (6.88) |
| Male | 31.90 (36.79) | 39.74 (47.59) | 45.76 (47.10) | 7.18 (5.05) | 9.18 (2.98) | 12.37 (6.04) |
| Female | 21.21 (38.46) | 24.80 (30.43) | 30.74 (37.33) | 2.63 (5.58) | 4.38 (9.91) | 4.84 (12.71) |
| EC | 73.08 (37.68) | 72.68 (35.14) | 72.32 (37.65) | 48.48 (20.55) | 49.17 (20.69) | 49.27 (19.54) |
| Male | 75.09 (33.63) | 75.13 (33.91) | 75.49 (29.92) | 50.39† (11.98) | 50.06† (10.35) | 50.77† (9.74) |
| Female | 48.23 | 47.28 (52.49) | 47.60 (53.56) | 27.27† (31.34) | 27.81† (29.57) | 28.77† (29.37) |
| VC | 1.55 (1.09) | 2.20 (1.16) | 3.12 (2.06) | 1.24 (0.86) | 2.03 (1.13) | 2.91 (1.18) |
| Male | 1.66 (1.34) | 2.32 (1.16) | 3.15 (2.00) | 1.62 (0.84) | 2.32 (1,74) | 2.43 (1.97) |
| Female | 1.46 (0.91) | 3.00 (2.23) | 0.86 (1.37) | 1.74 (1.21) | 2.96 (0.72) | |
| Total resistance | 107.22 (25.82) | 114.04 (25.36) | 110.40 (32.33) | 57.03 (19.84) | 61.35 (19.66) | 66.44 (24.88) |
| Male | 111.94 (21.48) | 114.59 (28.67) | 114.66 (36.83) | 60.29† (13.69) | 63.88† (13.06) | 67.14 (17.02) |
| Female | 83.28 (75.99) | 79.87 (59.94) | 86.23 (64.41) | 30.06† (37.54) | 33.93† (39.89) | 36.46 (41.40) |
| Electromyography (mV) | ||||||
| Gastrocnemius muscle | 0.025 (0.051) | 0.043 (0.053) | 0.069 (0.084) | 0.009 (0.008) | 0.014 (0.017) | 0.019 (0.019) |
| Soleus muscle | 0.058 (0.103) | 0.086 (0.186) | 0.128 (0.224) | 0.013 (0.025) | 0.017 (0.026) | 0.024 (0.031) |
| *Statistically significant difference between stroke patients and healthy subjects groups (p < 0.05). | ||||||
| †Statistically significant difference between male and female sex groups (p < 0.05). | ||||||
| NeuroFlexor neural component (NC), elastic component (EC), viscous component (VC) and total resistance (in Newton, N), and amplitude of electromyography signal (in mV) in stroke patients (N = 15, n = 11 male and n = 4 female) and sub-group of healthy subjects (n = 18, n = 13 male and n = 5 female). | ||||||
| IQR: interquartile range. | ||||||
The NeuroFlexor resistance profiles increased with increasing velocity of muscle stretch, especially for the initial peak both in stroke patients and healthy subjects, as shown in Fig. 1.
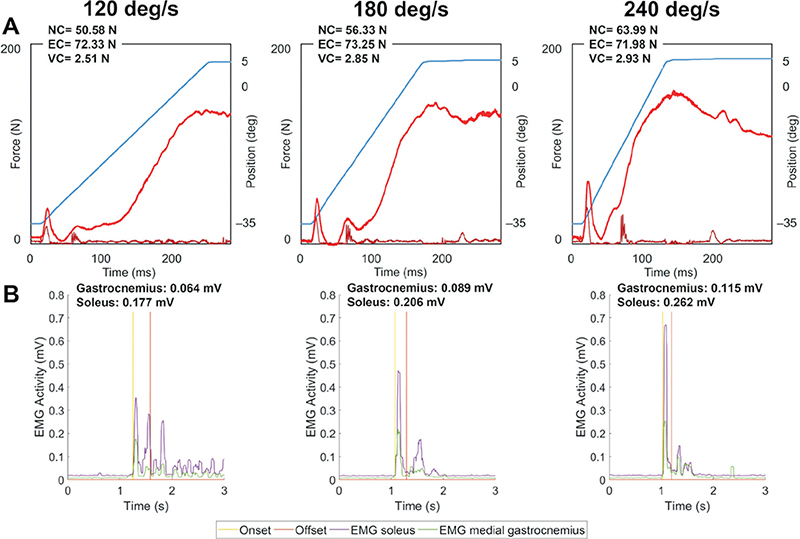
Fig. 1. Velocity dependent response of NeuroFlexor neural component and of electromyography activity. (A) Example resistance profiles (in Newton, N) at 3 different velocities of muscle stretch (120, 180 and 240°/s) in a stroke patient. Blue lines show the angle of ankle movement and red lines show resisting force. The first force peak occurring at about 35 ms after movement onset is composed of inertia and viscosity forces. The later force peak at the end of the movement consists of late viscosity (VC), elasticity (EC) and end-range stiffness, and the neural component (NC) elicited by the stretch reflex. (B) Electromyography (EMG) signal (in mV) of gastrocnemius and soleus muscles recorded synchronized with the NeuroFlexor assessment. An increased NC across velocities, in agreement with Lance’s definition of spasticity, was accompanied by increased EMG amplitudes (i.e. higher bursts in EMG signals).
In stroke patients, rm-ANOVA with a Greenhouse-Geisser correction demonstrated that mean NC differed significantly between velocities (F(1.3,17.3) = 7.82, p = 0.008). Post hoc tests using the Bonferroni correction revealed that NC at 240°/s was significantly higher compared with NC at 120 and 180°/s (p = 0.019 and p = 0.022, respectively). However, NC increase from 120°/s to 180°/s was not statistically significant (p = 0.204). Similarly, EMG signals of calf muscles recorded during NeuroFlexor assessment were also velocity dependent in the stroke patients (F(1.3,18.3) = 30.11, p < 0.001 for gastrocnemius muscle and F(2,28) = 45.71, p < 0.001 for soleus muscle), as shown in Fig. 1. The EMG amplitude of both muscles increased significantly across all velocities (p < 0.022).
Finally, a Friedman test, performed to verify the results obtained from the parametric analysis with log transformed data, confirmed the significant difference in stroke patients’ NC depending on stretch velocities, χ2(2) = 12.00, p = 0.002. Dunn-Bonferroni post hoc tests were carried out and there were significant differences between NC at 120°/s and NC at 240°/s (p = 0.002) after Bonferroni adjustments.
In healthy subjects, NC differed significantly across all velocities (p < 0.035), and the EMG amplitude of gastrocnemius muscle was significantly higher at 240°/s compared with 120°/s (p = 0.024).
Validity of the NeuroFlexor foot module: correlation between neural component and electromyography response
In stroke patients, NC correlated positively with the EMG amplitude of the soleus muscle at the 3 different velocities of muscle stretch: rs = 0.82, p < 0.001 at 120°/s; rs = 0.76, p < 0.001 at 180°/s and rs = 0.76, p < 0.001 at 240°/s, and with the gastrocnemius signal at 120°/s (rs = 0.70, p = 0.005). No EMG responses were visually detected during passive stretches at 5°/s.
In addition, there was a strong positive correlation between the clinically scored muscle tone according to MAS in the gastrocnemius muscle (mean 2.47 (SD 0.92), min 1 – max 4) and soleus muscle (2.47 (0 .99), 1 – 4) and NC at 240°/s (rs = 0.58, p = 0.022 and rs = 0.64, p = 0.010, respectively). EC correlated negatively with MAS in gastrocnemius muscle (rs = – 0.53, p = 0.041). Total resistance did not correlate significantly with MAS, but high values of total resistance were measured in patients with high MAS scores.
Intra-rater reliability of the NeuroFlexor foot module
A 2-way random effects model single measure indicated a high intra-rater reliability for NC: ICC2,1 = 0.903, 95% CI 0.71 – 0.97; a good reliability for EC: ICC2,1 = 0.898, 95% CI 0.69 – 0.97; and a poor reliability for VC: ICC2,1 = 0.61, 95% CI 0.05 – 0.87.
The test-retest repeatability coefficients were 32.84 for NC, 46.19 for EC and 5.08 for VC.
There was no significant difference for NC and EC between sessions (p = 0.54 and p = 0.14, respectively). However, VC differed slightly between sessions (p = 0.02). The difference in NC and VC between the second and the first sessions did not correlate significantly with the values of NC and VC measured during the first test. However, variation in EC between measurements was higher in patients with low EC values at first test (rs = –0.69, p = 0.014), perhaps reflecting a response to repetitive stretch.
Cut-off values of NeuroFlexor components
The cut-off values established for the NeuroFlexor components after excluding outliers (n = 5 and n = 6 for 30 and 40° stretch, respectively) and by adding 3 SD to the mean, are reported in Table III. According to the EC limit of 99.98 N, only 1 patient presented pathological elasticity.
For a total range of ankle movement of 40°, a limit of 0.059 mV for gastrocnemius muscle (according to mean + 3 SD in healthy subjects) and a limit of 0.1044 mV for soleus muscle were identified to discriminate between pathological and non-pathological stretch-induced EMG amplitude. A cut-off value of 31.46 N was established for NC. Six out of 10 stroke patients presented pathological NC above this cut-off limit and also had abnormal EMG amplitude recorded from the gastrocnemius and/or soleus muscle, as shown in Fig. 2, according to ROC analysis (AUC = 1.00, sensitivity = 100%, specificity = 100%).
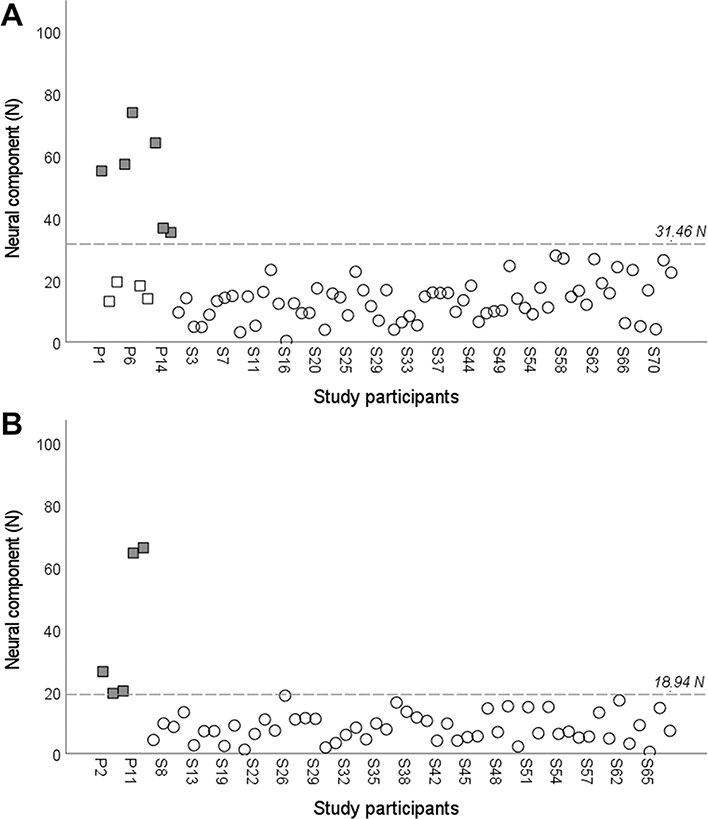
Fig. 2. Scatterplot of the NeuroFlexor neural component. Values of neural component (NC) in Newton (N) in stroke patients (squares) and healthy subjects (circles), after removing outliers, for a total range of ankle dorsiflexion of (A) 40° and (B) 30°. Dashed line indicates the cut-off values established according to the receiver operating characteristic (ROC) curve analyses. Solid squares represent patients with pathological electromyography amplitude (beyond the mean + 3 standard deviations (SD) limit defined for gastrocnemius and soleus muscles in the healthy subjects).
In addition, for a total range of ankle movement of 30°, a limit of normality of 0.0197 mV for gastrocnemius muscle and a limit of 0.0271 mV for soleus muscle were identified. A normative data cut-off value of 18.94 N was established for detection of pathological NC. All the 5 stroke patients tested with 30° stretch presented abnormal EMG amplitude recorded from the gastrocnemius and soleus muscle, and NC above the cut-off value. Again this showed complete correspondence between pathological NC and EMG activity according to ROC analysis (AUC = 1.00, sensitivity = 100%, specificity = 100%).
DISCUSSION
This study evaluated the novel NeuroFlexor foot module and provided evidence of validity, reliability and potential clinical utility of this biomechanical method for the objective measurement of spasticity and of viscous-elastic components of passive resistance in the lower limb.
Validity of the NeuroFlexor foot module
The NeuroFlexor neural component increased at augmenting velocity of the passive muscle stretch, in accordance with the velocity-dependent response of the stretch-induced electromyography activity of medial gastrocnemius and soleus muscles. The NC thus reflected the stretch-reflex-mediated resistance during passive muscle stretch, in agreement with Lance’s definition of spasticity (7). The validity of the model was further supported by the strong correlation between NC and the electromyography amplitude at the different velocities of muscle stretch. In addition, NC correlated strongly with the clinically scored muscle tone according to MAS. Notably, this strong positive relation between NC and the clinical score is in line with previous findings in the upper extremity (28, 32) and with the characteristic of MAS to be more suitable in a later phase after stroke, which is in agreement with the time since onset (mean 29.13 months after onset (SD 28.64)) of the current cohort of patients. Taken together, these findings provide evidence supporting the validity of the NeuroFlexor neural component.
Regarding the NeuroFlexor passive components reflecting changes in mechanical properties, elasticity represented the major contributor to the resistance to the passive movement, both in stroke patients and in healthy subjects, probably due to the postural role of calf muscles and thus their great muscle mass. This is also supported by the finding that EC strongly correlated with the calf area measured in all participants. EC also correlated with the MAS score in the gastrocnemius muscle, confirming the limitation of this clinical scale in discriminating between active and passive components of muscle tone, as described previously in the upper limb (31). In general, stroke patients presented higher values of EC compared with healthy subjects and thus a greater passive muscle stiffness, as discussed previously (36). Furthermore, Table II shows the velocity dependence of VC, while EC, which is length dependent, remained almost stable across velocities in accordance with the expectation and consistent with the biomechanical model of the NeuroFlexor hand module, based on Koo and Mak’s model (37) and previously described by Lindberg et al. (28).
Intra-rater reliability of the NeuroFlexor foot module
The current findings provided evidence of high test-retest reliability of NC, good reliability of EC and poor reliability of VC. Unfortunately, the number of stroke patients properly evaluated with the NeuroFlexor foot module was low, and therefore further studies with a higher number of participants are needed to confirm the good intra-rater reliability of the method. The relatively high repeatability coefficients can be also explained by the low number of patients included as well as by the heterogeneity of the study population. Further evidence of reliability is required to support the application of the NeuroFlexor foot module in clinical practice at the individual level, to evaluate, for example, post-treatment outcome after injection of botulinum toxin in patients with clinical signs of spasticity.
Clinical implications
There are challenges in developing methods to objectively and simply quantify the degree of spasticity in the lower limb (38, 39). Different electrophysiological and biomechanical techniques have been developed in recent years to complement clinical scales in order to enhance measurement accuracy of muscle resistance assessments both in clinics and research (40, 41). The technologies described in these reviews, proved sensitive and reliable; however, they are technically demanding and time-consuming, making them difficult to implement for routine clinical use. To our knowledge, the NeuroFlexor foot module is one of the first EMG-free instruments to objectively quantify lower limb spasticity and thus holds great potential for future applications in clinical practice. A recent comparison between the NeuroFlexor and an experimental EMG-based device (31) has, in fact, shown the comparableness of the 2 methods in quantifying the neural and non-neural components of resistance to passive stretch in patients with chronic stroke, and no clear added value of EMG. Nevertheless, all NeuroFlexor components are sensitive to measurement errors, and care is needed to standardize the position of the subject to ensure similar biomechanical contributions at each assessment. In order to obtain reliable data, it is necessary to position the foot correctly with its centre of the mass above the NeuroFlexor force sensors, and to properly align the ankle joint with the axis of rotation of the apparatus. Even the angle of the knee joint and the patient’s position may induce errors and thus affect the results. As a biarticular muscle, the fascicle length of medial gastrocnemius muscle both increases with the dorsiflexion of ankle and decreases with the flexion of knee, and thus may influence the elastic contributor to the resistance.
Cut-off values of NeuroFlexor components
Two different methods were applied in order to obtain cut-off values for neural, elastic and viscous components. The mean + 3 SD approach was found to be more conservative, particularly for EC in case of 40° of passive movement, and therefore it may be not suitable in clinical practice. Only 1 stroke patient actually presented pathological EC, equal to 106.43 N. Clinically, he/she had a mildly limited range of ankle joint (5° of passive dorsiflexion with knee fully extended and 10° of passive dorsiflexion with knee flexed to 90°) and a MAS score of 2 in the assessment of gastrocnemius and soleus muscles. Significantly, all the patients included in the study were able to walk, at least short distances, with or without assistive mobility aids, which might explain the general low values of elasticity.
The second approach applied ROC curve analysis by discriminating between pathological and non-pathological EMG amplitude, and thus may be considered more consistent. Indeed, all the stroke patients with EMG amplitude above the pathological limits for gastrocnemius and/or soleus muscles (6 patients tested with 40° stretch and 5 with 30° stretch), were found to have NC above the cut-off. Whilst NC was well validated using EMG data, no further validation of the NeuroFlexor passive components and, in particular, of EC, was possible, and this validation should be considered in future studies. In addition, the biomechanical algorithm applied to the foot module might not be sufficiently accurate in case of severe resistance to passive movement after stroke (due to both hyperexcitability of the stretch reflex, soft tissue changes and critical contractures), and would need to be optimized for that application.
Study limitations and future directions
The low number of chronic stroke patients represents a main limitation of this study. Moreover, it is important to note the greater proportion of females compared with males in the group of healthy subjects. Since EC was significantly lower in female subjects across passive stretch velocities, future studies should also consider a more homogeneous sex ratio to obtain more accurate cut-off values.
An inhibition of stretch reflexes with local nerve block would have been a valuable addition in the validity of the NeuroFlexor foot module. An examination of changes in NC and EMG amplitude, as well as an independence of the mechanical components before and after a local nerve block achieved by intraneural injection of anaesthetics to the posterior tibial nerve might be worth further investigation. Finally, future research could describe the relative contributors to the passive movement resistance produced by the NeuroFlexor in patients with spastic co-contraction and spastic dystonia (42).
CONCLUSION
Increased muscle tone commonly occurs after injury to the central nervous system and may present as spasticity and/or contracture in the involved joints. An accurate diagnosis is essential in clinical practice to design and evaluate specific treatment approaches.
This study found preliminary evidence to support validity and reliability of the novel NeuroFlexor foot module for quantification of the neural spasticity and mechanical components of lower limb hyper-resistance after stroke. The NeuroFlexor foot module may offer an easy and non-invasive way to objectively assess spasticity without additional electrophysiological recording.
ACKNOWLEDGEMENTS
The authors thank the staff of the Department of Rehabilitation Medicine, Danderyd Hospital in Stockholm, Sweden for invaluable assistance during data collection, and the patients and healthy subjects who participated in this study.
This work was supported by grants from NeuroFör-bundet (study number B4014, year 2019), STROKE-Riksförbundet (year 2016 and year 2019) and the Promobilia Foundation (year 2015).
REFERENCES
- Wissel J, Manack A, Brainin M. Toward an epidemiology of poststroke spasticity. Neurology 2013; 80: S13–S19.
- Francisco GE, McGuire JR. Poststroke spasticity management. Stroke 2012; 43: 3132–3136.
- Zeng H, Chen J, Guo Y, Tan S. Prevalence and risk factors for spasticity after stroke: a systematic review and meta-analysis. Front Neurol 2021; 11: 616097.
- Sommerfeld DK, Eek EU, Svensson AK, Holmqvist LW, von Arbin MH. Spasticity after stroke: its occurrence and association with motor impairments and activity limitations. Stroke 2004; 35: 134–139.
- Arene N, Hidler J. Understanding motor impairment in the paretic lower limb after a stroke: a review of the literature. Top Stroke Rehabil 2009; 16: 346–356.
- Jansen K, De Groote F, Aerts W, De Schutter J, Duysens J, Jonkers I. Altering length and velocity feedback during a neuro-musculoskeletal simulation of normal gait contributes to hemiparetic gait characteristics. J Neuroeng Rehabil 2014; 11: 78.
- Lance JW. Symposium synopsis. In: Feldman RG, Young RR, Koella WP, editors. Spasticity, disordered motor control. Chicago: Year Book Medical Publishers; 1980, p. 485–494.
- Ashworth B. Preliminary trial of carisoprodol in multiple sclerosis. Practitioner 1964; 192: 540–542.
- Patrick E, Ada L. The Tardieu Scale differentiates contracture from spasticity whereas the Ashworth Scale is confounded by it. Clin Rehabil 2006; 20: 173–182.
- Bohannon RW, Smith MB. Interrater reliability of a modified Ashworth scale of muscle spasticity. Phys Ther 1987; 67: 206–207.
- Harb A, Kishner S. Modified Ashworth Scale. StatPearls. Treasure Island (FL): StatPearls Publishing; 2020.
- Fleuren JF, Voerman GE, Erren-Wolters CV, Snoek GJ, Rietman JS, Hermens HJ, et al. Stop using the Ashworth Scale for the assessment of spasticity. J Neurol Neurosurg Psychiatry 2010; 81: 46–52.
- Ansari NN, Naghdi S, Hasson S, Rastgoo M, Amini M, Forogh B. Clinical assessment of ankle plantarflexor spasticity in adult patients after stroke: inter-and intra-rater reliability of the Modified Tardieu Scale. Brain Inj 2013; 27: 605–612.
- Li F, Wu Y, Li X. Test-retest reliability and inter-rater reliability of the Modified Tardieu Scale and the Modified Ashworth Scale in hemiplegic patients with stroke. Eur J Phys Rehabil Med 2014; 50: 9–15.
- Meseguer-Henarejos AB, Sánchez-Meca J, López-Pina JA, Carles-Hernández R. Inter- and intra-rater reliability of the Modified Ashworth Scale: a systematic review and meta-analysis. Eur J Phys Rehabil Med 2018; 54: 576–590.
- Gracies JM. Pathophysiology of spastic paresis. I: Paresis and soft tissue changes. Muscle Nerve 2005; 31: 535–551.
- Thibaut A, Chatelle C, Ziegler E, Bruno MA, Laureys S, Gosseries O. Spasticity after stroke: physiology, assessment and treatment. Brain Inj 2013; 27: 1093–1105.
- Bethoux F. Spasticity management after stroke. Phys Med Rehabil Clin N Am 2015; 26: 625–639.
- Wissel J, Verrier M, Simpson DM, Charles D, Guinto P, Papapetropoulos S, et al. Post-stroke spasticity: predictors of early development and considerations for therapeutic intervention. PM R 2015; 7: 60–67.
- Tao W, Yan D, Li JH, Shi ZH. Gait improvement by low-dose botulinum toxin A injection treatment of the lower limbs in subacute stroke patients. J Phys Ther Sci 2015; 27: 759–762.
- Dong Y, Wu T, Hu X, Wang T. Efficacy and safety of botulinum toxin type A for upper limb spasticity after stroke or traumatic brain injury: a systematic review with meta-analysis and trial sequential analysis. Eur J Phys Rehabil Med 2017; 53: 256–267.
- Santamato A, Cinone N, Panza F, Letizia S, Santoro L, Lozupone M, et al. Botulinum toxin type A for the treatment of lower limb spasticity after stroke. Drugs 2019; 79: 143–160.
- Mahmood A, Veluswamy SK, Hombali A, Mullick A, N M, Solomon JM. Effect of transcutaneous electrical nerve stimulation on spasticity in adults with stroke: a systematic review and meta-analysis. Arch Phys Med Rehabil 2019; 100: 751–768.
- Palmcrantz S, Pennati GV, Bergling H, Borg J. Feasibility and potential effects of using the electro-dress Mollii on spasticity and functioning in chronic stroke. J Neuroeng Rehabil 2020; 17: 109.
- Han P, Zhang W, Kang L, Ma Y, Fu L, Jia L, et al. Clinical evidence of exercise benefits for stroke. Adv Exp Med Biol 2017; 1000: 131–151.
- Bani-Ahmed A. The evidence for prolonged muscle stretching in ankle joint management in upper motor neuron lesions: considerations for rehabilitation – a systematic review. Top Stroke Rehabil 2019; 26: 153–161.
- Luo Z, Lo WLA, Bian R, Wong S, Li L. Advanced quantitative estimation methods for spasticity: a literature review. J Int Med Res 2020; 48: 300060519888425.
- Lindberg PG, Gaverth J, Islam M, Fagergren A, Borg J, Forssberg H. Validation of a new biomechanical model to measure muscle tone in spastic muscles. Neurorehabil Neural Repair 2011; 25: 617–625.
- Gäverth J, Sandgren M, Lindberg PG, Forssberg H, Eliasson AC. Test-retest and inter-rater reliability of a method to measure wrist and finger spasticity. J Rehabil Med 2013; 45: 630–636.
- Gaverth J, Eliasson AC, Kullander K, Borg J, Lindberg PG, Forssberg H. Sensitivity of the NeuroFlexor method to measure change in spasticity after treatment with botulinum toxin A in wrist and finger muscles. J Rehabil Med 2014; 46: 629–634.
- Andringa A, van Wegen E, van de Port I, Kwakkel G, Meskers C. Measurement properties of the NeuroFlexor device for quantifying neural and non-neural components of wrist hyper-resistance in chronic stroke. Front Neurol 2019; 10: 730.
- Pennati GV, Plantin J, Borg J, Lindberg PG. Normative NeuroFlexor data for detection of spasticity after stroke: a cross-sectional study. J Neuroeng Rehabil 2016; 13: 30.
- Pennati GV, Bergling H, Carment L, Borg J, Lindberg PG, Palmcrantz S. Effects of 60 min electrostimulation with the EXOPULSE mollii suit on objective signs of spasticity. Front Neurol 2021; 12: 1741.
- Currier DP. Elements of research in physical therapy. 3rd edn. Baltimore: Williams & Wilkins; 1990.
- Vaz S, Falkmer T, Passmore AE, Parsons R, Andreou P. The case for using the repeatability coefficient when calculating test-retest reliability. PLoS One 2013; 8: e73990.
- Le Sant G, Nordez A, Hug F, Andrade R, Lecharte T, McNair PJ, et al. Effects of stroke injury on the shear modulus of the lower leg muscle during passive dorsiflexion. J Appl Physiol (1985) 2019; 126: 11–22.
- Koo TK, Mak AF. A neuromusculoskeletal model to simulate the constant angular velocity elbow extension test of spasticity. Med Eng Phys 2006; 28: 60–69.
- Burridge JH, Wood DE, Hermens HJ, Voerman GE, Johnson GR, Wijck FV, et al. Theoretical and methodological considerations in the measurement of spasticity. Disabil Rehabil 2005; 27: 69–80.
- Aloraini SM, Gäverth J, Yeung E, MacKay-Lyons M. Assessment of spasticity after stroke using clinical measures: a systematic review. Disabil Rehabil 2015; 37: 2313–2323.
- Wood DE, Burridge JH, van Wijck FM, McFadden C, Hitchcock RA, Pandyan AD, et al. Biomechanical approaches applied to the lower and upper limb for the measurement of spasticity: a systematic review of the literature. Disabil Rehabil 2005; 27: 19–32.
- Cha Y, Arami A. Quantitative modeling of spasticity for clinical assessment, treatment and rehabilitation. Sensors 2020; 20: 5046.
- Baude M, Nielsen JB, Gracies JM. The neurophysiology of deforming spastic paresis: a revised taxonomy. Ann Phys Rehabil Med 2019; 62: 426–430.