ORIGINAL REPORT
PREDICTING RETURN TO WORK AFTER CARDIAC REHABILITATION USING MACHINE LEARNING MODELS
Choo JIA YUAN, Master of Data Science1, Kasturi Dewi VARATHAN, PhD1, Anwar SUHAIMI, M.B.B.S., MRehabMed (Malaya)2 and Lee WAN LING, PhD3
From the 1Department of Information Systems, Faculty of Computer Science & Information Technology, Universiti Malaya, Kuala Lumpur, Malaysia, 2Department of Rehabilitation Medicine, Faculty of Medicine, Universiti Malaya, Kuala Lumpur, Malaysia and 3Department of Nursing Science, Faculty of Medicine, Universiti Malaya, Kuala Lumpur, Malaysia
Objective: To explore machine learning models for predicting return to work after cardiac rehabilitation.
Subjects: Patients who were admitted to the University of Malaya Medical Centre due to cardiac events.
Methods: Eight different machine learning models were evaluated. The models included 3 different sets of features: full features; significant features from multiple logistic regression; and features selected from recursive feature extraction technique. The performance of the prediction models with each set of features was compared.
Results: The AdaBoost model with the top 20 features obtained the highest performance score of 92.4% (area under the curve; AUC) compared with other prediction models.
Conclusion: The findings showed the potential of using machine learning models to predict return to work after cardiac rehabilitation.
LAY ABSTRACT
Cardiac rehabilitation has proven beneficial effects for cardiac patients; it lowers patients’ risk of cardiac death and improves their health-related quality of life. Returning to work is one of the important goals of cardiac rehabilitation, as it prevents early retirement, and encourages social and financial sustainability. A few studies have focussed on predicting return to work among cardiac rehabilitation patients; however, these studies have only used statistical techniques in their prediction. This study showed the potential of using machine learning models to predict return to work after cardiac rehabilitation.
Key words: cardiac rehabilitation; machine learning; return to work; feature selection.
Citation: J Rehabil Med 2023; 55: jrm00348. DOI: https://dx.doi.org/10.2340/jrm.v55.2432
Copyright: © Published by Medical Journals Sweden, on behalf of the Foundation for Rehabilitation Information. This is an Open Access article distributed under the terms of the Creative Commons Attribution-NonCommercial 4.0 International License (https://creativecommons.org/licenses/by-nc/4.0/)
Accepted: Oct 2, 2022; Published: Jan 9, 2023
Correspondence address: Kasturi Dewi Varathan, Department of Information Systems, Faculty of Computer Science & Information Technology, Universiti Malaya, Kuala Lumpur 50603, Malaysia. E-mail: kasturi@um.edu.my
Correspondence address for medical related questions: Anwar Suhaimi, Department of Rehabilitation Medicine, Faculty of Medicine, Universiti Malaya, Kuala Lumpur 50603, Malaysia. E-mail: anwars@um.edu.my
Competing interests and funding: The authors have no conflicts of interest to declare.
Heart disease is a leading cause of death worldwide. According to the American Heart Association, by the year 2030, cardiovascular disease (CVD) is expected to affect almost 23.6 million people in the USA (1). With this significant increase, cardiac rehabilitation (CR) should be given high priority in the near future. Empirical evidence regarding CR has shown a reduction in total mortality by 13–24% in the 1–3 years after a coronary event. In addition, CR also reduces re-admission rates by 31% in the following year (2). In 2016 Malaysia, 23.2% of patients with acute coronary syndrome (ACS) were less than 50 years old (3). These patients still need to return to work (RTW) for some years before they can retire. Being able to RTW has an huge impact economically. In Europe, heart patients are opting for early retirement, accounting for most of the estimated loss in productivity (4). Based on reports of loss of productivity due to sick leave, not working at full capacity because of cardiovascular disease results in the loss of RM 2.7 billion to Malaysia’s economy (18). In Mexico, cardiac-related diseases are estimated to cost 416 billion USD loss of income to individuals.
Besides productivity, individuals who RTW after CR have better health-related quality of life (HRQoL) scores (4, 5). RTW also helps by lowering their depression and anxiety scores (4, 6). Cardiac patients who are able to resume work demonstrate fewer symptoms of anxiety or depression, while those who are not able to RTW see a continuously increasing depression score (4). Several studies claim that work effort may improve physical condition (7). Warraich et al. (6) found that unemployment could cause financial hardship and, in turn, may worsen the medical outcomes of the patients in the long term. Thus, RTW is an important indicator of recovery after cardiac events (4).
The aim of this study was to elucidate the factors that contribute to RTW after CR in Malaysia, as a model of a developing country. This information will enable individualization of CR programmes, with the aim of maximizing each patient’s chance of RTW. With this aim, a model was built to predict which patients are likely to successfully RTW after CR. The significant factors that contribute to RTW were identified, and recommendations made regarding the most suitable prediction model based on machine learning for use in predicting RTW.
BACKGROUND
Prediction of RTW is an important aspect of CR, but, to the best of our knowledge, there only 7 studies have been published on this topic (Table I) . Of these, only 1 study further evaluated the prediction performance using the significant predictors: Mustafah et al. (8) used receiver operating characteristic (ROC) curves to evaluate the performance of the model. The area under the ROC curve of their model was 83.1%, with 88.6% sensitivity and 40.0% specificity. The dataset with the highest sample size used in predicting RTW after CR is obtained from 12 rehabilitation centres in Germany. A summary of the techniques, evaluation methods and dataset details used in each study literature is shown in Table I.
The features used in predicting RTW after CR are shown in Table II. A total of 25 features have been explored in previous studies. (8–14) Age and cardiac diagnosis were the most commonly used features for predicting RTW. Salzwedel et al. (9) used the highest number of features in their prediction model.
METHODS
The study methodology is shown in Fig. 1.
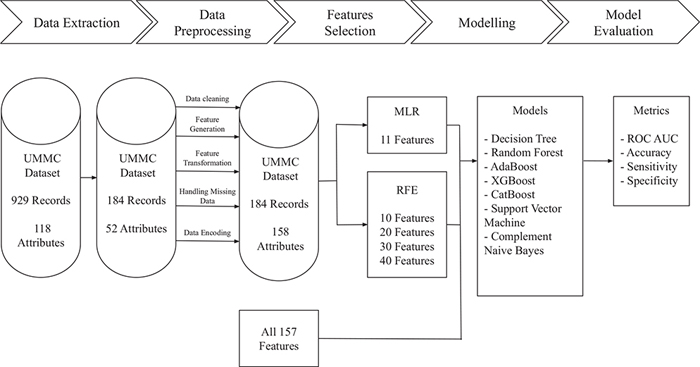
Fig. 1. Research methodology. UMMC: University of Malaya Medical Centre; RFE: recursive feature elimination; ROC: receiver operating characteristic; AUC: area under the curve; MLR: multiple logistic regression.
Dataset
The dataset used in this study was obtained from the Department of Rehabilitation Medicine, University of Malaya Medical Centre (UMMC), Petaling Jaya, Selangor, Malaysia. Data were collected from 2015 to 2019 and consist of 118 variables with a total 929 of samples. The samples are patients admitted to the UMMC due to a cardiac events (e.g., myocardial infarction, coronary artery disease). The data also consist of pre-CR, stage II CR and stage III CR. Pre-CR, also known as cardiac rehabilitation programme (CRP) phase 1 is delivered as an inpatient service following medical stabilization of patients with acute coronary syndrome. This phase focuses primarily on early mobilization, safe return to daily activities, discharge planning to ensure safe return home, early management of cardiovascular risk factors and complications arising from the acute cardiac diagnosis. CRP phase 2 occurs in the immediate outpatient setting, usually within 2 weeks to 3 months post-discharge. It consists of physical activity and exercise prescription following medical assessment and exercise stress testing, individualized cardiac risk factor and lifestyle management with an emphasis on improving function. CRP phase 3 is a community-based programme focusing on compliance with heart healthy behaviour, accessing community resources to manage and maintain optimal cardiac health and function.
The data consist of patients’ data from a range of aspects: socio-demographic variables (e.g. age, sex, race, educational level, patient occupation, etc.), medical history-related variables (e.g. admission diagnosis, cardiac risk factors, significant past cardiovascular history, etc.), mental health variables (e.g. anxiety score and depression score), physical status variables (peak heart rate, heart rate recovery, peak metabolic equivalent of task (METs), exercise frequency, etc.) and indicator of recovery variables (e.g. RTW and return to driving). Table III shows the frequency distribution of each class label: RTW and not RTW. See Appendix S1 for a list of abbreviations and Appendix S2 for a full list of variable descriptions.
| Class label | ||
| RTW | Not RTW | |
| Frequency | 124 | 60 |
| RTW: return to work. | ||
Ethical considerations
Consent. The data collected for analysis were sourced from a patient registry of CRP participants. Ethics approval for this study was given by the UM Medical Centre Medical Ethics Committee (MECID: 202039-8367).
Privacy and confidentiality. Patient’s personal details (national identification card number, and hospital registration number) were not extracted to the data sheet, but were replaced by a research identification number. Each patient was assigned a subject identification number specific to this study. The study data will be archived and kept for a total of 7 years from completion of the study, after which it will be destroyed.
Risk to participants. There was no risk to participants as the study did not involve any interventions. Medical data collected for the study were routine documentation obtained during CRP extracted from the patients’ medical records.
Benefit to participants. There was a possible benefit to participants of improved morale due to participation in scientific research that aims to help other cardiac patients return to gainful employment locally and globally.
Risk and benefit assessment. There was no direct risk to the patients; the CRP data collected for the registry was part of a service audit and quality maintenance programme.
Data extraction
Patients’ data were extracted based on the study criteria. Inclusion criteria were: patients who were at least 18 years old who were employed prior to having a cardiac event. Exclusion criteria were: patients who were pensioners or unemployed.
Based on a previous study, the probability that pensioners and unemployed patients’ RTW is very low (8). This is reflected in the dataset of current study, as none of these patients actually RTW. The data extraction process is shown in Fig. 2.
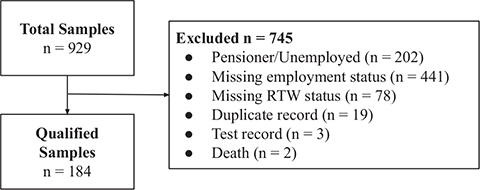
Fig. 2. Flowchart of study inclusion process. RTW: return to work.
Variables with more than 50% of missing data were excluded from the dataset. The focus of this study is on RTW after completion of the stage 2 CR programme, thus all the variables related to the stage 3 CR programme were discarded. The stage 2 CR programme focuses on the immediate goal attainment of enhancing aerobic capacity that was affected by cardiac disease and translating this into higher functional level, such as participation in employment. The pre-CR phase occurs during acute admission while the patient is relatively unstable and unlikely to engage in highly demanding functional tasks such as returning to work, while in CR programme phase 3 the patient is referring to out patients who usually already participating in gainful employment or needs assistance to obtain a work placement. Thus, CR Programme Phase 2 provides the data that will be most predictive of eventual RTW status. A total of 52 variables were included in the final dataset. The list of variables are shown in Appendix S3.
Data pre-processing
The data were pre-processed in order to fit into the machine learning models. Fig. 3 shows the processes involved in data pre-processing. Processed data were saved as a UMMC cleaned dataset. Appendix S4 shows the list of generated features.
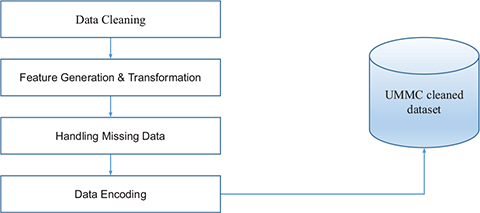
Fig. 3. Processes involved in data pre-processing. UMMC: University of Malaya Medical Centre.
Features selection
Statistical tools have been used widely in previous studies to determine the predictors of RTW (10–14). Feature selection methods such as wrapper and embedded methods can be used to predict RTW. These methods have shown to have good performance compared with statistical methods (15). In order to obtain a good comparison, both methods were used in this study, in order to evaluate the performance of the prediction with the features selected using statistical tools and with feature selection methods. Wrapper and embedded methods were used to perform the feature selection. The algorithm steps were:
- Train the model with all features and evaluate its performance.
- Obtain the importance score.
- Remove the least important feature.
- Retrain the model and evaluate the performance of the model.
- If the performance score is higher than in step 1, then the feature in step 3 can be removed.
- Repeat steps 3 to 5 until all features are evaluated.
The numbers of features selected that were evaluated were 10, 20, 30 and 40. In order to select the best models, multiple models were used, and their performance compared.
Modelling
In order to compare the prediction performance with published results, a statistical of the models was used. Logistic regression has been used in multiple studies (8, 11, 12, 14) to identify the predictors of RTW; thus logistic regression was used as the baseline model in the current study.
Seven supervised machine learning models were included in this study: Decision Tree, Random Forest, AdaBoost, XGBoost, CatBoost, Support Vector Machine, and Complement Naive Bayes. Together with the statistical model, all 8 models were first trained with all features, then with significant features from the multiple logistic regression model, and, lastly, with the features selected using recursive feature elimination (RFE).
Evaluation of models
The dataset used in this study is imbalanced, thus a cross-validation method alone is insufficient. As the samples are randomly assigned into each fold, there is a possibility that the minority class will be totally missing from 1 or more of the folds (16). When these folds are used as the validation set, the model will return undefined sensitivity or specificity depending on whether the positive or negative class is missing. To overcome this limitation, stratification is suggested to ensure the distribution of each class is represented in each fold. The data were stratified into 10 folds in order to gain a better view of the performance of each model (17). The negative class is equally as important as the positive class, since, by identifying patients who are unlikely to RTW, planning and management can be carried out to help patients RTW. Thus, the ROC AUC will be more appropriate to evaluate the performance of the models, as this single score will consider the performance of both classes by using sensitivity and specificity. Accuracy, sensitivity and specificity will be used as reference measures. The formulas for each of these metrics are:



RESULTS
Features selected by multiple logistic regression analysis
Multiple logistic regression revealed 11 features with significant odd ratios (Fig. 4). Returning to driving was the strongest predictor for RTW; patients who resumed driving after the CR programme were 20.5 times more likely to RTW compared with patients who did not return to driving. Patients with low American Association of Cardiovascular and Pulmonary Rehabilitation (AACVPR) risk stratification and very low rate of perceived exertion when attaining peak heart rate during the pre-CR exercise stress test were more likely to RTW easily.
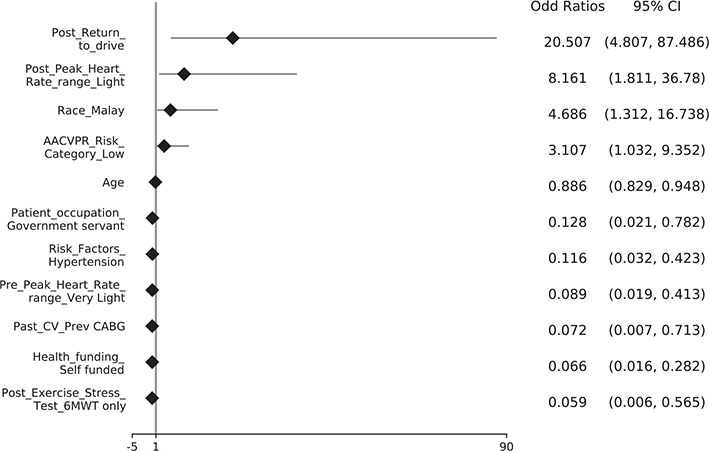
Fig. 4. Odd ratios plot of significant features for return to work (RTW). AACVPR: American Association of Cardiovascular and Pulmonary Rehabilitation; Past_CV_Prev_CABG: Past cardiovascular history- previous Coronary Artery Bypass Grafting; Post_Exercise_Stress_Test_6MWT only: Post exercise stress test-6 minute walk test.
Regarding race, Malay patients were more likely to RTW. The mean showed an odd ratio < 0; thus, with increasing age it is unlikely that patients will return to work compared to younger patients. A similar scenario occurs among self-funded patients, whereby they have a 93% lower likelihood of RTW compared to otherwise. Medical history, such as hypertension and previous coronary artery bypass grafting (CABG), were negative predictors of RTW. A low range of peak heart rate during post-CR as also associated with a low odds ratio. Furthermore, if only the 6-min walk test (6MWT) was used as the exercise stress test at the end of the CR, there was a likelihood of not returning to work compared with other features.
Performance prediction
Prediction models with multiple logistic regression, Complement Naive Bayes, Decision Tree, Random Forest, XGBoost, CatBoost, AdaBoost and Support Vector Machine (SVM) were established with 3 different sets of features: all features; 11 significant features (Fig. 4) from multiple logistic regression analysis; and top 10, 20, 30 and 40 features from RFE. Their performance was evaluated using stratified 10-fold cross-validation with ROC AUC as the main metrics, and accuracy, sensitivity and specificity as references. The mean of the metrics in 10-fold cross-validation was calculated.
Performance prediction with all features. Initial models were established with all the features included. The performance of each model is shown in Table IV. The best model was CatBoost, based on the overall performance obtained by using all features in predicting RTW, which yielded a ROC AUC score of 0.857 (accuracy 0.787, sensitivity 0.917, specificity 0.517). This was followed by AdaBoost, XGBoost, Random Forest and SVM.
Performance prediction with features obtained from multiple logistic regression (11 significant features). Table V shows the performance results of each model with significant predictors of multiple logistic regression analysis (11 features). Compared with the full set of features, the performance of each model was significantly improved. The ROC AUC score was improved by as much as 0.252, as shown in the Complement Naive Bayes model. Using this set of features, the ranking of the SVM model moved to the top position from the middle position, with ROC AUC 0.899 (accuracy 0.830, sensitivity 0.910, specificity 0.667). The multiple logistic regression model also showed great improvement, with the same ROC AUC as the SVM. The ranking of other models also changed. AdaBoost model now ranked 3, followed by CatBoost and XGBoost. The highest sensitivity score was 0.910, for the SVM model, which was slightly lower than the highest score when using full features. However the highest specificity score was 0.75, for the Complement Naive Bayes model.
Performance prediction using RFE feature selection method. Starting from this subsection, the models were evaluated using the features selected using the RFE method. The experiment started with the top 10 features (Table VI). The AdaBoost model was the top model with the top 10 features, yielding an ROC AUC and sensitivity scores of 0.913 and 0.911, respectively. On the other hand, the Complement Naive Bayes model had the lowest ROC AUC score (0.463), but the highest specificity score (of 1). Overall, the performance of all the models was reduced, except for the AdaBoost model, which showed improvement on the ROC AUC score compared with performance when using predictors from multiple logistic regression analysis.
The study then selected the top 20 features from RFE. The performance ranking of the models was the same as with the top 10 features, except for XGBoost and CatBoost. Overall, the performance of each model was improved, but Complement Naive Bayes had a slight reduction in ROC AUC. Besides the logistic regression and Complement Naive Bayes models, all the other models had an increase in sensitivity and specificity scores.
When the number of features selected was increased to 30, the ranking of the models was the same as for the top 10 features. With 30 features, AdaBoost, SVM, Logistic Regression and Decision Tree started to show a decrease in ROC AUC score compared with the top 20 features. The highest ROC AUC was 0.9, shown by AdaBoost. Random Forest had the highest sensitivity (0.926) and Complement Naive Bayes had the highest specificity (0.8).
Finally, using the top 40 features, the Random Forest model was ranked fourth and XGBoost fifth. Compared with the top 30 features, the overall performance of AdaBoost, SVM, CatBoost, XGBoost and logistic regression were reduced. However, the Random Forest model showed its highest performance score with top 40 features, with an accuracy of 0.82, ROC AUC 0.874, sensitivity 0.943, and specificity 0.567.
The Adaboost model (with 20 features) achieved the highest performance; 92.4% ROC AUC, 92.8% sensitivity, and 73.3% specificity. AdaBoost with 10 selected features using RFE is the only model that performed better compared with other models using 11 features with multiple logistic regression, as suggested by Mustafah et al. (8). All of the models showed optimal prediction after feature selection. Fig. 5 shows the ROC AUC obtained by each model according to the number of features used.
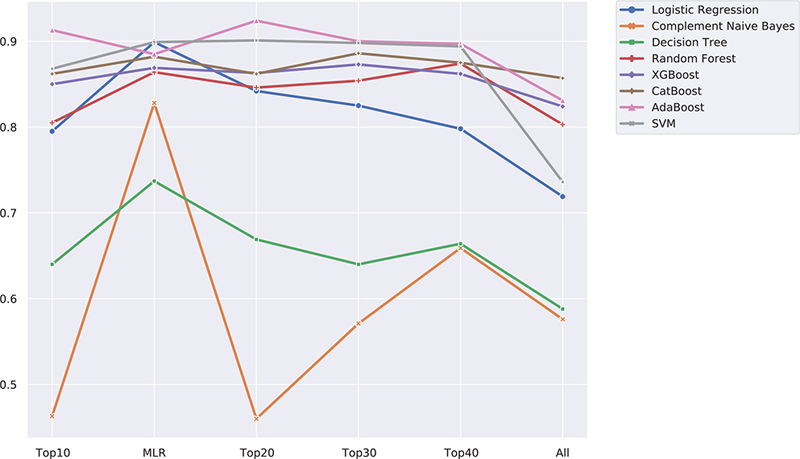
Fig. 5. Receiver operating characteristic (ROC) area under curve (AUC) of each model with the number of features used. MLR: multiple logistic regression.
Feature analysis
Fig. 6 presents the top 20 selected features by RFE using the AdaBoost machine learning model. The 2 most important features identified by AdaBoost were CR duration and age. These 2 features had the top 2 highest scores of importance compared with the other features. The selected features are from demographic, medical history, CR status, pre-CR, during CR and post-CR.
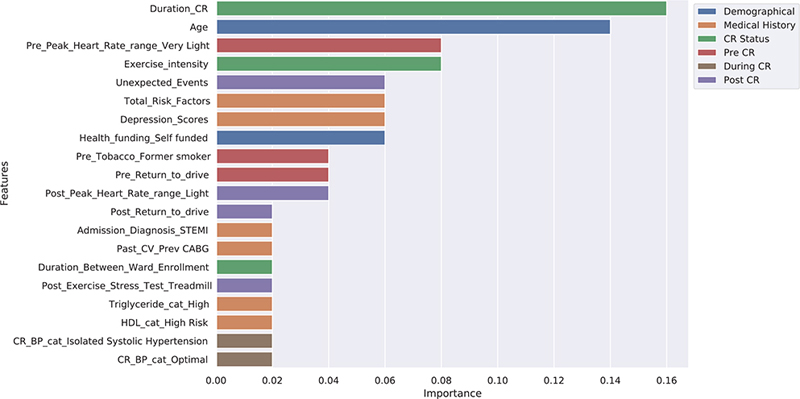
Fig. 6. Features importance obtained from AdaBoost. STEMI: ST-elevation myocardial infarction; Prev_CABG: Previous Cornonary Bypass Grafting; HDL_cat: High-density lipoproterin category; CR_BP_cat: Cardiac rehab blood pressure category.
Demographic features play an important role in predicting RTW. The variable “age” selected by Adaboost is in agreement with published results, and was the second most important feature in this model. This finding was in agreement with other studies (8, 12, 14) that used age as an input variable for the prediction of RTW after CR. Based on the result of the odds ratio, 1 unit increase in age reduced the odds of RTW by 11% per each additional year. The study found that, if a patient self-funded the CR programme, it reduced the chance of RTW after CR. This may be due to financial independence of a patient who does not require to RTW to fulfil their economic needs.
CR status represents the participation of patient during the CR programme. Duration of CR, exercise intensity, and duration between ward and enrolment in the CR programme (Duration_between_Ward_Enrollment) were also selected as important features to predict RTW. CR duration is an important indicator that also shows the commitment of the patients to the CR programme, as many such programmes worldwide fail due to poor commitment from patients. On the other hand, exercise intensity shows how hard the body is working during physical activity. Patients who achieve higher exercise intensity have higher chance of resuming normal life and eventually RTW. Salzwedel et al. (10) used exercise capacity, as well as 1 of their predictors for RTW. The duration between ward and enrolment in the CR programme is important, as it shows the health capability and attitude of the patient to return to their prior level of functioning after myocardial infarction.
A more in-depth examination of the features selected by AdaBoost revealed that 6 out of 20 features were extracted from the patient’s medical history. These medical factors are an influential variable associated with RTW, as also found in other studies (8, 9). The total number of risk factors (including Diabetes Mellitus (DM) type 2, high lipid profile and hypertension) was chosen as one of the significant features in predicting RTW. Mental health status plays an important role in predicting RTW, as shown by depression score being selected as 1 of the significant features. This finding is supported by another study (12) that found that a high depression score reduced the possibility of RTW. The other 4 significant features are ST-elevation myocardial infarction (Admission_Diagnosis_ST-Elevation myocardial infarction (STEMI)), past CV history: Previous Coronary Bypass Grafting (Past_CV_Prev_CABG), and high levels of triglyceride (Triglyceride_cat_high) and high-density lipoprotein (HDL). These are new features that have not been selected by previous research in predicting RTW.
In the pre-CR stage, peak heart rate (Pre_Peak_Heart_Rate_range_Very_Light) is also a predictor of RTW. Odds ratio presents that patients with a small range of peak heart rate after CR had a lower chance of RTW. Patients with a small range of peak heart rate after CR had a lower chance of RTW based on the odds ratio. Smoking status (Pre_Tobacco_former_smoker) and return to driving status (Pre_Return_to_Drive) were selected as important features from the pre-CR attributes.
During the CR stage, blood pressure measurements (CR_BP_Cat_Isolated Systolic Hyptertension and CR_BP_Cat_Optimal) were selected. This finding is also in line with a study by Mustafah et al. (8), which used hypertension as an attribute in predicting RTW.
Finally, 4 features were selected in the post-CR stage: unexpected cardiac events; peak heart rate (Post_Peak_Heart_Rate_range_Light); return to driving (Post_Return_to_Drive); and exercise stress test (Post_Exercise_Stress_Test_Treadmill). The existence of an unexpected cardiac event, such as death, heart attack, cardiac arrest, acute myocardial infarction, cardiac rupture, etc. is an important feature in predicting RTW. Return to driving is one of the significant features in predicting RTW, since driving is considered a complex activity that requires high skill to interact with the vehicle and react to the environmental conditions. Thus, if a patient returns to driving without any issues, they are likely to be able to RTW. Salzwedel et al. (9) also stated that exercise test results are an important attribute that predicts RTW.
Analysis of the features mostly frequently selected by the highest performing of the 8 machine learning models for predicting RTW is shown in Fig. 7. The details of the selected features in each of the top performing model are shown in Appendix S5.
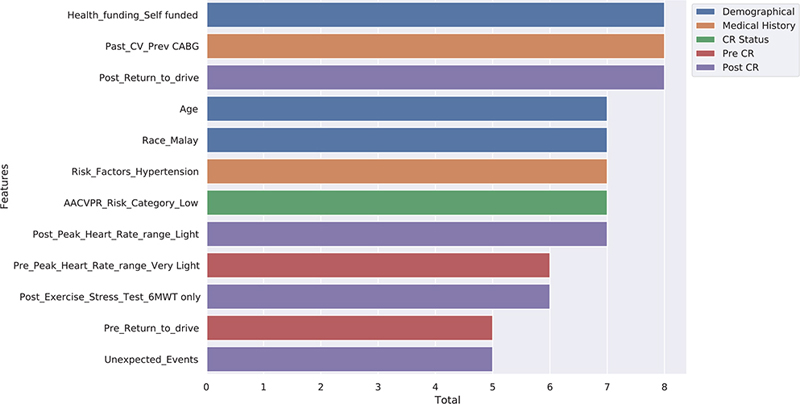
Fig. 7. Overlapping features based on machine learning models to predict return to work. Prev_CABG: Previous Coronary Artery Bypass Grafting; AACVPR: American Association of Cardiovascular and Pulmonary; 6MWT: six minutes walk test.
Self-funding patients (Health_funding_Self_funded), previous coronary artery bypass grafting (Past_CV_Prev CABG), and post-return to driving (Post_Return_to_Drive) features were present in all the prediction models including the multiple logistic regression model. All of these models considered self-funding to be an important feature in predicting RTW. Mustafah et al. (8) and Salzwedel et al. (9) also used previous CABG in predicting RTW, which was considered an input feature by all models evaluated in the current study. Returning to driving indicates that the patient can control a vehicle by themselves after completing a CR programme. Resuming driving is an important factor, which indicates that the patient has good visual perception, is able to pay attention, and has good motor strength and cognitive function.
Age, Malay patients (Race_Malay), hyptertension (Risk_Factor_Hypertension), low AACVPR risk (AACVPR_Risk_Category_Low) and light post-peak heart rate (Post_Peak_Heart_Rate_Range_Light) were selected by 7 models. Low AACVPR risk is the only attribute that was selected from the CR_status category based on the analysis shown in Fig. 7. Post_CR is the most popular category, whereby 4 out of 12 top features are selected.
DISCUSSION
This study showed the potential of machine learning models in predicting RTW after CR. The AdaBoost model gave the best prediction performance. SVM also showed comparable results. Models that used a boosting approach in machine learning, such as AdaBoost, XGBoost and CatBoost, were always in the top 4 ranking for performance, while Adaboost was always in the top 3 for performance (with top 10 features, top 20 features, and top 30 features). Boosting algorithms that placed more weight on the weak classes improved the performance of the minority class in this study, which predicts no RTW.
The outcome of this model should assist in planning programmes for patients to help them RTW after CR. This is more important when identifying which patients are likely to not RTW. The high specificity of the model in this study, can help to reduce false-positives and accurately identify the outcome of a patient in returning to work.
With a smaller subset of features, all the models improved significantly in terms of the performance of the prediction. The ROC AUC score was improved significantly compared with the models with full features. Therefore, feature selection has the benefit of improving the performance of the models. When there are more features in the model, it creates noise and affects the performance of the models, as evidenced by the results when using the top 30, 40 features and all features.
RFE, the ensemble feature selection method, provides better performance than multiple logistic regression analysis. The ensemble method repeatedly checks on the model and selects the best set of features (15). All the models used different sets of important features to make predictions of RTW after CR. Besides Decision Tree and Complement Naive Bayes, other machine learning models did not use all the significant predictors from multiple logistic regression analysis. Even if there are common features in the models, their importance can differ. For example, return to driving is the most significant predictor in the multiple logistic regression model, but in the AdaBoost model, it was placed at 12th most important feature, and in SVM at second most important feature.
The AdaBoost model used a different set of features than the multiple logistic regression model. It was considered that there was information loss in the multiple logistic regression model that resulted in a lower prediction performance. This can be observed by comparing the features selected in both models. The features selected in the AdaBoost model covered all 6 categories: demographic, medical history, CR status, pre-CR, during CR, and post-CR. In the multiple logistic regression model, during CR was not considered as one of the significant categories. Covering all types of categories in AdaBoost helps to enhance its prediction performance.
Although there are some differences between the selected features, the results of both the multiple logistic regression model and the AdaBoost model agree that demography, medical history, physical status and post-return to driving are important features in predicting RTW. In addition, the AdaBoost model finds that CR duration, duration between ward and enrolment, and depression scores, are important factors.
Studies conducted on predicting RTW after CR are lacking significantly from the perspective of developing nations such as Malaysia. Table 1 shows the studies on predicting RTW of CR patients are based on developed nations (9, 10, 11, 12, 13, 14). On another note, most of the studies are build based on the registry which are mainly from European nations. Thus, it is not suitable to generalize the prediction of RTW of CR patients in developing countries. A developing country has a lower-income economy when compared to that of a developed country, with a less mature and sophisticated economy (20). Although the health benefit of CR is well established in medicine, its uptake rate remains suboptimal especially in middle- and low-income countries. Studies have shown that the attendance rate is the most common bariers in developing nations (22,23). Our study also reveals that duration of CR as the most important contributing factor in predicting RTW. This could be due to many contributing factors such as transportation problems, distance, travel cost and also lack of financial assistance to cover the rehabilitation cost (24). The findings of our study also show that self-funded (health_funding_self_funded) is an important feature in predicting RTW obtained by all the 8 machine-learning models.
Study limitations
This study has some limitations. First, the dataset represents only a single CR centre due to the unavailability of other prospective datasets. Studies of similar models on datasets from different regions or countries are necessary. Secondly, the dataset lacks work-related variables, such as job satisfaction, and whether the work requires a high level of physical activity. Use of additional factors, such as work-related factors, may improve the performance of the prediction. As feature selection resulted in very good improvements in prediction performance, further research is required to identify the most suitable feature selection method.
CONCLUSION
To the best of our knowledge, this is the first study to explore different machine learning models in predicting RTW after CR. Machine learning models obtained better performance in predicting RTW compared with other models used in previous research. The AdaBoost model, with the top 20 features selected using a RFE method, achieved the best performance in predicting RTW, with 92.4% ROC AUC, 86.4% accuracy, 92.8% sensitivity and 73.3% specificity. This predictive model should help clinicians and policymakers in identifying the likelihood of RTW among patients with CR. This will be of use in planning suitable CR programmes to help the patient RTW. Besides determining the best prediction model, this study highlighted the significant features for use in predicting RTW. This finding will be useful for clinicians, employers, researchers, etc. to understand the contributing factors that determine RTW among patients with CR.
ACKNOWLEDGEMENTS
This work was supported by the Prototype Research Grant Scheme (PRGS/1/2022/SKK01/UM/02/1 - PR001-2022). We would like to thank University of Malaya Research Grant (RF009C-2018) and University of Malaya Specialist Center Care Fund (PV019-2020) for helping in building the foundation required for this study.
REFERENCES
- Benjamin EJ, Muntner P, Alonso A, Bittencourt MS, Callaway CW, Carson AP, et al. Heart disease and stroke statistics – 2019 update: a report from the American Heart Association. Circulation 2019; 139: e56–e528.
- Heran BS, Chen JM, Ebrahim S, Moxham T, Oldridge N, Rees K, et al. Exercise-based cardiac rehabilitation for coronary heart disease. Cochrane Database Syst Rev 2011; 6: CD001800. https://doi.org/10.1002/14651858.CD001800.pub2
- CHIN TS. Malaysians get heart attacks at younger age than others. TheStar Newspaper 2016. [accessed 2022 Nov 7]. Available from: https://www.thestar.com.my/news/nation/2016/08/07/malaysians-get-heart-attacks-at-younger-age-than-others
- Cauter JVd, Bacquer DD, Clays E, Smedt DD, Kotseva K, Braeckman L. Return to work and associations with psychosocial well-being and health-related quality of life in coronary heart disease patients: results from EUROASPIRE IV. Eur J Prev Cardiol 2019; 26: 1386–1395. https://doi.org/10.1177/2047487319843079
- Du R, Wang P, Ma L, Larcher LM, Wang T, Chen C. Health-related quality of life and associated factors in patients with myocardial infarction after returning to work: a cross-sectional study. Health Qual Life Outcomes 2020; 18: 190. https://doi.org/10.1186/s12955-020-01447-4
- Warraich HJ, Kaltenbach LA, Fonarow GC, Peterson ED, Wang TY. Adverse change in employment status after acute myocardial infarction: analysis from the TRANSLATE-ACS study. Circ Cardiovasc Qual Outcomes 2018; 11: e004528. https://doi.org/10.1161/CIRCOUTCOMES.117.004528
- Bresseleers J, De Sutter J. Return to work after acute coronary syndrome: time for action. London: Sage Publications Sage UK; 2019, p. 1355–3557. https://doi.org/10.1177/2047487319840183
- Mustafah NM, Kasim S, Isa MR, Hanapiah FA, Abdul Latif L. Predicting return to work following a cardiac event in Malaysia. Work 2017; 58: 481–488. https://doi.org/10.3233/WOR-172646
- Salzwedel A, Koran I, Langheim E, Schlitt A, Nothroff J, Bongarth C, et al. Patient-reported outcomes predict return to work and health-related quality of life six months after cardiac rehabilitation: results from a German multi-Centre registry (OutCaRe). PloS One 2020; 15: e0232752. https://doi.org/10.1371/journal.pone.0232752
- Salzwedel A, Reibis R, Wegscheider K, Eichler S, Buhlert H, Kaminski S, et al. Cardiopulmonary exercise testing is predictive of return to work in cardiac patients after multicomponent rehabilitation. Clin Res Cardiol 2016; 105: 257–267. https://doi.org/10.1007/s00392-015-0917-1
- Fiabane E, Argentero P, Calsamiglia G, Candura SM, Giorgi I, Scafa F, et al. Does job satisfaction predict early return to work after coronary angioplasty or cardiac surgery? Int Arch Occup Environ Health 2013; 86: 561–569. https://doi.org/10.1007/s00420-012-0787-z
- Samkange-Zeeb F, Altenhöner T, Berg G, Schott T. Predicting non-return to work in patients attending cardiac rehabilitation. Int J Rehabil Res 2006; 29: 43–49. https://doi.org/10.1097/01.mrr.0000185949.02552.0d
- Petrie KJ, Weinman J, Sharpe N, Buckley J. Role of patients’ view of their illness in predicting return to work and functioning after myocardial infarction: longitudinal study. BMJ 1996; 312: 1191–1194. https://doi.org/10.1136/bmj.312.7040.1191
- Engblom E, Hämäläinen H, Rönnemaa T, Vänttinen E, Kallio V, Knuts L-R. Cardiac rehabilitation and return to work after coronary artery bypass surgery. Qual Life Res 1994; 3: 207–213. https://doi.org/10.1007/BF00435386
- Chandrashekar G, Sahin F. A survey on feature selection methods. Comput Elec Eng 2014; 40: 16–28. https://doi.org/10.1016/j.compeleceng.2013.11.024
- Forman G, Scholz M. Apples-to-apples in cross-validation studies: pitfalls in classifier performance measurement. Acm Sigkdd Explorations Newsletter 2010; 12: 49–57. https://doi.org/10.1145/1882471.1882479
- Marcot BG, Hanea AM. What is an optimal value of k in k-fold cross-validation in discrete Bayesian network analysis? Computational Statistics 2021; 36: 2009-2031. https://doi.org/10.1007/s00180-020-00999-9
- Stevens, B, Pezzulloa L, Verdiana L, Tomlinsona J, Estrada-Aguilara C, Georgea A, Verdejo-París J. The economic burden of hypertension, heart failure, myocardial infarction, and atrial fibrillation in Mexico. Archivos de cardiología de México 2018; 88(3): 241–244.
- Eijsvogels, Thijs MH, Martijn FHM, Esmee AB, Esther PM, Niels van Gorp, et al. Association of cardiac rehabilitation with all-cause mortality among patients with cardiovascular disease in the Netherlands. JAMA Network Open 2020; 7: e2011686–e2011686
- Teo, Koon K, Talha R. Cardiovascular risk factors and prevention: a perspective from developing countries. Canadian Journal of Cardiology 37.5 2021; 733–743.
- Neil B, Oldridge, Maureen T, Pakosh, Randal J, Thomas. Cardiac rehabilitation in low- and middle-income countries: a review on cost and cost-effectiveness. International Health; 8: 77–82. https://doi.org/10.1093/inthealth/ihv047
- Ragupathi L, Stribling J, Yakunina Y, Fuster V, McLaughlin MA, Vedanthan R. Availability, Use, and Barriers to Cardiac Rehabilitation in LMIC. Glob Heart 2017; 12: 323–334. https://doi.org/10.1016/j.gheart.2016.09.004
- Pesah E, Turk-Adawi K, Supervia M, Lopez-Jimenez F, Britto R, Ding R, et al. Cardiac rehabilitation delivery in low/middle-income countries. Heart 2019; 105: 1806–1812. https://doi.org/10.1136/heartjnl-2018-314486
- Bakhshayeh, Samaneh, et al. Barriers to participation in center-based cardiac rehabilitation programs and patients’ attitude toward home-based cardiac rehabilitation programs. Physiotherapy Theory and Practice 2019.