ORIGINAL ARTICLE
PERCEIVED AND PHYSIOLOGICAL STRAINS OF SOCIETAL PARTICIPATION IN PEOPLE WITH MULTIPLE SCLEROSIS: A REAL-TIME ASSESSMENT STUDY
Arianne S. GRAVESTEIJN, PT, MSc1,2, Maaike OUWERKERK, MSc1,2, Isaline C.J.M. EIJSSEN, OT, PhD1–3, Heleen BECKERMAN, PhD1–3 and Vincent DE GROOT, MD, PhD1,2
From the 1MS Center Amsterdam, Rehabilitation Medicine, Vrije Universiteit Amsterdam, Amsterdam UMC location VUmc, Amsterdam, 2Amsterdam Neuroscience Research Institute, Neuroinfection & Neuroinflammation, Amsterdam, 3Amsterdam Public Health Research Institute, Social Participation and Health, Amsterdam, The Netherlands
Objective: To examine the relationship between perceived and physiological strains of real-time societal participation in people with multiple sclerosis.
Design: Observational study.
Subjects/Patients: 70 people with multiple sclerosis.
Methods: Perceived and physiological strain of societal participation (10 participation-at-location and 9 transport domains) were measured in real time using the Whereabouts smartphone app and Fitbit over 7 consecutive days. Longitudinal relationships between perceived (1 not strenuous to 10 most strenuous) and physiological strains (heart rate reserve) were examined using mixed-model analyses. Type of event (participation-at-location or transport) was added as covariate, with further adjustments for fatigue and walking ability.
Results: Median perceived strain, summarized for all societal participation domains, varied between 3 and 6 (range: 1–10), whereas physiological strain varied between 18.5% and 33.2% heart rate reserve. Perceived strain (outcome) and physiological strain were not associated (β -0.001, 95%CI -0.008; 0.005, with a 7-day longitudinal correlation coefficient of -0.001). Transport domains were perceived as less strenuous (β -0.80, 95%CI -0.92; -0.68). Higher fatigue levels resulted in higher perceived strain (all societal participation domains) (β 0.05, 95%CI 0.02; 0.08).
Conclusion: Societal participation resulted in low-to-moderate perceived and physiological strain. Perceived and physiological strain of societal participation were unrelated and should be considered different constructs in multiple sclerosis.
LAY ABSTRACT
People living with multiple sclerosis often experience a wide variety of symptoms, such as muscle weakness and fatigue, which can result in high patient-perceived strain during daily living. Moreover, in research settings activities of daily living require more energy in people with multiple sclerosis when compared with healthy peers. During physical exercise the energy requirements are closely related to patient-perceived strain, but whether this is also the case in real-time daily living is unknown. Therefore, we examined the relationship between patient-perceived strain and energy requirements during real-time societal participation. With the Whereabouts smartphone application and Fitbit, we were able to measure both patient-perceived strain and energy demands. In 70 people living with multiple sclerosis, we found that these measures were unrelated. The level of fatigue played an important role in this relationship; a higher level of fatigue resulted in higher patient-perceived strain.
Key words: activities of daily living, digital health, heart rate, multiple sclerosis, patient-reported outcome measure, societal participation.
Citation: J Rehabil Med 2024; 56: jrm40838. DOI: https://doi.org/10.2340/jrm.v56.40838.
Copyright: © 2024 The Author(s). Published by MJS Publishing, on behalf of the Foundation for Rehabilitation Information. This is an Open Access article distributed under the terms of the Creative Commons Attribution 4.0 International License (http://creativecommons.org/licenses/by/4.0/).
Submitted: Jan 16, 2024; Accepted after revision: May 30, 2024; Published: Jun 24, 2024.
Correspondence address: Arianne, S. Gravesteijn, Department of Rehabilitation Medicine, Amsterdam UMC, location VUmc, De Boelelaan 1117, 1081 HZ Amsterdam, The Netherlands. E-mail: a.gravesteijn@amsterdamumc.nl
Competing interests and funding: The authors have no conflicts of interest to declare.
This work was supported by the Dutch MS Research Foundation (grant number: 16-918 MS). The funding organization had no role in the acquisition, analysis, and interpretation of data or in drafting the manuscript.
Multiple sclerosis (MS) is characterized by time-variable motor, sensory, visual, emotional, and cognitive impairments, resulting in an unpredictable disease course for most people living with MS (pwMS) (1). These impairments restrict pwMS in social functioning and societal participation (2).
The International Classification of Functioning, Disability and Health of the World Health Organization defines participation as “involvement in life situations” (3). Participation not only depends on the ability to perform activities, but also entails well-being, meaningfulness, satisfaction, and the ability to perform social roles in a social environment (4–9). Active societal participation is essential for personal well-being and closely linked to quality of life (4, 10, 11). These concepts are linked to the definition of health introduced in 2011: “The ability to adapt and to self-manage in the face of social, physical, and emotional challenges” (12). Improving societal participation is therefore an important treatment goal in rehabilitation medicine (2, 4).
While it is essential to measure societal participation, selecting and carrying out appropriate measurements presents a complex challenge (6, 13). Current measures of societal participation fail to take into account real-time assessment, perceived experiences, and meaningfulness (2). Each person has a unique experience of societal participation, determined by individual social roles and cultural and political environments (2). The need for an assessment tool that takes into account a person’s perceived, unique, real-time assessed societal participation has led to the development of the “Whereabouts” smartphone application (14).
The strain of societal participation can be expressed as perceived strain (a person’s self-perceived physical and/or psychological effort (15)). Strain can also be expressed quantitatively as physiological strain; for example, as percentage heart rate reserve (%HRR) (16). Since pwMS often experience motor problems and fatigue (1, 17), perceived strain might be high and become a limiting factor for societal participation. Ainsworth and colleagues described the physiological strain for a variety of activities of daily living in healthy individuals (18). However, studies indicate that people with disabilities may consume more energy than healthy people when engaged in societal participation (19, 20), which suggests that monitoring both perceived and physiological strain in pwMS is relevant.
Previous literature demonstrated a strong positive relationship between perceived and physiological strain during exercise in healthy individuals and in pwMS (21, 22). However, to our knowledge the relationship between perceived and physiological strain of societal participation in pwMS has not yet been examined. Better insight into this relationship during societal participation can help elucidate the high perceived strains during daily living in pwMS.
The aim of this study was to determine the relationship between perceived strain and physiological strain during societal participation in pwMS. We hypothesized that perceived and physiological strain are positively associated. Due to mobility problems and MS-related fatigue, physical strain values are expected to be higher compared with the general population (19, 20, 23). If such a positive relationship exists, the Whereabouts app can be helpful in correctly assessing and interpreting strains, as well as in the efficient tailoring of self-management programs and other rehabilitation treatment programs for pwMS.
METHODS
Study design and participants
Participants were recruited at the department of Rehabilitation Medicine, Amsterdam UMC, location VUmc, the MS Center Amsterdam, and through local advertisement (i.e., website local MS organizations and information folder). PwMS that showed interest received a study information letter containing information on the rationale, purpose, and duration of the study. Participants were eligible if they had a definite diagnosis of MS confirmed by a neurologist, were at least 18 years old, and possessed a smartphone (Android [5+] or IOS [9+]). People were excluded if they lived in a nursing home or received inpatient care, were incompetent to give informed consent, or if they reported that they cannot use a smartphone very well to answer app-related questions. After providing written informed consent, pwMS were screened by telephone for inclusion and exclusion criteria. Baseline home visits were scheduled for the installation of the Whereabouts smartphone app (see below) and participants were instructed on how to use both the app and Fitbit. The Whereabouts smartphone app and Fitbit were used for 7 consecutive days. Prior to baseline visits at home, participants filled in questionnaires to determine age, gender, disease duration, type of MS, fatigue with the Checklist Individual Strength subscale fatigue (CIS20r fatigue), walking ability assessed with the Multiple Sclerosis Walking Scale (MSWS) (24, 25), and anxiety and depression measured with the Hospital Anxiety and Depression Scale (HADS).
Ethical approval was waived by the Medial Ethics committee of Amsterdam UMC, location VUmc (reference number: 2018.677, date: 10 January 2019). The study was conducted in accordance with the Declaration of Helsinki.
Sample size
Sample size was set at 80 pwMS, taking into account an eventual dropout of 15%, to investigate the validity of the Whereabouts app with adequate statistical power. A sample size of 70 participants is well above the recommended minimum of n = 50 to achieve adequate statistical power in clinimetric studies (14, 26, 27).
Whereabouts smartphone app
The Whereabouts smartphone app was developed to determine meaningful societal participation. The application automatically and accurately measures real-time location and transport using GPS (14). Participants were asked to define the type of participation performed at a location as well as the type of transport used between locations from a pre-specified list (Table I). Real-time segments are created at a location or during transport. After each time segment, the Whereabouts smartphone app automatically asks users for information about the type of participation or transport, meaningfulness, and strain. Meaningfulness and strain were measured using 1- to 10-point scales, 1 indicating not meaningful to me at all and 10 very meaningful to me, and 1 not strenuous at all and 10 most strenuous, respectively. It was explained to participants that strain was considered both mental and physical strain.
Fitbit
Heart rate as a measure of physiological strain was assessed continuously (i.e., day and night) by a Fitbit Charge 2 or 3 during use of the Whereabouts smartphone app (i.e., 7 consecutive days), except for a 1- to 2-hour period after day 4 when the Fitbit needed to be recharged and was not worn. The Fitbit measures heart rate continuously using PurePulse, a photoplethysmography technique (28). The Fitbit Charge is a valid measurement tool to determine heart rate during daily living conditions (29). However, recent findings do indicate a possible underestimation of heart rate determined with a Fitbit Charge (30).
Data analysis
Perceived strain and start–stop times for the various segments of societal participation or transport were documented in the Whereabouts smartphone app (14). Fitbit data were downloaded from the Fitbit webpage. Per day a Fitbit .JSON-file for each participant was uploaded in Matlab (version R2016b Mathwork, Natick, MA, USA). Time points and heart rates for the 7 consecutive days were combined and visually assessed for continuous measurement. If participants did not have data covering the entire 7-day measurement period they were excluded from the analysis. To account for relative intensities of the different societal participation and transport segments, heart rate reserve (%HRR) (calculation I) was determined as a measure of physiological strain (16).
Calculation I: %HRR = (HRtask-HRrest)/(HRmax-HRrest)
HRtask is the mean heart rate during a societal participation segment at location or during transport, HRrest is the lowest mean heart rate over 1,000 consecutive heart rate measures during the 7 consecutive days, and HRmax is the predicted maximal heart rate based on the Karvonen formula: 220 – age (31).
For all societal participation at location and transport segments, start and stop dates and times were registered by the Whereabouts smartphone app as dd/mm/yyyy, hh:mm:ss in central European summer time. In Matlab these time points were synchronized to the same time points in the Fitbit data (i.e., dd/mm/yyyy, hh:mm:ss in central European summer time). Mean heart rate and standard deviation of heart rate were established for each segment (i.e., from start to stop). Finally, %HRR was calculated for all societal participation segments.
Statistical analysis
Statistical analysis was performed using STATA 14 statistical software (StataCorp LLC, College Station, TX, USA). Normality of distributions was checked by visual assessment of histograms.
The number of accurately measured perceived and physiological strain values was determined for all societal participation segments. Physiological strain (i.e., %HRR) is presented as mean (SD) and perceived strain is presented as median (range). The number of participants that contributed to the different domains is also reported.
The longitudinal relationship between participant-reported perceived strain in the Whereabouts smartphone app (i.e., dependent variable) and physiological strain of societal participation as measured by the Fitbit, operationalized by %HRR (i.e., independent variable), was assessed with linear mixed-model analysis. The linear mixed model was built from simple regression to a random intercept model, followed by a random intercept–random slope model (32). Finally, type of event (i.e., societal participation at location = 0 or transport = 1) was added to the best fitted model, first as a determinant and then with an interaction term with %HRR. To adjust for possible effects of fatigue, walking ability, anxiety, and depression, the scores on the CIS20r fatigue, MSWS, and HADS subscales were added to the model. Fitting of the models was compared using the likelihood-ratio test (33). To better understand the strength of the relationship, analyses were repeated for the domain “recreation, leisure and sport”. In this domain, which consists of intensive sports activities but also relaxation during leisure time, a wide variance between and within participants was expected. This could potentially lead to a stronger relationship between perceived and physiological strain.
A longitudinal correlation coefficient was calculated to determine the correlation between perceived and physiological strain. The longitudinal correlation coefficient was determined for the best fitted models by multiplying the regression coefficient of that model by the SD of the independent variable (%HRR) and dividing this by the SD of the dependent variable (perceived strain). The correlation was determined to be weak, moderate, or strong in case of a correlation < 0.3, 0.3–0.7, or > 0.7, respectively (34).
RESULTS
Participants
In total, 77 pwMS were included in the study. Seven individuals were subsequently excluded from analyses because data from the app (n = 4) or Fitbit (n = 2) were not available due to technical difficulties or the participant was lost to follow-up (n = 1). The remaining 70 participants had a mean age of 51 years (ranging from 25 to 72 years of age), a mean disease duration of 11 years, a median MSWS score of 40%, and the most common disease subtype was relapsing remitting MS (Table II).
Perceived and physiological strain segments
A total of 3,280 societal participation segments (at location or transport) were registered by the Whereabouts smartphone app for the 70 participants combined. Perceived strain values were missing on 208 occasions in 20 participants, and 142 heart rate measures in 34 participants were missing due to an interruption of the Fitbit, including 9 participants for whom perceived strain values and heart rate measures were both missing. A total of 2,939 outdoor participation (1,146 at location and 1,776 during transport, 17 undetermined event type) events were coupled and analysed. In Fig. 1, continuous heart rate measurement (grey line) and perceived strain during societal participation segments (dark grey dots) are plotted for 2 participants, demonstrating differences between individuals regarding perceived strains (in participant A varying from 4 to 9 and in participant B from 2 to 10) and heart rate (participant A shows greater variability in heart rate than participant B).
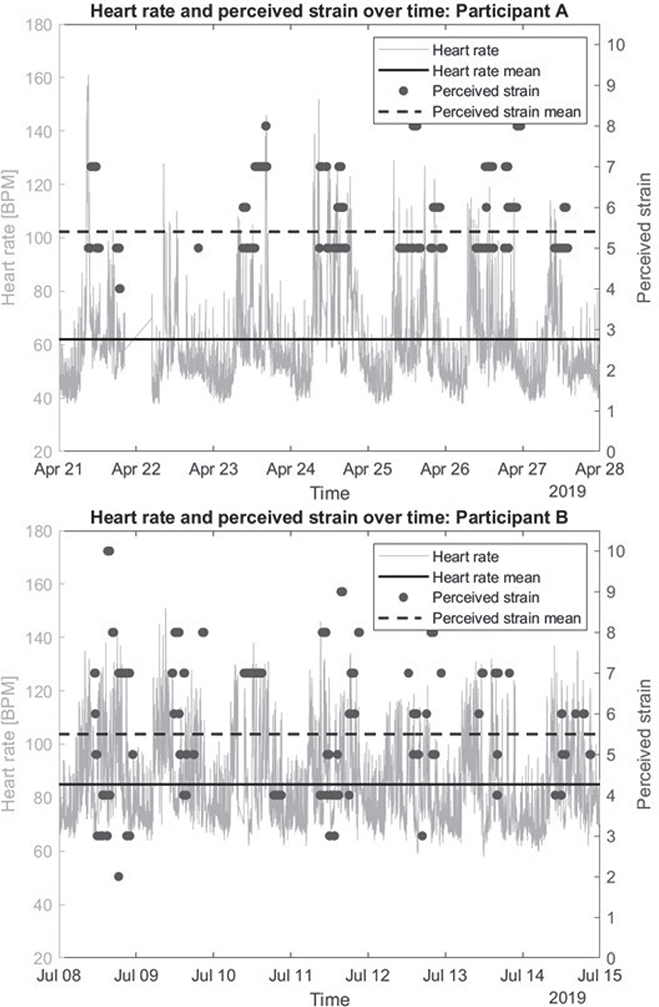
Fig. 1. Perceived strain and heart rate coupling for 2 participants.
Perceived and physiological strains of societal participation
Median perceived strain and mean physiological strain values for the participation at location and transport domains are presented in Table III. The number of registered segments per domain, as well as number of participants who contributed to these domains, are also presented in Table III.
Overall, the median perceived strain of societal participation domains varied between 3 and 6, with interpersonal ranges between 1 and 10. The mean physiological strain across the domains ranged from 18.6 to 33.2%HRR. The societal participation at location domain “other”, and transport domains “other” and “electric bike” were not taken into account, as these domains were not clearly described and the number of contributors was small (i.e., 3, 1, and 11, respectively). The domain “household tasks, groceries and gardening” was the most often reported participation at location, with a median perceived strain of 5, range 1–10 (330 segments in 61 participants), and mean physiological strain 21.5% HRR, SD 9.7 (316 segments in 59 participants). The highest reported median perceived strain was 5.5 (range: 1–10) for the domain “health care utilization”, whereas the median perceived strain for all other participation at location domains was 5. Conversely, the mean physiological strain for the domain “health care utilization” was 21.3% HRR, which was the third lowest physiological strain value. The highest reported physiological strain was measured for the domain “personal care” (mean 25.0%HRR, SD 10.35).
For transport, the domain “car as driver” was reported most frequently, with a median perceived strain of 3, range 1–8 (611 segments in 53 participants), and mean physiological strain of 21.6%HRR (587 segments in 53 participants). The highest perceived strain was registered in the domain “wheelchair” (median: 6, range: 1–9), while physiological strain was shown to be the lowest in this domain (mean 18.61%HRR, SD 13.06).
Relationship between perceived and physiological strains of societal participation
The relationship between perceived and physiological strain (%HRR) during societal participation and transport events over the 7-day monitoring period, ignoring intra-person dependency in the data, was significant (β –0.01, 95% CI –0.02 to –0.002) (Table IV). By adding a random intercept per individual and adjusting for this dependency, the model improved significantly (χ2 (1) = 1,492.70, p < 0.01), but the relationship between perceived and physiological strain was no longer significant (β 0.0003, 95% CI –0.007 to 0.007). Adding random slopes did not lead to further improvement of the model (χ2 (2) = 1.32, p > 0.05).
| Factor | b | SEb | 95% CI | |
| Lower | Upper | |||
| 1. Simple regression | ||||
| Intercept | 4.82 | 0.10 | 4.63 | 5.01 |
| % HRR | –0.01 | 0.004 | –0.02 | –0.002 |
| 2. Random intercepta | ||||
| Intercept | 4.69 | 0.19 | 4.32 | 5.07 |
| % HRR | 0.0003 | 0.004 | –0.007 | 0.007 |
| 3. Random intercept & random slopeb | ||||
| Intercept | 4.70 | 0.20 | 4.30 | 5.09 |
| % HRR | 0.00002 | 0.004 | –0.007 | 0.008 |
| 4. Adding type of event as predictor to the random intercept modelc,d | ||||
| Intercept | 5.22 | 0.20 | 4.83 | 5.61 |
| % HRR | –0.001 | 0.003 | –0.008 | 0.005 |
| Type of event (ref. societal participation at location = 0) | –0.80 | 0.06 | –0.92 | –0.68 |
| 5. Adding interaction term of type of event and %HRR to random intercept modelc | ||||
| Intercept | 5.14 | 0.22 | 4.71 | 5.56 |
| % HRR | 0.003 | 0.005 | –0.008 | 0.01 |
| Type of event (ref. societal participation activities = 0) | –0.68 | 0.15 | –0.97 | –0.38 |
| %HRR *Type of event | –0.006 | 0.006 | –0.02 | 0.007 |
| 6. Adjustment for fatigue (CIS20r) and walking ability (MSWS) added to random intercept modelc,e | ||||
| Intercept | 3.32 | 0.52 | 2.30 | 4.34 |
| % HRR | –0.001 | 0.003 | –0.008 | 0.005 |
| Type of event (ref. societal participation activities = 0) | –0.80 | 0.06 | –0.92 | 0.68 |
| MSWS | 0.003 | 0.006 | –0.008 | 0.015 |
| CIS20r | 0.05 | 0.02 | 0.02 | 0.08 |
| aSignificant improvement of model; χ2 (1) = 1492.70, p < 0.01; bno significant improvement of model; χ2 (2) = 1.32, p = 0.52; cn = 2,922, 17 missing due to registration error in type of event; dtype of event is a significant predictor of perceived strain; esignificant improvement of model; χ2 (2) = 13.86, p < 0.01. | ||||
| SE: standard error; HRR: heart rate reserve; ref: reference category; CIS20r: Checklist Individual Strength; MSWS: Multiple Sclerosis Walking Scale; CI: confidence interval. | ||||
Type of event (i.e., location = 0 [reference category] or transport = 1) was added to the random intercept model and found to be a significant covariate in the relationship between perceived and physiological strain (β –0.80, 95% CI –0.92 to –0.068). Type of event was not a significant effect modifier in the relationship between perceived and physiological strain (p = 0.37). Subsequently, the model was adjusted for CIS20r fatigue and walking ability measured by the MSWS, which led to a further improvement of the model (χ2 (2) = 13.86, p < 0.01). HADS scores did not improve the model, and were excluded. In this final model, the relationship between perceived strain and physiological strain was not significant (β –0.001, 95%CI –0.008 to 0.005). A higher fatigue level resulted in higher perceived strain (Table IV).
Recreation, leisure, sports domain
The domain “recreation, leisure and sports” was one of the most popular domains, with 192 documented and coupled segments for 53 of the 70 participants. Separate analysis of this domain showed a non-significant relationship between perceived and physiological strain (β 0.009, 95% CI –0.02 to 0.04 and β 0.007, 95% CI –0.02 to 0.03 adjusted for fatigue and walking ability) (Table V).
| Factor | b | SEb | 95% CI | |
| Lower | Upper | |||
| 1. Simple regression | ||||
| Intercept | 5.41 | 0.43 | 4.57 | 6.25 |
| %HRR | -0.01 | 0.02 | -0.04 | 0.02 |
| 2. Random intercepta | ||||
| Intercept | 5.12 | 0.43 | 4.28 | 5.95 |
| %HRR | 0.009 | 0.01 | -0.02 | 0.04 |
| 3. Adjustment for fatigue (CIS20r) and walking ability (MSWS) added to random intercept modelb | ||||
| Intercept | 2.86 | 0.87 | 1.15 | 4.57 |
| % HRR | 0.007 | 0.014 | -0.02 | 0.04 |
| MSWS | 0.018 | 0.010 | -0.001 | 0.036 |
| CIS20r | 0.04 | 0.02 | -0.01 | 0.09 |
| aSignificant improvement in model; χ2 (1) = 53.64, p < 0.01; bsignificant improvement in model; χ2 (2) = 10.58, p < 0.01. | ||||
| SE: standard error; %HRR: % heart rate reserve; CIS20r: Checklist Individual Strength; MSWS: Multiple Sclerosis Walking Scale; CI: confidence interval. | ||||
Longitudinal correlation between perceived and physiological strain during societal participation
The regression coefficient of the best fitting model (i.e., the random intercept model with β –0.001) was multiplied by the SD of physiological strain (SD = 9.969) and divided by the SD of perceived strain (SD = 2.220), resulting in a longitudinal correlation coefficient of –0.004 between perceived and physiological strains during societal participation in pwMS. Sub-analysis for the domain “recreation, leisure and sports” demonstrated a longitudinal correlation coefficient of 0.03. These results do not support a longitudinal correlation between perceived and physiological strain during societal participation or during recreation, leisure and sports.
DISCUSSION
In this study the relationship between real-time assessed patient-perceived and physiological strain during societal participation was assessed in pwMS. In contrast to our expectations, we found no relationship between perceived and physiological strain during societal participation in pwMS. Moreover, the relationship in the more physically orientated domain “recreation, leisure and sports” was similar to the model including all societal participation domains. This suggests that perceived and physiological strain are unrelated during societal participation.
Perceived strain, effort as experienced by the patient, was measured on a 1- to 10-point scale, taking into account both the physical and mental effort required for societal participation (15). At each location and after each use of transport participants were asked to score their perceived strain, which gave a realistic societal participation timeline coupled to real-time assessment of perceived strain (14).
In this study, perceived strain for the various domains was rated low-to-moderate, with a median perceived strain of 5 in 12 out of 19 societal participation domains (35). Adjusting the model for fatigue and walking ability resulted in a better fit. In particular, fatigue significantly affected the relationship between perceived and physiological strain, as a 10-point increase in fatigue level resulted in a 0.5 increase in perceived strain. In pwMS, the perception of bodily sensations might be altered, which might have contributed to the higher perceived strain (36).
The light to very light (i.e., HRR ranging from 15.8% to 25.0%) physiological strains observed were unexpected (16), because people with disabilities such as MS usually consume more energy when engaging in activities (20, 37). However, the energy expenditure of daily activities is often measured in laboratory settings where participants are asked to perform standardized activities according to strict research protocols. In the current study, societal participation was measured in a community-based setting where pwMS likely regulate their energy requirements by performing activities at a low intensity or low pace to compensate for a lack of energy, especially in the case of those more severely affected by the disease (38, 39).
Inconsistent with our original hypothesis, the results indicate that perceived and physiological strain are two different constructs; for example, the reported perceived strain for the transport domain “car as driver” was 3, which was among the lowest reported values, while the calculated physiological strain in this domain was 22%HRR, one of the highest values for physiological strain. Such inconsistencies were also found for the participation at location domain “health care utilization”. Here the median perceived strain was 5.5, the highest rated participation at location domain, while the mean physiological strain was only 21.3% HRR, amongst the least strenuous of the societal participation domains.
In contrast to the lack of a significant relationship between perceived and physiological strains in pwMS in this study, healthy people show a strong correlation between perceived strain and heart rate during exercise (r = 0.74) (22). During exercise, pwMS reportedly show strong correlations between perceived strain and physiological strain as measured by oxygen uptake (r = 0.69) or workload (r = 0.70); however, the same study found only a weak negative correlation between perceived strain and heart rate (r = –0.28) (21). For comparison, we found a correlation coefficient of –0.004 in our complete sample and 0.03 in the domain “recreation, leisure and sports” in our study. Whereas the main focus during exercise is on physical strain, the Whereabouts smartphone app focuses on societal participation in which personal and environmental circumstances likely impact perceived strain. Therefore, in our study the perceived strain of societal participation in the community can be seen as a construct that measures a combination of perceived physical and mental strain.
Considering that physiological strain does not explain perceived strain, disentangling differences between the two during societal participation might have important diagnostic and treatment implications. Societal participation appears to be less physiologically demanding than expected, while it is still perceived as strenuous by patients living with MS. This might be explained by fatigue, walking ability, or other factors (i.e., cognitive demands, body mass index), but does suggest that the focus of treatment should be less concerned with physiologically related issues and more concerned with perceived strain and related factors.
The Whereabouts smartphone app is a unique smartphone application that allows real-time assessment of meaningfulness of societal participation as well as real-time assessment of perceived strains. Using GPS tracking, the smartphone app was able to clearly distinguish between societal participation domains and transport means (14). The Whereabouts app was valued as highly important by its users (14), and this app clearly represents a valuable new patient-reported outcome measure in the field of rehabilitation medicine.
Societal participation was subdivided into pre-specified domains. The domains “car as driver” and “car as passenger” are clearly defined, and the physiological strain associated with car driving was expected to be low. By contrast, domains such as “cycling” or “work & education” can encompass a broad range of different activities, and therefore physiological strains will vary greatly. Nonetheless, only minimal differences were noted for all societal participation domains combined and for the domain “recreation, leisure and sports” specifically.
Study strengths and limitations
To our knowledge, this is the first study comparing patient-perceived and physiological strains of societal participation in a heterogeneous group of people living with MS in a community setting.
Some study limitations should be mentioned. First, although the Whereabouts smartphone app was able to make a clear distinction between the various domains of participation at location and during transport (14), it was difficult to determine specific strains due to the broad pre-specified domains (e.g., “recreation, leisure and sport”, “household tasks, groceries and gardening”, “wheelchair (manual or electronic)”). Second, heart rate might not be the most appropriate indicator of physiological strain, as it can also fluctuate due to factors such as stress, body temperature, or medication, all of which likely play a role in pwMS (40). In addition, it is important to be aware of possible alterations in cardiovascular autonomic control in some pwMS (41). A delayed heart rate response during high-intensity activities, especially those of short duration, might have resulted in lower estimates of physiological strain (42). An alternative measurement might be oxygen uptake during societal participation. Furthermore, heart rate measured by a Fitbit might have resulted in an underestimation of physiological strain compared with heart rate measured by gold standard ECG measurements (29). A more accurate approach might involve ECG or a chest-worn heart rate monitor. Moreover, we estimated HRmax of participants using the Karvonen formula. This might have underestimated the HRmax, and to a lesser extent also underestimated physiological strain measured as %HRR, especially in the older study population (43). Finally, perceived strain was measured on a scale of 1 to 10, while exercise studies usually use 0–10 or 6–20 scales. The 1–10 scale used reduces generalizability and makes comparisons of studies difficult (35). For future studies it would be insightful to add a healthy control group. Including a healthy control group can provide insight into the relationship between perceived and physiological strain among healthy people and whether this differs between healthy controls and pwMS.
Conclusion
Assessment of the 7-day relationship between patient-perceived and physiological strains during societal participation in pwMS showed that the perceived and physiological strain of societal participation should be considered as 2 different constructs. The Whereabouts smartphone app provided valuable information to users concerning perceived strains, a factor that may limit active societal participation. We suggest that future measurement of the physiological strains of societal participation will require the deployment of additional wearables.
ACKNOWLEDGEMENTS
Ethical clearance: This study has been conducted in accordance with the declaration of Helsinki and participants gave written informed consent prior to participation. Ethical approval was waived by the medical ethical review board of the VU University Medical Center, Amsterdam.
REFERENCES
- Kister I, Bacon TE, Chamot E, Salter AR, Cutter GR, Kalina JT, et al. Natural history of multiple sclerosis symptoms. Int J MS Care 2013; 15: 146–158. DOI: 10.7224/1537-2073.2012-053
- Heinemann AW. Measurement of participation in rehabilitation research. Arch Phys Med Rehabil 2010; 91: S1–4. DOI: 10.1016/j.apmr.2009.08.155
- World Health Organization. International classification of Functioning, Disability and Health: ICF. Geneva: WHO; 2001.
- Ben Ari Shevil E, Johansson S, Ytterberg C, Bergstrom J, von Koch L. How are cognitive impairment, fatigue and signs of depression related to participation in daily life among persons with multiple sclerosis? Disabil Rehabil 2014; 36: 2012–2018. DOI: 10.3109/09638288.2014.887797
- Chang FH, Coster WJ, Helfrich CA. Community participation measures for people with disabilities: a systematic review of content from an international classification of functioning, disability and health perspective. Arch Phys Med Rehabil 2013; 94: 771–781. DOI: 10.1016/j.apmr.2012.10.031
- Eyssen IC, Steultjens MP, Dekker J, Terwee CB. A systematic review of instruments assessing participation: challenges in defining participation. Arch Phys Med Rehabil 2011; 92: 983–997. DOI: 10.1016/j.apmr.2011.01.006
- Hemmingsson H, Jonsson H. An occupational perspective on the concept of participation in the International Classification of Functioning, Disability and Health: some critical remarks. Am J Occup Ther 2005; 59: 569–576. DOI: 10.5014/ajot.59.5.569
- Magasi S, Hammel J, Heinemann A, Whiteneck G, Bogner J. Participation: a comparative analysis of multiple rehabilitation stakeholders’ perspectives. J Rehabil Med 2009; 41: 936–944. DOI: 10.2340/16501977-0450
- Whiteneck G, Dijkers MP. Difficult to measure constructs: conceptual and methodological issues concerning participation and environmental factors. Arch Phys Med Rehabil 2009; 90: S22–35. DOI: 10.1016/j.apmr.2009.06.009
- Kwiatkowski A, Marissal JP, Pouyfaucon M, Vermersch P, Hautecoeur P, Dervaux B. Social participation in patients with multiple sclerosis: correlations between disability and economic burden. BMC Neurol 2014; 14: 115. DOI: 10.1186/1471-2377-14-115
- Mikula P, Nagyova I, Krokavcova M, Vitkova M, Rosenberger J, Szilasiova J, et al. Social participation and health-related quality of life in people with multiple sclerosis. Disabil Health J 2015; 8: 29–34. DOI: 10.1016/j.dhjo.2014.07.002
- Huber M, Knottnerus JA, Green L, van der Horst H, Jadad AR, Kromhout D, et al. How should we define health? BMJ 2011; 343: d4163. DOI: 10.1136/bmj.d4163
- van de Velde D, Coussens M, De Baets S, Sabbe L, Vanderstraeten G, Vlerick P, et al. Application of participation in clinical practice: key issues. J Rehabil Med 2018; 50: 679–695. DOI: 10.2340/16501977-2363
- Ouwerkerk M, Eijssen I, van der Linden MMW, Wijnands IM, Dorssers FJG, Rietberg MB, et al. A Smartphone application to assess real-time and individual-specific societal participation: a development and usability study. Arch Phys Med Rehabil 2022; 103: 1958–1966. DOI: 10.1016/j.apmr.2022.01.168
- Borg GA. Psychophysical bases of perceived exertion. Med Sci Sports Exerc 1982; 14: 377–381.
- American College of Sports Medicine. ACSM Guidelines for Exercise Testing and Prescription. 9th ed. Indianapolis, IN: American College of Sports Medicine; 2014.
- Bakshi R. Fatigue associated with multiple sclerosis: diagnosis, impact and management. Mult Scler 2003; 9: 219–227. DOI: 10.1191/1352458503ms904oa
- Ainsworth BE, Haskell WL, Herrmann SD, Meckes N, Bassett DR Jr, Tudor-Locke C, et al. 2011 Compendium of Physical Activities: a second update of codes and MET values. Med Sci Sports Exerc 2011; 43: 1575–1581. DOI: 10.1249/MSS.0b013e31821ece12
- Compagnat M, Mandigout S, David R, Lacroix J, Daviet JC, Salle JY. Compendium of physical activities strongly underestimates the oxygen cost during activities of daily living in stroke patients. Am J Phys Med Rehabil 2019; 98: 299–302. DOI: 10.1097/PHM.0000000000001077
- Greiman L, Fleming SP, Ward B, Myers A, Ravesloot C. Life starts at home: bathing, exertion and participation for people with mobility impairment. Arch Phys Med Rehabil 2018; 99: 1289–1294. DOI: 10.1016/j.apmr.2017.11.015
- Cleland BT, Ingraham BA, Pitluck MC, Woo D, Ng AV. Reliability and validity of ratings of perceived exertion in persons with multiple sclerosis. Arch Phys Med Rehabil 2016; 97: 974–982. DOI: 10.1016/j.apmr.2016.01.013
- Scherr J, Wolfarth B, Christle JW, Pressler A, Wagenpfeil S, Halle M. Associations between Borg’s rating of perceived exertion and physiological measures of exercise intensity. Eur J Appl Physiol 2013; 113: 147–155. DOI: 10.1007/s00421-012-2421-x
- Drebinger D, Rasche L, Kroneberg D, Althoff P, Bellmann-Strobl J, Weygandt M, et al. Association between fatigue and motor exertion in patients with multiple sclerosis: a prospective study. Front Neurol 2020; 11: 208. DOI: 10.3389/fneur.2020.00208
- Motl RW, Snook EM. Confirmation and extension of the validity of the Multiple Sclerosis Walking Scale-12 (MSWS-12). J Neurol Sci 2008; 268: 69–73. DOI: 10.1016/j.jns.2007.11.003
- Hobart JC, Riazi A, Lamping DL, Fitzpatrick R, Thompson AJ. Measuring the impact of MS on walking ability: the 12-Item MS Walking Scale (MSWS-12). Neurology 2003; 60: 31–36. DOI: 10.1212/wnl.60.1.31
- Mokkink LB, Prinsen CA, Partcik DL, Alonse J, Bouter LM, de Vet HC, et al. COSMIN Study Design checklist for Patient-reported outcome measurement instruments; 2019. Available from: https://www.cosmin.nl/wp-content/uploads/COSMIN-study-designing-checklist_final.pdf
- Terwee CB, Bot SD, de Boer MR, van der Windt DA, Knol DL, Dekker J, et al. Quality criteria were proposed for measurement properties of health status questionnaires. J Clin Epidemiol 2007; 60: 34–42. DOI: 10.1016/j.jclinepi.2006.03.012
- Fitbit. Fitbit Charge 2 User Manual. Available from: https://www.fitbit.com/content/assets/help/manuals/manual_charge_2_en_US.pdf
- Nelson BW, Allen NB. Accuracy of consumer wearable heart rate measurement during an ecologically valid 24-hour period: intraindividual validation study. JMIR Mhealth Uhealth 2019; 7: e10828. DOI: 10.2196/10828
- Benedetto S, Caldato C, Bazzan E, Greenwood DC, Pensabene V, Actis P. Assessment of the Fitbit Charge 2 for monitoring heart rate. PLoS One 2018; 13: e0192691. DOI: 10.1371/journal.pone.0192691
- Camarda SR, Tebexreni AS, Pafaro CN, Sasai FB, Tambeiro VL, Juliano Y, et al. Comparison of maximal heart rate using the prediction equations proposed by Karvonen and Tanaka. Arq Bras Cardiol 2008; 91: 311–314. DOI: 10.1590/s0066-782x2008001700005
- Twisk JWR. Applied longitudinal data analysis for epidemiology. 2nd ed. Cambridge: Cambridge University Press; 2013.
- Field A. Discovering statistics using IBM SPSS statistics. 4th ed. London: SAGE; 2013.
- Ratner B. The correlation coefficient: its values range between +1/−1, or do they? J Targeting, Measurement and Analysis for Marketing 2009; 17: 139–142. DOI: 10.1057/jt.2009.5
- Williams N. The Borg Rating of Perceived Exertion (RPE) scale. Occup Med 2017; 67: 404–405. DOI: 10.1093/occmed/kqx063
- Rouault M, Pereira I, Galioulline H, Fleming SM, Stephan KE, Manjaly ZM. Interoceptive and metacognitive facets of fatigue in multiple sclerosis. Eur J Neurosci 2023; 58: 2603–2622. DOI: 10.1111/ejn.16048
- Nieuwenburg-van Tilborg EM, Horstman AM, Zwarts B, de Groot S. Physical strain during activities of daily living of patients with coronary artery disease. Clin Physiol Funct Imaging 2014; 34: 83–89. DOI: 10.1111/cpf.12065
- Audulv A, Hutchinson S, Warner G, Kephart G, Versnel J, Packer TL. Managing everyday life: self-management strategies people use to live well with neurological conditions. Patient Educ Couns 2021; 104: 413–421. DOI: 10.1016/j.pec.2020.07.025
- Blokland IJ, Schiphorst LFA, Stroek JR, Groot FP, van Bennekom CAM, van Dieen JH, et al. Relative aerobic load of daily activities after stroke. Phys Ther 2023; 103. DOI: 10.1093/ptj/pzad005
- Rampichini S, Gervasoni E, Cattaneo D, Rovaris M, Grosso C, Maggioni MA, et al. Impaired heart rate recovery after sub-maximal physical exercise in people with multiple sclerosis. Mult Scler Relat Disord 2020; 40: 101960. DOI: 10.1016/j.msard.2020.101960
- Adamec I, Habek M. Autonomic dysfunction in multiple sclerosis. Clin Neurol Neurosurg 2013; 115 Suppl 1: S73–78. DOI: 10.1016/j.clineuro.2013.09.026
- Barnard RJ, Gardner GW, Diaco NV, MacAlpin RN, Kattus AA. Cardiovascular responses to sudden strenuous exercise: heart rate, blood pressure, and ECG. J Appl Physiol 1973; 34: 833–837. DOI: 10.1152/jappl.1973.34.6.833
- Tanaka H, Monahan KD, Seals DR. Age-predicted maximal heart rate revisited. J Am Coll Cardiol 2001; 37: 153–156. DOI: 10.1016/s0735-1097(00)01054-8