ORIGINAL ARTICLE
MALNUTRITION AND SARCOPENIA IN INPATIENT REHABILITATION: PREVALENCE AND ASSOCIATIONS WITH CHANGES IN BODYWEIGHT, MUSCLE STRENGTH, AND FUNCTIONAL INDEPENDENCE
Undine LEHMANN, Dr1, Katja UHLMANN, MSc1, André MEICHTRY, MSc1, Marc SPIELMANNS, MD, PD2,3, Sabine SPIELMANNS2, Ramin KHATAMI, MD Prof4,5, Laura MARTI, BSc1,4, Susanne RÜEGSEGGER, BSc4, Reto W. KRESSIG, MD Prof6,7, Caroline M. KISS, Dr6, Clare MAGUIRE, PhD8, Andrea ZURFLUH, MSc9 and Thimo MARCIN, Dr9
1Division of Nutrition and Dietetics, Department of Health Professions, Bern University of Applied Sciences, Bern, Switzerland, 2Zürcher RehaZentren | Klinik Wald, Wald, Switzerland, 3Faculty of Health, Department of Pneumology, University of Witten-Herdecke, Germany, 4Klinik Barmelweid AG, Barmelweid, Switzerland, 5Department of Neurology, University Hospital Bern, Switzerland, 6University Department of Geriatric Medicine Felix Platter, Basel, Switzerland, 7University of Basel, Basel, Switzerland, 8REHAB Basel Clinic for Neurorehabilitation and Paraplegiology, Basel, Switzerland, 9Berner Reha Zentrum, Rehabilitation & Sports Medicine, Insel Group, University Hospital Bern, Bern, Switzerland
Objective: To investigate the prevalence of malnutrition and sarcopenia in different disciplines of inpatient rehabilitation and the course of nutritional status parameters.
Design: Multi-centre cross-sectional prevalence study and longitudinal observational study.
Subjects/Patients: Inpatients (> 18 years) in geriatric, pulmonary, cardiovascular, internal medicine/oncological, musculoskeletal, or neurological rehabilitation in 5 rehabilitation centres were included.
Methods: Malnutrition was assessed according to the Global Leadership Initiative on Malnutrition criteria. Sarcopenia was assessed according to the European Working Group on Sarcopenia in Older People criteria. Bodyweight, hand grip strength (HGS), and functional independence measure (FIM) were assessed within 3 days of admission and after 21 days of rehabilitation and analysed using linear mixed models with time*diagnosis interaction.
Results: The study included 558 patients (51.8% male, median age 73.0 years). The overall prevalence of malnutrition and sarcopenia was 35.5% (95% CI 31.5, 39.6%) and 32.7% (95% CI 28.8, 36.8%), respectively. Patients with risk of malnutrition lost on average 1.14 kg (95% CI –1.64, –0.63) during rehabilitation. Patients slightly increased their HGS and FIM, irrespective of risk or diagnosis of malnutrition or sarcopenia. However, at the end of the rehabilitation, malnourished or sarcopenic patients had still a significantly lower bodyweight, HGS, and FIM than patients without (p < 0.01). Some 37.3% of patients at risk of and 35.4% with diagnosed malnutrition did not receive group or individual nutritional counselling.
Conclusion: Malnutrition and sarcopenia are highly prevalent during inpatient rehabilitation. Nevertheless, dietitians are often not involved in the therapy. While nutritional parameters and functional independence improve, patients with malnutrition and sarcopenia remain on a lower level after 3 weeks of rehabilitation. Long-term follow-up after rehabilitation is recommended to prevent nutritional and muscular decline and related negative health outcomes.
LAY ABSTRACT
Malnutrition that develops when the body does not get sufficient energy and nutrients, and sarcopenia, a disease resulting in muscle loss and function, are serious health concerns that can lead to negative consequences. We aimed to assess how frequent these problems are in various rehabilitation disciplines and how measures related to malnutrition and sarcopenia change during the course of a rehabilitation stay over 21 days. On average, almost half of the patients in our study suffered from malnutrition, sarcopenia, or both. Although rehabilitation slightly improved muscle strength and independence in daily activities, a considerable number of the patients left rehabilitation in a condition requiring long-term nutritional support. The study should raise awareness regarding the importance of nutritional management during and after rehabilitation.
Key words: malnutrition; sarcopenia; rehabilitation; prevalence; muscle strength; nutrition therapy
Citation: J Rehabil Med 2025; 57: jrm42215. DOI: https://doi.org/10.2340/jrm.v57.42215.
Copyright: © 2025 The Author(s). Published by MJS Publishing, on behalf of the Foundation for Rehabilitation Information. This is an Open Access article distributed under the terms of the Creative Commons Attribution 4.0 International License (http://creativecommons.org/licenses/by/4.0/).
Submitted: Oct 10, 2024; Accepted after revision: Jan 10, 2025; Published: Feb 25, 2025.
Correspondence address: Undine Lehmann, Department of Health Professions, Bern University of Applied Sciences, Murtenstrasse 10, CH-3008 Bern, Switzerland. E-mail: undine.lehmann@bfh.ch
Competing interests and funding: This research was funded by a grant from Fresenius Kabi (Switzerland) AG. The authors report no involvement in the research by the sponsor that could have influenced the outcome of this work.
The authors have no conflicts of interest to declare.
Malnutrition is a common health concern in several populations, particularly in older adults. The associations between malnutrition and negative outcomes such as higher complication rates, increased length of hospital stay, increased morbidity, mortality, and related higher healthcare costs are well described (1–4).
The prevalence of malnutrition in the rehabilitation setting ranges from 14–65% worldwide (5). The prevalence data on risk and diagnosed malnutrition in the rehabilitation setting across various ages and rehabilitation disciplines are sparse. A multinational retrospective pooled analysis from the year 2010 found a higher prevalence of malnutrition in the rehabilitation setting (50%) compared with hospital (39%) or nursing home (14%) settings (6).
Malnutrition and sarcopenia frequently co-occur (7). Sarcopenia, a generalized skeletal muscle disorder, is associated with higher risk of falls, disability, and reduced quality of life (8). In a study involving older adults, it was found that malnutrition is a strong predictor of sarcopenia. Malnourished older adults had a 3–4 times higher risk of developing sarcopenia within 4 years compared with those who were well-nourished (9).
A systematic review investigating sarcopenia prevalence in inpatient rehabilitation concluded that sarcopenia might affect half of the patients in rehabilitation but that data are scarce (10). While there are some data on probable and diagnosed sarcopenia prevalence in geriatric rehabilitation (11, 12), data across different rehabilitation disciplines are limited.
Furthermore, few studies have evaluated the impact of rehabilitation on parameters related to malnutrition and sarcopenia such as changes in weight, muscle strength, or functioning. Moreover, there are inconsistent results related to responses to rehabilitation interventions in patients suffering from malnutrition and/or sarcopenia (13, 14).
In view of the limited amount of data, the current study aimed to (i) fill the gap and investigate the prevalence of malnutrition and sarcopenia in the rehabilitation setting on admission across rehabilitation disciplines and (ii) to assess the evolution of selected parameters linked to malnutrition and sarcopenia during inpatient rehabilitation.
Methods
Study design and participants
A multi-centre cross-sectional prevalence study and a longitudinal observational study were conducted in 5 rehabilitation centres in the German-speaking part of Switzerland from November 2022 until April 2023. Female and male adults ≥ 18 years old, treated in the following 6 disciplines of rehabilitation, were included: geriatric, pulmonary, cardiovascular, neurological, musculoskeletal, internal medicine/oncological (both disciplines combined) rehabilitation. The indication for rehabilitation in the respective disciplines is described in the Swiss rehabilitation rate reimbursement documents “ST Reha” (15). As an example, geriatric rehabilitation is indicated following acute illness or accident or chronic progressive multimorbidity with potentially reversible deterioration of functional abilities or impending loss of independence in basal and/or extended activities of daily living. Patients, usually above 75 years, with multimorbidity and presence of at least 2 of the listed geriatric syndromes are transferred to this rehabilitation (15). To ensure equal patient inclusion per discipline, patients were consecutively recruited until the pre-defined sample size for the respective discipline and centre (between 80 and 120 patients per discipline) was achieved.
Exclusion criteria were inability to give informed consent or to follow study procedures (e.g., due to delirium), an estimated life expectancy < 3 months and/or palliative care, isolation (e.g., due to COVID-19 infection), severe dehydration/volume overload (e.g., by visible oedema) or any other medical conditions that would limit execution or validity of a bioelectrical impedance analysis (BIA).
On admission, all patients in the defined disciplines were checked for eligibility. In the case of consent, screenings for malnutrition and sarcopenia were performed within 72 h upon admission. Following positive screening, assessments were conducted within 5 (or if not feasible within 7) days after admission. Patient characteristics such as age, height, weight, polypharmacy (5 or more medications at entry), previous stay in intensive care unit (ICU), comorbidities, and the Functional Independence Measure (FIM) were captured on admission.
For the secondary objective, longitudinal monitoring in the form of a change measure between admission (T1) and after 3 weeks of rehabilitation or within 3 days before discharge if discharge occurs first (earliest after 14 days) (T2) was conducted.
The patient flow and measurements are illustrated in Fig. 1.
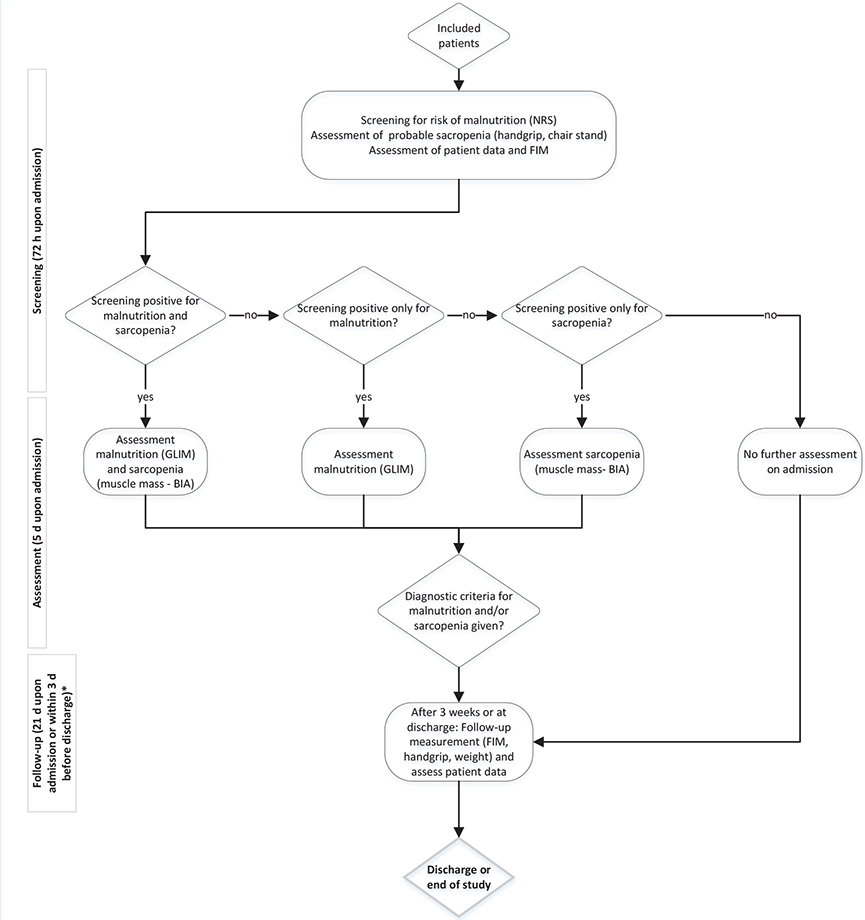
Fig. 1. Patient flow, assessments, and measurements. BIA: Bioelectrical Impedance Analysis; CST: Chair Stand Test; GLIM: Global Leadership Initiative on Malnutrition; HGS: handgrip strength; NRS: Nutritional Risk Score 2002. *If discharge occurred first but at earliest 14 days after admission.
Primary outcome: prevalence of malnutrition and sarcopenia
Diagnosis of malnutrition was made upon positive risk screening. Risk of malnutrition was assessed by the Nutritional Risk Score (NRS 2002) (16). An NRS score of 3 or higher was considered as at risk of malnutrition.
The assessment for diagnosis of malnutrition was determined according to the Global Leadership Initiative on Malnutrition (GLIM) criteria by trained dietitians (17). Diagnosis of malnutrition was confirmed if at least 1 phenotypic (non-volitional weight loss, low BMI, reduced muscle mass) and 1 aetiologic (reduced food intake or assimilation, inflammation, or disease burden) criterion were met. Muscle mass was estimated based on the appendicular skeletal muscle mass index (ASMI) derived by BIA (BIA 101 BIVA Pro device, Akern Italy,) with classic tetrapolar technique (50 kHz). For the evaluation of appendicular skeletal muscle mass (ASMM), the Software BODYGRAM HBO (Version Akern, distributed by Fresenius Kabi AG, Bad Homburg, Germany) was used. Cut-off points for low ASMI, calculated from ASMM/height2, were < 7 kg/m2 for men and < 5.5 kg/m2 for women (15).
Sarcopenia was assessed according to the European Working Group on Sarcopenia in Older People (EWGSOP2) guidelines (8). However, due to the low sensitivity of the Sarcopenia Screening Questionnaire (SARC-F) (8), assessment of muscle strength by handgrip strength (HGS) and Chair Stand Test (CST) for the identification of probable sarcopenia was performed in all patients. Probable sarcopenia was identified when either HGS or CST was low. HGS was measured with the Martin Vigorimeter, balloon size 3 (Gebrüder Martin GmbH & Co. KG, Tuttlingen, Germany). Measurement was repeated 3 times at the dominant hand, recording the highest value. To define low HGS, cut-off points of < 50 kPa for men and < 34 kPa for women > 75 years old, and < 64 kPa for men and < 42 kPa for women ≤ 75 years old were applied (18). The CST was performed using the Five Times Sit-to-Stand Test. A cut-off value of ≥ 15 s or long-term inability to perform the test indicated probable sarcopenia (8).
In case of probable sarcopenia, muscle mass was assessed as mentioned above. Cut-off points for low ASMI were < 7 kg/m2 for men and < 5.5 kg/m2 for women (8).
Diagnosis of sarcopenia was confirmed when muscle strength and muscle mass were low (8).
Secondary outcomes: Changes in nutritional and functional independence parameters between rehabilitation admission and discharge
Weight, HGS, and FIM were collected as follow-up parameters. The FIM is a measure of 18 activities of daily living, separated for motoric and cognitive items and frequently used in rehabilitation. The total FIM score ranges from 18–126 points with higher points reflecting better functionality.
The nutritional and physiotherapy interventions (time in min) and the duration of the rehabilitation stay were recorded to allow additional data analyses. Nutritional therapy was in our study defined as involvement of a dietitian by, e.g., group or individual counselling and education.
Data were collected and managed using REDCap electronic data capture tools (https://project-redcap.org/) hosted at the University of Applied Sciences and Arts Western Switzerland Wallis (19).
Statistical analyses
A precision-based approach was used for the sample size calculation for the prevalence of malnutrition. To estimate a prevalence of 30–50% with a confidence interval width of less than 10%, 320 to 390 patients were required. The sample size was increased to 550 patients to obtain meaningful prevalence data for subgroup analysis (minimum 80 patients for each of the 6 rehabilitation disciplines). Patients who dropped out before the primary outcome assessment had to be replaced.
The study population was characterized using frequencies (n) and percentages (%) for categorical variables, and medians and 25th to 75th interquartile ranges (IQR) for continuous data.
The prevalence of malnutrition, sarcopenia, co-occurrence of both, as well as the risk of malnutrition and probable sarcopenia were reported as percentage (%) with 95% Wilson confidence interval (CI) by discipline. Additionally, patient characteristics were reported by malnutrition and sarcopenia status. Linear mixed models for HGS, weight, and FIM were fitted to the data with timepoint and either diagnosis of malnutrition or sarcopenia as main effects and a time:malnutrition or time:sarcopenia interaction effect respectively. For malnutrition, patients were grouped in a 3-level factor, namely “no risk”, “at risk but no confirmed diagnosis”, and “confirmed diagnosis”. For sarcopenia, patients were grouped in “no signs of sarcopenia”, “probable sarcopenia”, and “confirmed diagnosis”. All models were adjusted for age and sex. Site and ID-site interaction were included as random intercepts to take into account the nested structure of the data. Contrasts of interest – (within-group changes, between-group differences, and time-group interactions) – were computed from the fitted models. Residual analyses were performed to check model assumptions.
All analyses were performed using the R statistical software R version 4.3.1 (R Core Team, 2023; R Foundation for Statistical Compuring, Vienna, Austria), using the arsenal (20), lme4 (21), effects (22), and emmeans packages (23).
Results
Overall, 558 patients were included in the study (see patient flow diagram in Fig. S1). Geriatric, pulmonary, and neurological rehabilitation were the disciplines with the most patients (n = 102, 100, and 100, respectively), followed by musculoskeletal (90), cardiovascular (87), and internal medicine/ oncological (79) rehabilitation (Table I).
Patient characteristics
All patient characteristics are displayed in Table I. Among all participants, 51.8% were male, the median age was 73.0 years, and median BMI 25.1 kg/m2. Polypharmacy was very common and occurred in 88.4% of patients. Previous ICU stay was reported for 31.7% and unknown for 8.6% of patients. Differences between the disciplines were observed with patients in geriatric rehabilitation being oldest (median 86.0 years) and patients in neurological rehabilitation youngest (median 57.5 years). The FIM total score medians ranged between 77.0 (Q1 59.2, Q3 89.0) points in neurological to 99.0 (Q1 84.2, Q3 108.0) points in musculoskeletal rehabilitation.
Prevalence of malnutrition
Depending on discipline, the risk of malnutrition ranged from 33.3% (95% CI 23.8, 44.4%) in cardiovascular patients to 79.7% (95% CI 68.9, 87.6%) in internal medicine/oncological patients (Fig. 2).
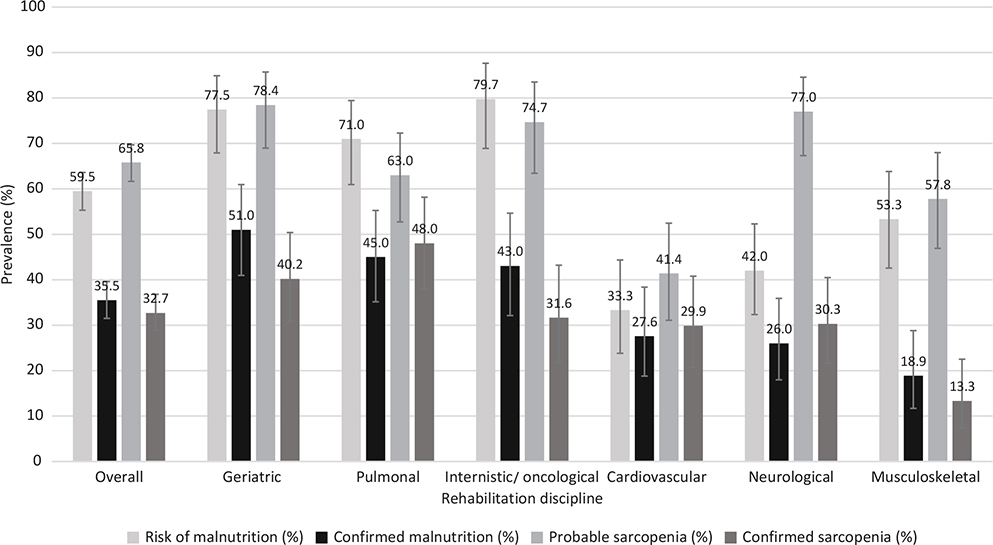
Fig. 2. Prevalence of risk of malnutrition and sarcopenia and diagnosed malnutrition and sarcopenia according to rehabilitation discipline. Malnutrition screened with Nutritional Risk Score (NRS) 2002 and diagnosed according to Global Leadership Initiative on Malnutrition (GLIM) criteria, sarcopenia screened with handgrip strength (HGS) and Chair Stand Test (CST) and diagnosed according to EWGSOP2 criteria, data with mean and 95% confidence interval.
The overall prevalence of malnutrition in the study participants was 35.5% (95% CI 31.5, 39.6%) (Fig. 2). The prevalence rates were 51.0% (95% CI 40.9, 60.9%) for geriatric, 45.0% (95% CI 35.1, 55.2%) for pulmonary, 43.0% (95% CI 32.1, 54.6%) for internal medicine/oncological, 27.6% (95% CI 18.8, 38.4%) for cardiovascular, 26.0% (95% CI 18.0, 35.9%) for neurological, and 18.9% (95% CI 11.7, 28.8%) musculoskeletal rehabilitation, respectively (Fig. 2). Patients with diagnosis of malnutrition were older with a median age of 76.0 vs 69.0 years, had a lower BMI (22.4 kg/m2 vs 26.7 kg/m2) and a lower FIM total score (Table II). Sex and previous stay in the ICU were not different between these 2 groups.
| Characteristics | Diagnosis malnutrition | Diagnosis sarcopenia | ||
| No (n = 360) | Yes (n = 198) | No (n = 375)* | Yes* (n = 182) | |
| General characteristics | ||||
| Age, years, median (Q1, Q3) | 69.0 (58.0, 79.0) | 76.0 (69.0, 84.0) | 71.0 (58.0, 79.5) | 76.0 (68.0, 84.0) |
| Sex male, n (%) | 185 (51.4) | 104 (52.5) | 188 (50.1) | 101 (55.5) |
| BMI, kg/m2, median (Q1, Q3) | 26.7 (23.9, 29.9) | 22.4 (19.9, 25.3) | 26.6 (23.9, 29.8) | 22.2 (19.8, 24.9) |
| Previous stay at ICU Yes, n (%) | 109 (30.3) | 68 (34.3) | 118 (31.5) | 59 (32.4) |
| Previous stay at ICU Unknown, n (%) | 34 (9.4) | 14 (7.1) | 36 (9.6) | 11 (6.0) |
| Polypharmacy, n (%) | 309 (85.8) | 184 (92.9) | 329 (87.7) | 163 (89.6) |
| Comorbidities | ||||
| Hypertension, n (%) | 138 (38.3) | 62 (31.3) | 153 (40.8) | 47 (25.8) |
| Coronary heart disease, n (%) | 55 (15.3) | 49 (24.7) | 65 (17.3) | 39 (21.4) |
| Acute respiratory tract infections, n (%) | 14 (3.9) | 20 (10.1) | 18 (4.8) | 16 (8.8) |
| Chronic respiratory disease, n (%) | 33 (9.2) | 24 (12.1) | 39 (10.4) | 18 (9.9) |
| Gastrointestinal disease, n (%) | 32 (8.9) | 20 (10.1) | 34 (9.1) | 18 (9.9) |
| Chronic renal failure, n (%) | 48 (13.3) | 38 (19.2) | 52 (13.9) | 34 (18.7) |
| Diabetes, n (%) | 59 (16.4) | 38 (19.2) | 61 (16.3) | 36 (19.8) |
| Osteoporosis, n (%) | 36 (10.0) | 21 (10.6) | 41 (10.9) | 16 (8.8) |
| Oncological diseases, n (%) | 45 (12.5) | 32 (16.2) | 49 (13.1) | 28 (15.4) |
| None of the above, n (%) | 129 (35.8) | 61 (30.8) | 123 (32.8) | 66 (36.3) |
| Number of comorbidities, median (Q1, Q3) | 1.0 (1.0, 2.0) | 1.0 (1.0, 3.0) | 1.0 (1.0, 2.0) | 1.0 (1.0, 2.0) |
| Assessments | ||||
| FIM cognition score, median (Q1, Q3) | 30.0 (27.0, 32.0) | 28.0 (25.0, 31.0) | 30.0 (27.0, 32.0) | 28.0 (25.0, 30.0) |
| FIM motor score, median (Q1, Q3) | 65.5 (55.0, 73.0) | 62.5 (51.2, 70.0) | 66.0 (55.0, 74.0) | 61.0 (49.0, 69.0) |
| FIM total score, median (Q1, Q3) | 95.0 (82.0, 104.0) | 90.5 (76.0, 100.0) | 95.0 (83.0, 105.0) | 89.0 (73.0, 99.0) |
| *Total number of included patients n = 558, for sarcopenia diagnosis measurements 1 patient missing. Values indicate median (interquartile ranges) for continuous and counts (proportions) for frequency data. Q1, Q3: Interquartile ranges; BMI: body mass index; ICU: intensive care unit; FIM: Functional Independence Measure. |
||||
Prevalence of sarcopenia
Probable sarcopenia ranged, depending on discipline, between 41.4% (95% CI 31.1, 52.4%) in cardiovascular patients and 78.4% (95% CI 69.0, 85.7%) in geriatric patients (Fig. 2).
The overall prevalence of confirmed sarcopenia was 32.7% (95% CI 28.8, 36.8%) (Fig. 2). Patients in pulmonary rehabilitation had the highest prevalence of sarcopenia of 48.0% (95% CI 38.0, 58.2%), followed by geriatric rehabilitation with 40.2% (95% CI 30.8, 50.4%), and internal medicine/oncological rehabilitation with 31.6% (95% CI 21.9, 43.2%) (Fig. 2). In cardiovascular and neurological rehabilitation, almost 1 in 3 patients was diagnosed with sarcopenia (29.9% and 30.3%, respectively), while in musculoskeletal rehabilitation, the prevalence was 13.3% (95% CI 7.4, 22.5%). Similar to the malnutrition diagnosis, patients with sarcopenia diagnosis had a higher median age (76.0 vs 71.0 years), a lower BMI (22.2 kg/m2 vs 26.6 kg/m2) and lower FIM cognition, motor, and total score than patients without diagnosis (Table II). Sex and previous stay in the ICU did not differ between patients with or without diagnosis.
Co-occurrence of risk and diagnosis of malnutrition and sarcopenia
Co-occurrence of malnutrition and sarcopenia was observed in 22.4% of patients (Fig. 3). Diagnosed sarcopenia without risk of malnutrition was observed in 7.5% of patients and, equally, diagnosed malnutrition without probable sarcopenia in 7.5% of patients.

Fig. 3. Co-occurrence of malnutrition and sarcopenia (%).
Changes in muscle strength, bodyweight, and functional independence between rehabilitation admission and discharge
During rehabilitation on average, patients increased their HGS; patients with no malnutrition by 2.02 kPa (95% CI 0.86, 3.19), patients at risk by 3.08 kPa (95% CI 1.57, 4.58), and patients with diagnosed malnutrition by 3.82 kPa (95% CI 2.57, 5.07), respectively (Table III, Fig. 4). Patients at no risk and patients with a diagnosis of malnutrition did not change their weight between admission and discharge while patients at risk of malnutrition lost 1.14 kg (95% CI –1.64, –0.63) (Table III, Fig. 4). The FIM score did increase by 17.0 points (95% CI 14.9, 19.1) in patients at risk of malnutrition, by 16.8 points (95% CI 15.1, 18.5) in patients with diagnosed malnutrition, and by 14.8 points (95% CI 13.2, 16.4) in patients at no risk. In particular the FIM motor score increased (data not shown) and contributed most to the increase in total score. Both on admission and on discharge, malnourished patients still had a significantly lower HGS, weight, and FIM compared with patients without diagnosis (Table III, Fig. 4). Changes in HGS over the course of rehabilitation were higher in patients diagnosed with malnutrition compared with those at no risk of malnutrition (p < 0.01) and higher in patients with probable sarcopenia compared with no signs or diagnosed sarcopenia (p < 0.01). Patients at risk of malnutrition had a higher change in weight compared with the other groups (no risk, diagnosed) (p < 0.01). Changes in the FIM did not differ between groups for either malnutrition or sarcopenia.
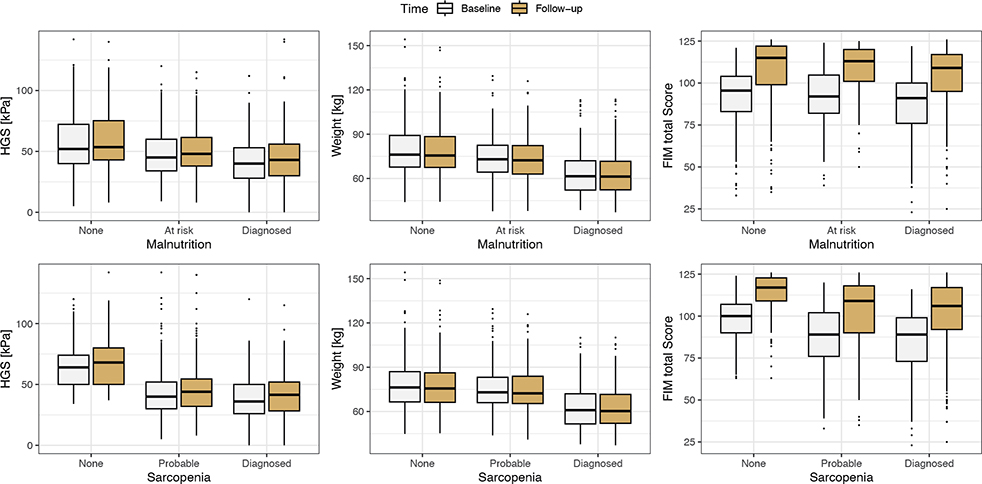
Fig. 4. Changes in handgrip strength (HGS), bodyweight, and Functional Independence Measure (FIM) between admission and discharge in patients with no risk, risk of, and diagnosis of malnutrition and no risk, probable, and diagnosed sarcopenia. Descriptive statistics with mean and 95% confidence interval.
In patients with sarcopenia, similar change trends were observed. On average, all patients increased their HGS (Table III, Fig. 4). Weight remained stable in patients with no or diagnosed sarcopenia but decreased in patients with probable sarcopenia by 0.59 kg (95% CI –1.02, –0.15). The FIM increased on average in all patients. On discharge, sarcopenic patients had a lower HGS, weight, and FIM than patients without sarcopenia (p < 0.01).
Nutritional counselling during rehabilitation
Around half of the of patients (49.1%) received nutritional therapy including education in the form of group counselling (Table IV). Approximately one-third of patients (37.3%) at risk of malnutrition and one-third of patients diagnosed with malnutrition (35.4%) received no nutritional therapy, while 27.4% received nutritional therapy for other reasons. Most patients who received nutritional counselling received up to 90 min of counselling over 3 weeks.
| Minutes of nutritional therapy | |||
| Factor | No indication | Probable/at risk | Diagnosed |
| Malnutrition | n = 226 | n = 134 | n = 198 |
| None | 164 (72.6%) | 50 (37.3%) | 70 (35.4%) |
| up to 90 min | 36 (15.9%) | 48 (35.8%) | 74 (37.4%) |
| 91–180 min | 23 (10.2%) | 30 (22.4%) | 46 (23.2%) |
| > 180 min | 3 (1.3%) | 6 (4.5%) | 8 (4.0%) |
| Sarcopenia | n = 191 | n = 184 | n = 182 |
| None | 102 (53.4%) | 90 (48.9%) | 91 (50.0%) |
| up to 90 min | 46 (24.1%) | 59 (32.1%) | 53 (29.1%) |
| 91–180 min | 38 (19.9%) | 29 (15.8%) | 32 (17.6%) |
| > 180 min | 5 (2.6%) | 6 (3.3%) | 6 (3.3%) |
| 1. n (%). | |||
Likewise, the majority of patients with probable sarcopenia (48.9%) and those with diagnosed sarcopenia (50.0%) did not receive nutritional counselling (Table IV). If counselling occurred, the duration was most often up to a total of 90 min (32.1% and 29.1%, respectively).
DISCUSSION
Our multi-centre study showed a varying but overall high prevalence of malnutrition and sarcopenia in all rehabilitation disciplines, which requires clinical attention. While HGS and FIM increase during rehabilitation, changes are small and indicate that patients diagnosed with malnutrition and sarcopenia are discharged while still in a malnourished and/or sarcopenic state. Furthermore, bodyweight decreases in patients at risk of malnutrition, requiring adequate follow-up after discharge.
Prevalence of malnutrition and sarcopenia
In general, variations in screening and assessment methods and definitions of malnutrition and sarcopenia pose challenges to comparing results from prevalence studies. In our study, using the screening tool NRS 2002, 60% of all patients and up to 80% in geriatric and internal medicine/oncological patients were found to be at risk of malnutrition. To our knowledge, no other study has analysed the prevalence of malnutrition across rehabilitation disciplines. The highest prevalence of malnutrition of 51% in our study was observed in the geriatric population and within previously reported ranges (12, 24–26). Age is a known risk factor for malnutrition (27). In our study, according to the Swiss rehabilitation classification, internal medicine and oncological patients were pooled and prevalence of malnutrition was high at 43%. Data in the acute hospital setting report a risk and prevalence of malnutrition in various cancer patients of between 24% and 51% (28–30).
Our prevalence data on malnutrition in pulmonary rehabilitation were 45.0% and thus similar to patients with COPD in pulmonary rehabilitation, categorized with a rate of 46% as malnourished (assessed by the PG-SGA) (31), while in another study in COPD patients, only 22.6% were malnourished assessed by GLIM criteria (32). Differences in degree of obstruction, besides differences in assessment method and patient population (not all patients in our study had COPD), might explain the variation in results.
Patients undergoing cardiovascular rehabilitation in our study had a prevalence of malnutrition of 27.6% and a risk of 33.3%, lower than in a prospective study in cardiac rehabilitation with a risk of malnutrition of 42%, measured by Mini Nutritional Assessment (33). Neurological patients had a prevalence of malnutrition of 26.0%, comparable to a study in patients after acute stroke (34).
The prevalence of probable (74%) and confirmed (40.2%) sarcopenia in geriatric patients in our study was substantially higher than the prevalence found in a Swiss cohort of geriatric acute and rehabilitation patients (24.6% and 22.6% respectively) (11) or an Australian study of geriatric rehabilitation patients (19%) (12). While we defined probable sarcopenia as either reduced HGS or CST, the other studies identified patients at risk solely on the basis of low HGS (11,12). In our study, 51 geriatric patients had a low HGS and 72 a low CST (data not shown). This could explain higher numbers of probable and diagnosed sarcopenia. Other studies found that screening with CST identified up to twice as many cases of probable sarcopenia compared with HGS (35,36). According to the EWGSOP2 criteria, HGS and CST are recommended to identify low muscle strength (8). Our study confirms that both measures are valuable to identify patients with low muscle strength.
Studies in other disciplines with varying methods showed a somewhat higher prevalence of sarcopenia of 56% (95% CI 0.46–0.65) (5 studies after hip fracture and 1 after general deconditioning) (10) and 47.9% (older neurological rehabilitation patients) (37), potentially due to different patient populations, disease severity, or measurement cut-offs.
The co-occurrence of malnutrition and sarcopenia at 32.4% in geriatric rehabilitation patients in our study was higher than in geriatric rehabilitation patients in other studies, ranging from 13–23.5% (12, 38, 39), potentially resulting from different thresholds and using HGS solely for the assessment of probable sarcopenia.
Changes in weight, HGS, and FIM during rehabilitation
While in our study bodyweight was stable in patients not at risk and those with a diagnosis of malnutrition, it decreased slightly in those at risk of malnutrition. The small difference of on average 1.1 kg (95% CI –1.64;–0.63) suggests a risk that patients continue to lose weight and become malnourished after discharge. Other studies emphasize the importance of targeting patients at risk of malnutrition by early nutritional interventions (3, 40). In a meta-analysis, the risk of mortality increased in adults ≥ 65 years of age and a BMI < 22, indicating that, in particular for older adults, weight management and reduction of underweight/low weight is of high importance (41).
Handgrip strength is a supportive measure in the determination of malnutrition, a widely accepted simple and reliable measurement associated with nutritional status, and reduced HGS is an indicator of increased postoperative complications, increased length of hospitalization, higher re-hospitalization rate, and decreased physical status (42–44). It is also considered a sensitive parameter and reacts faster to metabolic changes compared with bodyweight (42). An inverse association between HGS and malnutrition was shown in some studies (45, 46). In our study, HGS increased on average in all patients during rehabilitation. However, the changes were small and of limited clinical relevance, but in line with previous studies with interventions over a similar short time period (45).
The functional independence measure, in particular the motor score, increased on average in all patients in our study during rehabilitation but remained lower in patients diagnosed with malnutrition and/or sarcopenia. This finding is in agreement with studies showing lower FIM values in patients with sarcopenia on rehabilitation discharge compared with patients without (47–49). Furthermore, an inverse association of sarcopenia with FIM on discharge, worse recovery of FIM during rehabilitation, and higher mortality in sarcopenic patients was shown (49).
In our study, while almost all patients received a physiotherapy intervention (97.3%, data not shown) during rehabilitation, in only 49.1% has a dietitian been involved in the rehabilitation programme. It is possible that patients received nutritional interventions such as prescription of enriched meals and/or oral nutritional supplements without consultation with a dietitian. However, this high rate shows that stronger emphasis should be placed on institutional processes for nutritional management to prevent malnutrition. A study in France showed that only 57.6% of malnourished cancer patients received nutritional support (29), confirming the lacking nutritional intervention of our study. A recent study investigated nutritional care practices in geriatric rehabilitation across Europe (50). According to the survey, in Central Europe 98% of respondents indicated that they had an individual dedicated to nutritional care but only 67% indicated that the individual has sufficient time to dedicate to patients, mainly due to shortage of staff to perform screening and nutritional interventions.
Raised awareness among health professionals, adequate training, and availability of equipment to perform the measurements, institutional support, interprofessional collaboration, and financial reimbursement are important factors to prevent lack of diagnosis and lack of interventions for malnutrition and sarcopenia and should be enforced (51, 52). Assessment of the Global Malnutrition Composite Score could support institutions to adequately screen for malnutrition, plan therapeutic interventions, and document the findings (53).
Our study has several limitations. While severe dehydration or hyperhydration have been established as exclusion criteria to prevent bias in muscle mass and bodyweight assessments, the potential for overhydration in some patients remains a concern. The lack of easily applicable methods and clear thresholds complicates the accurate determination of overhydration and could have led to underestimation of muscle mass and overestimation of bodyweight and BMI. Evaluation of bioimpedance vector analysis would have been useful to reduce this potential bias. We did not gather comprehensive details on diagnoses and other disease-specific characteristics, potentially limiting the external validity of our study cohort. We also did not capture nutritional intake and nutritional interventions other than counselling to further explain the effects on weight and muscle strength.
The investigators identified further research needs. The long-term follow-up of malnourished and/or sarcopenic patients pre- and post-rehabilitation could help to improve patient care. Institutional needs and opportunities to improve nutritional care in various rehabilitation settings are another research area of interest. While physiotherapy is regularly prescribed in rehabilitation, nutrition therapy has had a lower priority so far, although it should go hand in hand with physiotherapy interventions for optimal care in patients at risk of malnutrition or sarcopenia.
In conclusion, our study underscores the notable prevalence of malnutrition and sarcopenia among patients undergoing inpatient rehabilitation. Across various rehabilitation disciplines, nearly half of all patients are diagnosed with malnutrition, sarcopenia, or both. Even after successful rehabilitation, a substantial number of patients are discharged with low bodyweight and low values of HGS and FIM. Consequently, suitable screening methods and nutritional interventions should be incorporated into the routine practices of rehabilitation clinics to proactively address and mitigate further nutritional and muscular decline. Continued long-term individual nutritional support after discharge is required to combat negative health consequences.
ACKNOWLEDGEMENTS
All participants of the study are thanked cordially for supporting this research project.
The authors acknowledge Klazine van der Horst for support during the acquisition and project duration. The authors acknowledge Silvia Kurmann for reviewing and proofreading activity. Joya Lüthi is thanked for help with the manuscript formatting. The authors acknowledge Adrian Zadory, Livia Schwertfeger, Lynn Grob who collected data.
Ethical clearance: The study was carried out following the Declaration of Helsinki, and was approved by the Cantonal Ethics Committee Bern, Switzerland (project ID 2022-01098, approval date: 05/07/2022). Informed consent was obtained from all subjects.
Trial details: The study was registered at ClinicalTrials.gov with the registration number NCT05639985.
REFERENCES
- Felder S, Lechtenboehmer C, Bally M, Fehr R, Deiss M, Faessler L, et al. Association of nutritional risk and adverse medical outcomes across different medical inpatient populations. Nutrition 2015; 31: 1385–1393. https://doi.org/10.1016/j.nut.2015.06.007
- Khalatbari-Soltani S, Marques-Vidal P. The economic cost of hospital malnutrition in Europe: a narrative review. Clin Nutr ESPEN 2015; 10: e89–e94. https://doi.org/10.1016/j.clnesp.2015.04.003
- Schuetz P, Fehr R, Baechli V, Geiser M, Deiss M, Gomes F, et al. Individualised nutritional support in medical inpatients at nutritional risk: a randomised clinical trial. Lancet 2019; 393: 2312–2321. https://doi.org/10.1016/S0140-6736(18)32776-4
- Sánchez-Rodríguez D, de Meester D, Minon L, Claessens M, Gümüs N, Lieten S, et al. Association between malnutrition assessed by the global leadership initiative on malnutrition criteria and mortality in older people: a scoping review. Int J Environ Res 2023; 20: 5320. https://doi.org/10.3390/ijerph20075320
- Marshall S. Protein-energy malnutrition in the rehabilitation setting: evidence to improve identification. Maturitas 2016; 86: 77–85. https://doi.org/10.1016/j.maturitas.2016.01.014
- Kaiser MJ, Bauer JM, Rämsch C, Uter W, Guigoz Y, Cederholm T, et al. Frequency of malnutrition in older adults: a multinational perspective using the mini nutritional assessment. J Am Geriatr Soc 2010; 58: 1734–1738. https://doi.org/10.1111/j.1532-5415.2010.03016.x
- Ligthart-Melis GC, Luiking YC, Kakourou A, Cederholm T, Maier AB, de van der Schueren MAE. Frailty, sarcopenia, and malnutrition frequently (co-)occur in hospitalized older adults: a systematic review and meta-analysis. J Am Med Dir Assoc 2020; 21: 1216–1228. https://doi.org/10.1016/j.jamda.2020.03.006
- Cruz-Jentoft AJ, Bahat G, Bauer J, Boirie Y, Bruyère O, Cederholm T, et al. Sarcopenia: revised European consensus on definition and diagnosis. Age Ageing 2019; 48: 16–31. https://doi.org/10.1093/ageing/afy169
- Beaudart C, Sanchez-Rodriguez D, Locquet M, Reginster JY, Lengelé L, Bruyère O. Malnutrition as a strong predictor of the onset of sarcopenia. Nutrients 2019; 11: 2883. https://doi.org/10.3390/nu11122883
- Churilov I, Churilov L, MacIsaac RJ, Ekinci EI. Systematic review and meta-analysis of prevalence of sarcopenia in post acute inpatient rehabilitation. Osteoporos Int 2018; 29: 805–812. https://doi.org/10.1007/s00198-018-4381-4
- Bertschi D, Kiss CM, Beerli N, Kressig RW. Sarcopenia in hospitalized geriatric patients: insights into prevalence and associated parameters using new EWGSOP2 guidelines. Eur J Clin Nutr 2021; 75: 653–660. https://doi.org/10.1038/s41430-020-00780-7
- Verstraeten LMG, van Wijngaarden JP, Pacifico J, Reijnierse EM, Meskers CGM, Maier AB. Association between malnutrition and stages of sarcopenia in geriatric rehabilitation inpatients: RESORT. Clin Nutr 2021; 40: 4090–4096. https://doi.org/10.1016/j.clnu.2021.02.007
- Sánchez-Rodríguez D, Marco E, Miralles R, Nica Fayos M, Mojal S, Alvarado M, et al. Sarcopenia, physical rehabilitation and functional outcomes of patients in a subacute geriatric care unit. Arch Gerontol Geriatr 2014; 59:39–43. https://doi.org/10.1016/j.archger.2014.02.009
- Churilov I, Churilov L, Brock K, Murphy D, MacIsaac RJ, Ekinci EI. The association between sarcopenia and functional improvement in older and younger patients who completed inpatient rehabilitation: a prospective cohort study. Front Rehabil Sci 2021; 2: 692896. https://doi.org/10.3389/fresc.2021.692896
- FMH (Foederatio Medicorum Helveticorum, Berufsverband der Schweizer Ärztinnen und Ärzte). ST Reha – Personelle und strukturelle Minimalanforderungen (Referenzdokumente). 2023 [cited 2023 Oct 4]. Available from: https://www.fmh.ch/themen/stationaere-tarife/st-reha.cfm?#minimal
- Kondrup J, Allison SP, Elia M, Vellas B, Plauth M. ESPEN Guidelines for Nutrition Screening 2002. Clin Nutr 2003; 22: 415–421. https://doi.org/10.1016/S0261-5614(03)00098-0
- Cederholm T, Jensen GL, Correia MITD, Gonzalez MC, Fukushima R, Higashiguchi T, et al. GLIM criteria for the diagnosis of malnutrition: a consensus report from the global clinical nutrition community. Clin Nutr 2019; 38: 1–9. https://doi.org/10.1016/j.clnu.2018.08.002
- Gagesch M, Wieczorek M, Abderhalden LA, Lang W, Freystaetter G, Armbrecht G, et al. Grip strength cut-points from the Swiss DO-HEALTH population. Eur Rev Aging Phys Act 2023; 20: 13. https://doi.org/10.1186/s11556-023-00323-6
- Harris PA, Taylor R, Minor BL, Elliott V, Fernandez M, O’Neal L, et al. REDCap Consortium. The REDCap consortium: building an international community of software partners. J Biomed Inform 2019; 95: 103208. https://doi.org/10.1016/j.jbi.2019.103208
- Heinzen E, Sinnwell J, Atkinson E, Gunderson T, Dougherty G. arsenal: an arsenal of ‘R’ functions for large-scale statistical summaries. R package version 3.6.3, 2021 [cited 2023 Oct 4]. Available from: https://cran.r-project.org/web/packages/arsenal/index.html
- Bates D, Mächler M, Bolker B, Walker S. Fitting linear mixed-effects models using lme4. J Stat Soft; 67: 1–48. https://doi.org/10.18637/jss.v067.i01
- Fox J, Weisberg S. An R companion to applied regression. 3rd ed. Thousand Oaks, CA: Sage; 2019.
- Lenth R. emmeans: estimated marginal means, aka least-squares means. R package version 1.8.6; 2023 [cited 2023 Oct 4]. Available from: https://CRAN.R-project.org/package = emmeans
- Marshall S, Young A, Bauer J, Isenring E. Malnutrition in geriatric rehabilitation: prevalence, patient outcomes, and criterion validity of the scored patient-generated subjective global assessment and the mini nutritional assessment. J Acad Nutr Diet 2016; 116: 785–794. https://doi.org/10.1016/j.jand.2015.06.013
- Shimizu A, Maeda K, Honda T, Ishida Y, Ueshima J, Nagami S, et al. Comparison between the Global Leadership Initiative on Malnutrition and the European Society for Clinical Nutrition and Metabolism definitions for the prevalence of malnutrition in geriatric rehabilitation care. Geriatr Gerontol Int 2020; 20: 1221–1227. https://doi.org/10.1111/ggi.14072
- Wojzischke J, van Wijngaarden J, van den Berg C, Cetinyurek-Yavuz A, Diekmann R, Luiking Y, et al. Nutritional status and functionality in geriatric rehabilitation patients: a systematic review and meta-analysis. Eur Geriatr Med 2020; 11: 195–207. https://doi.org/10.1007/s41999-020-00294-2
- Norman K, Haß U, Pirlich M. Malnutrition in older adults: recent advances and remaining challenges. Nutrients 2021; 13: 2764. https://doi.org/10.3390/nu13082764
- Yin L, Lin X, Li N, Zhang M, He X, Liu J, et al. Evaluation of the global leadership initiative on malnutrition criteria using different muscle mass indices for diagnosing malnutrition and predicting survival in lung cancer patients. J Parenter Enteral Nutr 2021; 45: 607–617. https://doi.org/10.1002/jpen.1873
- Hébuterne X, Lemarié E, Michallet M, de Montreuil CB, Schneider SM, Goldwasser F. Prevalence of malnutrition and current use of nutrition support in patients with cancer. J Parenter Enteral Nutr 2014; 38: 196–204. https://doi.org/10.1177/0148607113502674
- Muscaritoli M, Lucia S, Farcomeni A, Lorusso V, Saracino V, Barone C, et al. Prevalence of malnutrition in patients at first medical oncology visit: the PreMiO study. Oncotarget 2017; 8: 79884–79896. https://doi.org/10.18632/oncotarget.20168
- Ter Beek L, van der Vaart H, Wempe JB, Krijnen WP, Roodenburg JLN, van der Schans CP, et al. Coexistence of malnutrition, frailty, physical frailty and disability in patients with COPD starting a pulmonary rehabilitation program. Clin Nutr 2020; 39: 2557–2563. https://doi.org/10.1016/j.clnu.2019.11.016
- Kaluzniak-Szymanowska A, Krzyminska-Siemaszko R, Deskur-Smielecka E, Lewandowicz M, Kaczmarek B, Wieczorowska-Tobis K. Malnutrition, sarcopenia, and malnutrition-sarcopenia syndrome in older adults with COPD. Nutrients 2021; 14: 44. https://doi.org/10.3390/nu14010044
- Passantino A, Guida P, Rizzo C, Carbonara R, Ruggieri R, Scrutinio D. Malnutrition in patients admitted to in-hospital cardiac rehabilitation: clinical correlates and association with mortality. Monaldi Arch Chest Dis 2021; 92. https://doi.org/10.4081/monaldi.2021.1960
- Nozoe M, Yamamoto M, Masuya R, Inoue T, Kubo H, Shimada S. Prevalence of malnutrition diagnosed with GLIM criteria and association with activities of daily living in patients with acute stroke. J Stroke Cerebrovasc Dis 2021; 30: 105989. https://doi.org/10.1016/j.jstrokecerebrovasdis.2021.105989
- Vágnerová T, Michálková H, Dvořáčková O, Topinková E. Comparison between EWGSOP1 and EWGSOP2 criteria and modelling of diagnostic algorithm for sarcopenic obesity in over 70 years old patients. Eur Geriatr Med 2022; 13: 641–648. https://doi.org/10.1007/s41999-021-00602-4
- Johansson J, Strand BH, Morseth B, Hopstock LA, Grimsgaard S. Differences in sarcopenia prevalence between upper-body and lower-body based EWGSOP2 muscle strength criteria: the Tromsø study 2015–2016. BMC Geriatr 2020; 20: 461. https://doi.org/10.1186/s12877-020-01860-w
- Brugliera L, Giordani A, D’Angelo G, Trimarchi C, Villa G, Yen TY, et al. Prevalence of sarcopenia in older patients in rehabilitation wards. J Pers Med 2023; 13: 960. https://doi.org/10.3390/jpm13060960
- Nishioka S, Matsushita T, Yamanouchi A, Okazaki Y, Oishi K, Nishioka E, et al. Prevalence and associated factors of coexistence of malnutrition and sarcopenia in geriatric rehabilitation. Nutrients 2021; 13: 3745. https://doi.org/10.3390/nu13113745
- Sánchez-Rodríguez D, Marco E, Ronquillo-Moreno N, Miralles R, Vázquez-Ibar O, Escalada F, et al. Prevalence of malnutrition and sarcopenia in a post-acute care geriatric unit: applying the new ESPEN definition and EWGSOP criteria. Clin Nutr 2017; 36: 1339–1344. https://doi.org/10.1016/j.clnu.2016.08.024
- Efthymiou A, Hersberger L, Reber E, Schönenberger KA, Kägi-Braun N, Tribolet P, et al. Nutritional risk is a predictor for long-term mortality: 5-year follow-up of the EFFORT trial. Clin Nutr 2021; 40: 1546–1554. https://doi.org/10.1016/j.clnu.2021.02.032
- Winter JE, MacInnis RJ, Nowson CA. The influence of age the BMI and all-cause mortality association: a meta-analysis. J Nutr Health Aging 2017; 21: 1254–1258. https://doi.org/10.1007/s12603-016-0837-4
- Norman K, Stobäus N, Gonzalez CM, Schulzke JD, Pirlich M. Hand grip strength: outcome predictor and marker of nutritional status. Clin Nutr 2011; 30: 135–142. https://doi.org/10.1016/j.clnu.2010.09.010
- Kaegi-Braun N, Tribolet P, Baumgartner A, Fehr R, Baechli V, Geiser M, et al. Value of handgrip strength to predict clinical outcomes and therapeutic response in malnourished medical inpatients: secondary analysis of a randomized controlled trial. Am J Clin Nutr 2021; 114: 731–740. https://doi.org/10.1093/ajcn/nqab042
- Olguín T, Bunout D, de la Maza MP, Barrera G, Hirsch S. Admission handgrip strength predicts functional decline in hospitalized patients. Clin Nutr ESPEN 2017; 17: 28–32. https://doi.org/10.1016/j.clnesp.2016.12.001
- Flood A, Chung A, Parker H, Kearns V, O’Sullivan TA. The use of hand grip strength as a predictor of nutrition status in hospital patients. Clin Nutr 2014; 33: 106–114. https://doi.org/10.1016/j.clnu.2013.03.003
- Xie L, Jiang J, Fu H, Zhang W, Yang L, Yang M. Malnutrition in relation to muscle mass, muscle quality, and muscle strength in hospitalized older adults. J Am Med Dir Assoc 2022; 23: 722–728. https://doi.org/10.1016/j.jamda.2021.11.025
- Kanaya Y, Inoue H, Sawamura H, Hoshino Y, Takeshita K. Rehabilitation after hip fracture surgery improves physical and cognitive function in patients with or without sarcopenia. Geriatr Orthop Surg Rehabil 2023; 14: 215145932311819. https://doi.org/10.1177/21514593231181988
- Yamasaki Y, Honda Y, Inoue-Umezaki M, Makieda R, Endo Y, Hanayama K, et al. The association between sarcopenia and functional outcomes in patients undergoing convalescent rehabilitation. J Med Invest 2023; 70: 457–463. https://doi.org/10.2152/jmi.70.457
- Yoshimura Y, Wakabayashi H, Bise T, Nagano F, Shimazu S, Shiraishi A, et al. Sarcopenia is associated with worse recovery of physical function and dysphagia and a lower rate of home discharge in Japanese hospitalized adults undergoing convalescent rehabilitation. Nutrition 2019; 61: 111–118. https://doi.org/10.1016/j.nut.2018.11.005
- Everink IHJ, Grund S, Benzinger P, de Vries A, Gordon AL, van Wijngaarden JP, et al. Nutritional care practices in geriatric rehabilitation facilities across Europe: a cross-sectional study. J Clin Med 2023; 12: 2918. https://doi.org/10.3390/jcm12082918
- Reijnierse EM, de van der Schueren MAE, Trappenburg MC, Doves M, Meskers CGM, Maier AB. Lack of knowledge and availability of diagnostic equipment could hinder the diagnosis of sarcopenia and its management. PLoS One 2017; 12: e0185837. https://doi.org/10.1371/journal.pone.0185837
- Uhlmann K, Schaller F, Lehmann U. Current practice of assessing and monitoring muscle strength, muscle mass and muscle function during nutritional care by dietitians in Switzerland: an online survey. Nutrients 2022; 14: 1741. https://doi.org/10.3390/nu14091741
- Valladares AF, McCauley SM, Khan M, D’Andrea C, Kilgore K, Mitchell K. Development and evaluation of a global malnutrition composite score. J Acad Nutr Diet 2022; 122: 251–258. https://doi.org/10.1016/j.jand.2021.02.002