ORIGINAL REPORT
PHYSICAL ACTIVITY AND SEDENTARY BEHAVIOUR CHANGES DURING AND AFTER CARDIAC REHABILITATION: CAN PATIENTS BE CLUSTERED?
Marlou M. LIMPENS, MSc1, Rita J.G VAN DEN BERG, PhD2, Iris DEN UIJL, PhD2,3, Madoka SUNAMURA, PhD3, Trudy VOORTMAN, PhD1,4, Eric BOERSMA, PhD5 and Nienke TER HOEVE, PhD2,3
From the 1Department of Epidemiology, 2Department of Rehabilitation Medicine, 3Capri Cardiac Rehabilitation, Rotterdam, 4Division of Human Nutrition and Health, Wageningen University & Research, Wageningen, The Netherlands and 5Department of Cardiology, Thoraxcenter, Erasmus MC, University Medical Centre Rotterdam, Rotterdam
Objective: To identify clusters of patients according to changes in their physical behaviour during and after cardiac rehabilitation, and to predict cluster membership.
Methods: The study included 533 patients (mean age 57.9 years; 18.2% females) with a recent acute coronary syndrome who participated in a 12-week multi-disciplinary cardiac rehabilitation programme, within a cohort study design. Physical behaviour (light physical activity, moderate-to vigorous physical activity, step count, and sedentary behaviour) was measured using accelerometry at 4 time-points. To identify clusters of patients according to changes in physical behaviour during and after cardiac rehabilitation, latent class trajectory modelling was applied. Baseline factors to predict cluster membership were assessed using multinomial logistic regression.
Results: During and after cardiac rehabilitation, 3 separate clusters were identified for all 4 physical behaviour outcomes: patients with steady levels (comprising 68–83% of the patients), and improving (6–21%) or deteriorating (4–23%) levels. Main predictor for membership to a specific cluster was baseline physical behaviour. Patients with higher starting physical behaviour were more likely to be a member of clusters with deteriorating levels.
Conclusion: Separate clusters of physical behaviour changes during and after cardiac rehabilitation could be identified. Clusters were mainly distinguished by baseline physical behaviour level.
LAY ABSTRACT
Physical behaviour is a construct including both physical activity and sedentary behaviour. Healthy levels of physical behaviour are important for cardiac patients. Cardiac rehabilitation programs are designed to promote a heart-healthy lifestyle for this group. Nevertheless, not all patients perform sufficient physical activity after cardiac rehabilitation. It is important to identify patients at risk for disappointing physical behaviour outcomes at an early stage to provide additional care. Outcomes of the current study show that cardiac patients can be clustered according to their change in physical behavior during and after cardiac rehabilitation. The majority showed steady levels and no improvements, but we could also identify groups of patients with improving and deteriorating levels. Patients with higher starting physical activity levels or low sedentary behaviour levels were more likely to be a member of clusters with deteriorating levels. These patients could benefit of additional interventions.
Key words: acute coronary syndrome; sedentary behaviour; physical activity; step count; cardiac rehabilitation; latent class trajectory models.
Citation: J Rehabil Med 2023; 55: jrm4343. DOI: https://doi.org/10.2340/jrm.v55.4343
Copyright: © Published by Medical Journals Sweden, on behalf of the Foundation for Rehabilitation Information. This is an Open Access article distributed under the terms of the Creative Commons Attribution-NonCommercial 4.0 International License (https://creativecommons.org/licenses/by-nc/4.0/)
Accepted: Apr 5, 2023; Published: Jul 12, 2023
Correspondence address: Nienke ter Hoeve, Department of Rehabilitation Medicine, Erasmus MC, University Medical Centre Rotterdam, PO Box 2040, NL-3000 CA Rotterdam, The Netherlands. E-mail: N.terhoeve@erasmusmc.nl
Competing interests and funding: The authors have no conflicts of interest to declare.
Physical behaviour is a construct that includes the distinct aspects physical activity (PA) and sedentary behaviour (1). An individual may have an active lifestyle during their leisure time in combination with a sedentary lifestyle at other times of the day. Studies have shown that higher PA levels are related to a more favourable cardiovascular risk profile and lower cardiac mortality (2, 3), whereas sedentary behaviour is an important predictor of long-term all-cause and cardiovascular mortality (4).
Cardiac rehabilitation (CR) programmes are designed to improve physical and psychosocial functioning of patients with established heart disease and to promote a heart-healthy lifestyle, in order to prevent (recurrent) life-threatening cardiovascular events. Previous meta-analyses in patients with heart diseases have reported some improvements in moderate-to-vigorous PA (MVPA) and sedentary behaviour during and after CR, but the effects were only moderate (5, 6). Individual changes might diverge from this “average”: some patients might be more successful than others in implementing and maintaining behaviour changes. For example, a previous study described distinct clusters of CR patients in relation to the number of steps per day in the period after participation in CR (7). These findings advocate a personalized approach to CR. Nevertheless, more information is needed on individual changes in other physical behaviour outcomes, such as MVPA and sedentary behaviour, both during and after CR.
We recently completed the OPTICARE randomized controlled trial on CR lifestyle strategies in patients who had recently experienced an acute coronary syndrome (8). On average, only slight improvements in physical behaviour measures were observed. However, there were considerable variations between patients. The aim of the current study is to explore distinct clusters of patients according to changes in multiple aspects of physical behaviour during and after CR, and to study potential predictors of cluster membership. Separate analyses were performed for the time period during CR and the time period after CR. Separating these time periods will provide valuable information for daily practice. Outcomes will provide information on which subgroups need additional interventions during CR and which subgroups need additional interventions in the period after completion of CR. This analysis might help to further define a personalized approach to CR.
METHODS
Patients and treatment
The design of OPTICARE has been described in detail (9). Briefly, patients > 18 years old with recent acute coronary syndrome who were referred to CR between September 2011 and August 2014 were invited to participate. Exclusion criteria were insufficient proficiency in Dutch, and severe physical or cognitive impairments that could limit CR participation. Participants were randomized in a 1:1:1 ratio to 1 of the following 3 trial arms:
- CR-only: standard CR according to the guidelines (10) for a duration of 3 months comprising 2 group exercise sessions per week of 75 min each. Educational sessions and counselling on a heart-healthy lifestyle were provided when necessary.
- CR + F: during the 3-month CR period 3 additional face-to-face group PA counselling sessions were provided. After the CR period, a 9-month after-care programme, consisting of 3 face-to-face group sessions focussing on maintaining a heart-healthy lifestyle, was offered.
- CR + T: participants followed a standard CR programme. After the CR period, a 9-month telephonic after-care programme was offered, consisting of 5–6 individual telephone coaching sessions focussing on maintaining a heart-healthy lifestyle.
The study protocol was approved by the Institutional Review Board of Erasmus Medical Centre in Rotterdam (MEC-2010-391). Written informed consent was provided by all patients. OPTICARE is registered at clinicaltrials.gov (NCT01395095).
No clinically relevant differences in CR outcomes were found between the OPTICARE trial arms. In the long term, participants in the 3 arms reached the same PA levels and in the short term small differences were found in favour of CR + F only for step count (8). Therefore, for the current analysis, the trial arms were pooled.
Physical behaviour measures
Physical behaviour measures were taken at 4 time-points: at start of CR (T0), at completion of standard CR (3 months after start, T3), and at 12 months (T12) and 18 months (T18) after start (8).
Physical behaviour was measured with a tri-axial accelerometer ActiGraph GT3x (ActiGraph LLC, Pensacola, FL, USA). Participants were asked to wear the ActiGraph for 8 consecutive days during waking hours. Data was sampled at 30 Hz and accelerations in 3 axes (vertical, horizontal and perpendicular axes) were summarized and converted into activity counts and steps (11). Step count data were further processed using Actilife software. Activity counts were summarized over 15-s intervals (epochs) using Matlab (version R2011b, Mathworks, Natick, MA, USA). After subtraction of non-wear time (defined as a minimum of 60 min of consecutive zeros, reflecting no movement), each 15-s epoch was categorized as MVPA for activities of ≥ 672.5 counts, light physical activity (LPA) for activities of > 37.5 and < 672.5 counts, and sedentary behaviour for activities ≤ 37.5 counts (12, 13). Data were only included in the analysis when the participant wore the Actigraph for at least 4 days with a minimum of 660 min/day. MVPA, LPA and sedentary behaviour were expressed as percentage of wear time, and step count was expressed as mean steps per min wear time. For all 4 physical behaviour measures there was no relevant deviation from the normal distribution.
Predictor variables: baseline, psychosocial and lifestyle factors
Baseline characteristics. Data about sex and age were collected from medical charts. Marital status (partner Y/N) and education (high, intermediate, low) was collected with a self-designed questionnaire. Days of hospitalization and trial treatment assignment was also taken into account as predictor variable.
Psychosocial factors. These included anxiety and depression, assessed with the Hospital Anxiety and Depression Scale (HADS) questionnaire (14), fatigue, assessed with the Fatigue Severity Scale (FSS) (15, 16) and self-efficacy, assessed with the General Self-Efficacy scale (17). These predictors were collected at start of CR (T0, as predictor for the CR clusters) and at completion of CR (T3, as predictor for the post-CR clusters).
Lifestyle factors. These included body mass index (BMI) in kg/m2, smoking status (Y/N), distance at the 6-min walk test (6MWT) as a measure of aerobic fitness and baseline levels of physical behaviour. These predictors were collected at start of CR (T0, as predictor for the CR clusters) and at completion of CR (T3, as predictor for the post-CR clusters).
Statistical analysis
Patients who completed CR (minimum attendance 75% of CR sessions (18)) and who had a physical behaviour measurement at least at T0 (for the “CR” cluster analysis) or T3 (for the “post-CR” cluster analysis) were included in the analysis (see Fig. 1). Latent class trajectory modelling (LCTM) is a statistical analysis technique to identify more or less homogenous categories of patients in heterogeneous populations (19). LCTM was applied to identify clusters of participants according to their changes in 4 physical behaviour outcomes: MVPA, LPA, steps and sedentary behaviour. For each physical behaviour outcome, 2 analyses were performed: 1 focusing on changes “during CR” (∆T0–T3) and 1 focusing on changes “post-CR” (∆T3–T12–T18). The LCMM analysis package (see below) can handle missing values, and does not drop cases with incomplete follow-up. With respect to all 4 considered physical behaviour outcomes, a maximum of 5 clusters (or classes) were considered. In our data, it appeared that clustering into 3 classes (during CR as well as post-CR) resulted in the best combination of the Bayesian information criterion (BIC), relative entropy, Average posterior probability of assignment (APPA), and number of patients per cluster Table S1 (20, 21). Hence, the analysis was continued with these 3 classes that showed more or less steady, improving or deteriorating physical behaviour levels.
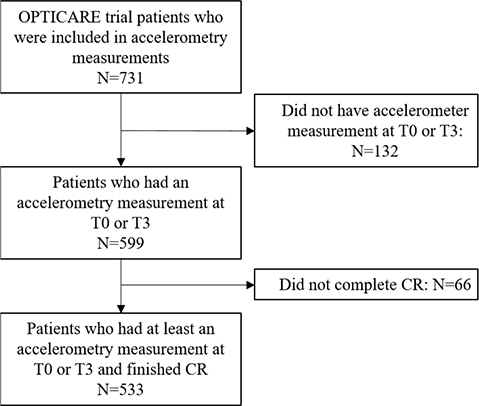
Fig. 1. Flowchart of the study population. OPTICARE: OPTImal CArdiac Rehabilitation; CR: cardiac rehabilitation.
Crosstabulations were performed to determine whether there is a relationship between membership to a cluster during CR and membership to a cluster post-CR. Subsequently, multinomial logistic regression (MLR) analyses were performed to assess the relationship between baseline demographics, clinical characteristics, psychosocial factors and lifestyle factors (as predictors) and cluster membership. Crude, unadjusted odds ratios (OR) and 95% confidence intervals (95% CI) are reported using the “steady” class as reference. The significant variables were further evaluated in multivariable MLR models, while adjusting for age, sex and baseline physical behaviour level (T0 for the during CR analysis, and T3 for the post-CR analysis) without further variable selection. Adjusted ORs are then reported.
Data analyses were performed using R (version 4.0.2, RStudio, Boston, MA, USA) statistical software (LCMM package and NNET package). All statistical tests were 2-sided and a p-value of < 0.05 was considered significant.
RESULTS
Participants
The study flow is shown in Fig. 1. A total of 731 participants were eligible, 132 patients were excluded because they had no physical behaviour measurements and a further 66 patients were excluded because they did not complete CR. Participants that were excluded were more often smokers and a higher percentage had a low education level. Ultimately, 533 patients were available for analysis. They had a mean (standard deviation; SD) age of 57.9 (8.9) years, and were mostly men (81.8%) (Table I).
| Characteristics | |
| Age, years, mean (SD) | 57.9 (8.9) |
| Female, n (%) | 97 (18.2) |
| Intervention group, n (%) | |
| CR + T | 175 (32.8) |
| CR only | 171 (32.1) |
| CR + F | 187 (35.1) |
| Educationa, n (%) | |
| Low | 27 (5.1) |
| Intermediate | 310 (58.2) |
| High | 126 (23.6) |
| Partnered yesb, n (%) | 382 (71.7) |
| BMI in kg/m2 c, mean (SD) | 27.9 (3.9) |
| Smoking yesd, n (%) | 54 (10.1) |
| Therapeutic intervention at index event, n (%) | |
| No revascularization | 46 (8.6) |
| Percutaneous coronary intervention | 418 (78.4) |
| Coronary artery bypass graft | 69 (13.0) |
| MVPA as % weartimee, mean (SD) | 6.0 (2.8) |
| LPA as % weartimee, mean (SD) | 28.6 (7.0) |
| Sedentary behaviour as % weartimee, mean (SD) | 65.4 (8.2) |
| Steps per minute weartimee, mean (SD) | 7.0 (2.6) |
| Wear timee in h, mean (SD) | 14.3 (1.1) |
| HADSf, mean (SD) | 8.4 (7.3) |
| GSEg, mean (SD) | 31.6 (5.5) |
| FSSh, mean (SD) | 3.3 (1.5) |
| a13.1% missing; b12.9% missing; c0.19% missing; d1.9% missing; e12.6% missing; f15.0% missing; g14.1% missing; h17.4% missing. | |
| CR + T: standard cardiac rehabilitation plus telephonic counselling; CR only: standard cardiac rehabilitation; CR + F: standard cardiac rehabilitation plus face-to-face group counselling; MVPA: moderate-to-vigorous physical activity; LPA: light physical activity; HADS: Hospital Anxiety Depression Scale; GSE: General Self-Efficacy scale; FSS: Fatigue Severity Scale. | |
| The HADS is a questionnaire consisting of 14 items (every item on a Likert scale 0–3) (14). The higher the score of a person, the more a patient experiences anxiety or depressed feelings. The FSS consists of 9 items and total score ranges from 1–7, where a higher score indicates more fatigue/impact of fatigue on daily life (FSS) (15, 16). The GSE, consists of 10 propositions and the sum score ranges between 10 and 40, where a higher score indicates more self-efficacy (17). | |
Physical behaviour clusters
Regarding MVPA, LPA and steps, during CR (Fig. 2) and post-CR (Fig. 3), 3 clusters of patients could be distinguished: those with steady levels (comprising 68–83% of patients), improving levels (showing PA increases or sedentary behaviour declines, comprising 6–21% of patients) and deteriorating levels (showing PA declines or sedentary behaviour increases, comprising 4–23% of patients). For example, for MVPA during CR, the cluster of patients with steady levels showed a slight mean increase from 5.6% (SD 2.7) to 6.5% (SD 2.6) of wear time, whereas the clusters of patients with improving and deteriorating levels had a mean increase of + 4.4% (SD 1.2) and a mean decrease of –2.9% (SD 1.5) in wear time, respectively. (For other physical behaviour outcomes, see Table SII). There appeared to be no relationship between membership to a cluster during CR and membership to a cluster post-CR (Table SIII).
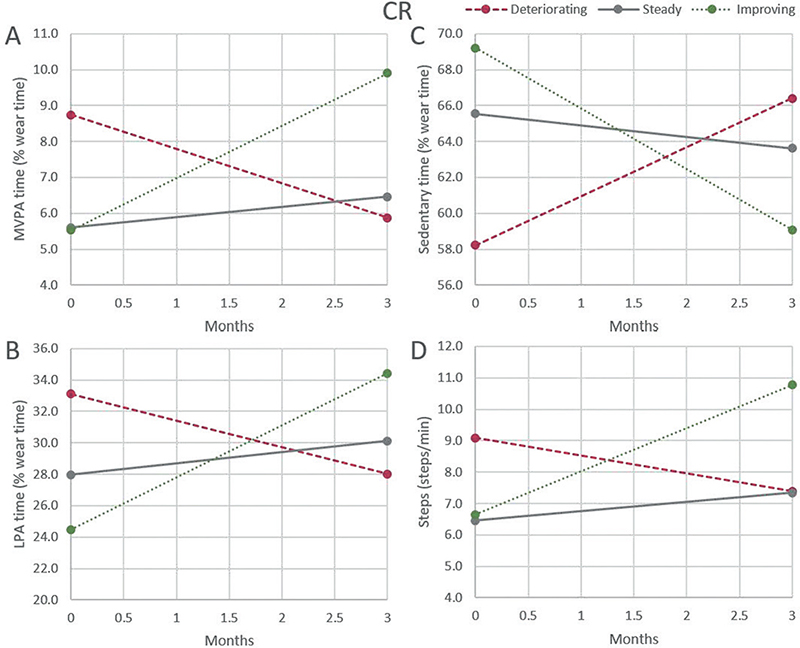
Fig. 2. Clusters of moderate-to-vigorous physical activity (MVPA), light physical activity (LPA), sedentary behaviour and steps/min during cardiac rehabilitation (CR). (A) Clusters for MVPA, (B) clusters for LPA, (C) clusters for sedentary behaviour, (D) clusters for steps.
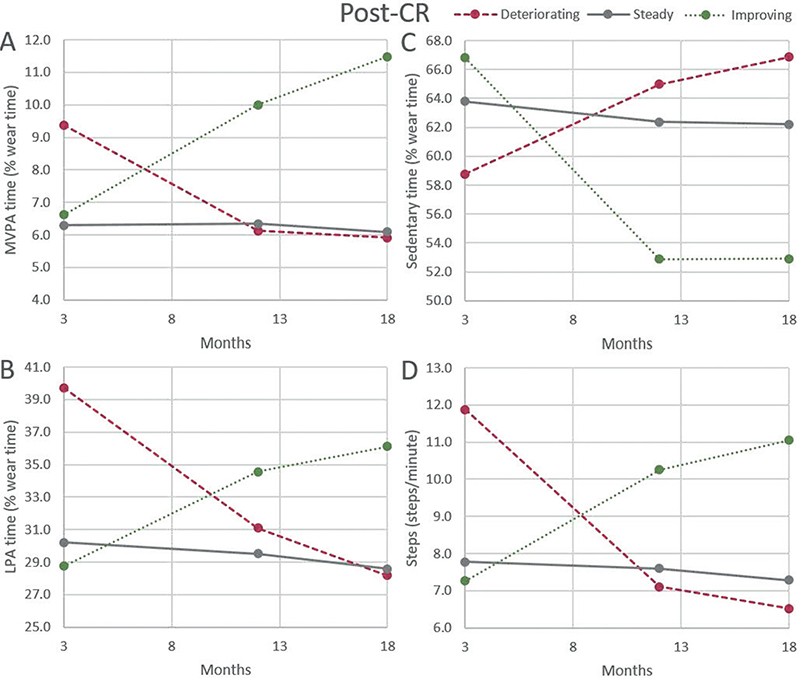
Fig. 3. Clusters of moderate-to-vigorous physical activity (MVPA), light physical activity (LPA), sedentary behaviour and steps/min after cardiac rehabilitation (CR). (A) Clusters for MVPA, (B) clusters for LPA, (C) clusters for sedentary behaviour, (D) clusters for steps.
Predictors of physical behaviour clusters
For predictor analysis, the clusters with steady levels were used as the reference.
Predictors for physical behaviour clusters during CR
With respect to all 4 physical behaviour outcomes measurements, those with high baseline level of the specific physical behaviour were more likely to be member of the clusters with decreasing levels (deteriorating levels for MVPA, LPA and steps, improving levels for sedentary behaviour) than the clusters with steady levels.
In addition, for MVPA it was found that subjects assigned to treatment CR + F were less likely to be a member of the cluster with deteriorating levels and more likely to be in the cluster with improving levels compared with the cluster with steady levels.
For LPA, subjects with higher LPA (% wear time) levels at baseline were less likely to be in the cluster with improving levels compared with the cluster with steady levels
For steps, subjects assigned to CR + F were less likely to be in the cluster with deteriorating levels and more likely to be in the cluster with improving levels. Subjects with higher BMI were less likely to be in the clusters with deteriorating levels or improving levels, and people who smoked were less likely to be in the cluster with deteriorating levels.
For sedentary behaviour, subject with higher sedentary behaviour (% wear time) levels at baseline were less likely to be in the cluster with deteriorating levels (Fig. 4 and Table SIV).
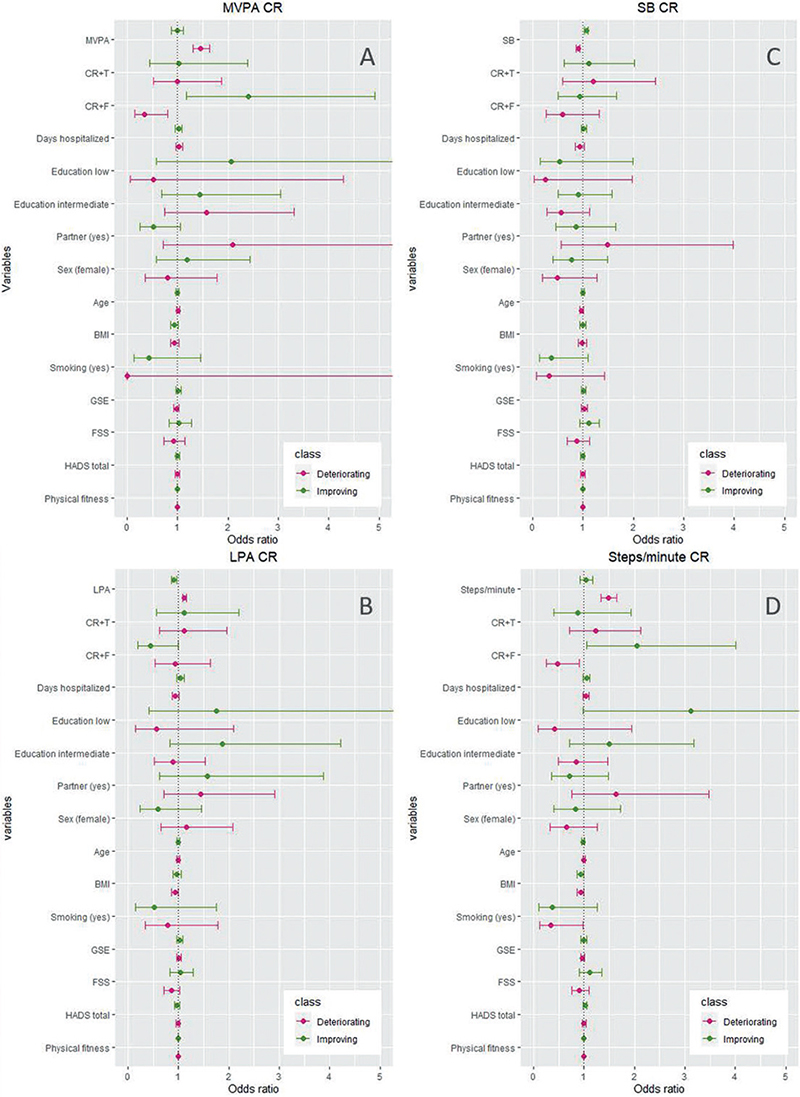
Fig. 4. Forest plots for predictors for moderate-to-vigorous physical activity (MVPA), light physical activity (LPA), sedentary behaviour and steps/min during cardiac rehabilitation (CR). (A) Moderate-to-vigorous physical activity (MVPA), (B) light physical activity, (C) sedentary behaviour, (D) steps. Univariately tested. CR + T: standard cardiac rehabilitation plus telephonic counselling; CR + F: standard cardiac rehabilitation plus face-to-face group counselling; BMI: body mass index; HADS: Hospital Anxiety Depression Scale; GSE: General Self-Efficacy scale; FSS: Fatigue Severity Scale; 6MWT: Six-Min Walk Test.
Predictors for physical behaviour clusters post-CR.
Similar to the observations for physical behaviour clusters during CR, for post-CR it was also observed that those with high baseline level of the specific physical behaviour were more likely to be members of the cluster with decreasing levels than the cluster with steady levels.
In addition, for MVPA, older people and subjects with higher BMI were less likely to be in the cluster with improving levels.
For LPA, subjects with a higher physical fitness (6MWT) at T3 were more likely to be in the cluster with deteriorating levels.
For steps, older people were less likely to be in the cluster with improving levels.
For sedentary behaviour, subjects with intermediate education levels were more likely to be a member of the cluster with improving levels. Furthermore, subjects with a partner and with a higher age were less likely to be in the cluster with improving levels (Fig. 5 and Table SV).
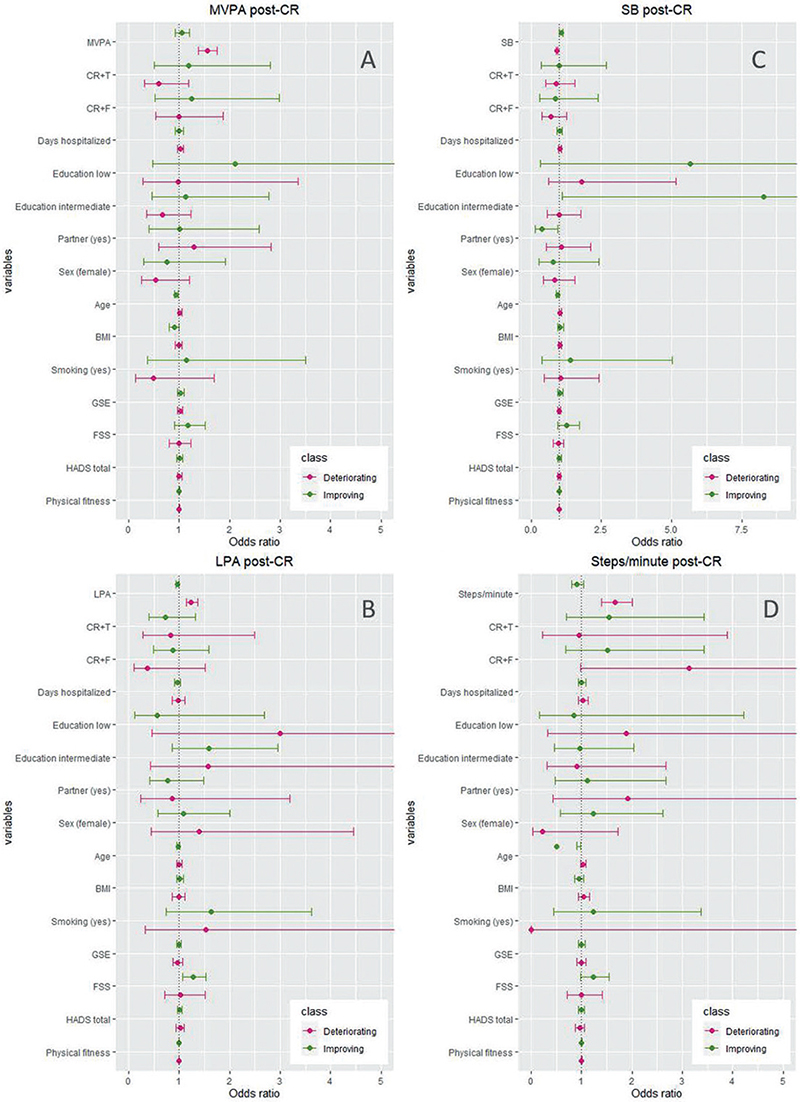
Fig. 5. Forest plots for predictors for moderate-to-vigorous physical activity (MVPA), light physical activity (LPA), sedentary behaviour and steps/minute after cardiac rehabilitation (CR). (A) MVPA, (B) LPA, (C) sedentary behaviour, (D) steps. Univariately tested. CR + T: standard cardiac rehabilitation plus telephonic counselling; CR + F: standard cardiac rehabilitation plus face-to-face group counselling; MVPA: moderate-to-vigorous physical activity; LPA: light physical activity; BMI: body mass index; HADS: Hospital Anxiety Depression Scale; GSE: General Self-Efficacy scale; FSS: Fatigue Severity Scale; 6MWT: Six-Min Walk Test.
DISCUSSION
In the OPTICARE trial, on average, only minor changes in physical behaviour were found during and after CR. Since considerable variations were seen between patients, the current study explored the possibility to distinguish clusters of patients according to physical behaviour changes, in order to be able to further define a personalized CR approach. The outcomes indicate that it was possible to distinguish 3 distinct clusters for changes in MVPA, LPA, step count and sedentary behaviour, both during and post-CR: patients with steady, improving or deteriorating levels. The clusters with steady levels represent the majority of the sample (comprising 68–83% of the patients). Outcomes show that baseline physical behaviour level is the main predictor for membership to a specific cluster. Patients with a higher starting level of the specific physical behaviour were more likely to be a member of a cluster with decreasing levels (deteriorating for PA and improving for sedentary behaviour).
The outcomes indicate that the response to CR differs between subgroups of patients regarding their physical behaviour. For all 4 physical behaviour outcomes, clusters of patients with steady, improving and deteriorating levels were identified. Nevertheless, the majority of patients were in the cluster with steady levels, showing only minor physical behaviour changes. This is in line with previous findings that centre-based CR programmes are not sufficient to establish substantial improvements over time in PA habits (22). Nevertheless, the current outcomes indicate that there is also a subgroup that showed more substantial improvements in physical behaviour both during and after CR. The size of these groups ranged from 10.9% to 17.6% during CR for the 4 physical behaviours and post-CR from 6.3% to 20.8%.
A few more studies have been performed to distinguish clusters of patients based on PA during or post-CR (7, 23). Sweet et al.'s study focused on a 2-year period after cardiac hospitalization in which 98% of subjects (246 out of 251) participated in a CR programme within the first year, and PA was measured with a questionnaire. They found 3 PA clusters with different starting levels, but all showing an increase over the first year starting immediately after hospital discharge, followed by a decrease in the second year (23). The current study used accelerometry to objectively measure PA, in contrast to the subjective measure used by Sweet et al. The majority of participants in the Sweet et al.’s study were in a cluster that ended at the same PA level as they started (23). This is comparable with the current study results, in which the majority of participants also showed maintenance of PA over time. Blanchard et al. studied objectively measured steps-per-day post-CR, and found 3 clusters, a non-adherers trajectory (low, slight improvement), an optimal adherers trajectory (high, slight improvement) and a decliners trajectory (in between, significant decline), where the majority of the participants (45.4%) were in this latter trajectory (7). The current study found that the cluster with patients with steady levels, reflecting the majority (83.7%), showed a slight decrease post-CR in steps and the cluster with deteriorating levels (5.0% of the population) showed a larger decrease post-CR.
The results of the current study indicate that patients do not end up in the same cluster during and after CR. This means that the groups that need additional help during CR and after CR do not consist of the same patients. Therefore, for each patient it should be evaluated separately at both time-point (before and after CR) whether additional interventions are recommended. The main predictor that emerged from the current study for membership to a specific cluster was the baseline physical behaviour level. For sedentary behaviour this is in line with expectations: participants that start with high (and thus adverse) sedentary behaviour levels have more opportunity to improve and become less sedentary over time. However, for PA this phenomenon is more difficult to explain. Participants with a high starting level might have started CR very optimistic, resulting in high PA levels that were difficult to maintain over a longer time-period. Another explanation could be regression to the mean, which can never be ruled out when studying changes based on 2 repeated measurements. According to this fundamental statistical phenomenon, individuals with outlier values at baseline tend to have a value closer to the mean at re-measurement (24). Indeed, patients with high baseline physical behaviour levels tended to have lower levels closer to the mean after CR. However, the current study did not observe a sizeable group of patients with baseline physical behaviour levels below average that moved closer to the mean. Since the regression to the mean phenomenon is, by definition, symmetrical, the (magnitude of the) changes that were observed in the current study could not be fully explained by regression to the mean. Furthermore, importantly, the current study measured physical behaviour with accelerometry over a 7-day period and compared the mean baseline and post-CR values. It is well-known that such means are less vulnerable for regression to the mean effects.
Other predictors that emerged for some specific physical behaviour clusters were among others trial group assignment, age, BMI and smoking. Trial group assignment to additional face-to-face coaching seems beneficial with regard to improved physical behaviour, which is in line with our previous publication on this study (8). In general, we found that smoking, higher BMI and higher age were related to a lower chance of being in clusters with improving levels or more likely to be in the clusters with steady levels, suggesting a lower chance of improvement for patients with these characteristics. This is in line with previous findings that unhealthy behaviours tend to co-occur (25). Also, in the study by Blanchard et al., being obese, having at least 1 comorbidity and a lower exercise capacity at the start of CR were identified as predictors for the non-adherers group (7). Nevertheless, these predictors did not show a uniform “picture”: different predictors were found for different clusters. Therefore, based on our selection of predictors, it remains quite challenging to predict cluster membership and thus physical behaviour changes during and after CR.
Overall, the current results showed that there are separate clusters of physical behaviour changes in acute coronary syndrome patients during and after CR. These findings advocate a personalized approach to CR. Mainly patients showing a deterioration, but also patients with no improvements in their physical behaviour both during CR and in the aftercare phase, should receive additional interventions. A first indication to identify patients at risk of deterioration during or after CR is high levels of PA both at the start and completion of CR. If these patients additionally show other unhealthy behaviours, such as overweight and smoking, this should be seen as an additional red flag. Nevertheless, it should be noted that we did not find strong predictors for cluster membership, suggesting that it remains challenging to predict which patients need additional physical behaviour interventions. Future studies are necessary to replicate this study in a larger sample, in order to determine if other predictors for PA profiles can be identified. The ability to predict at the start or end of CR which patients might need extra attention or a different CR programme, could enable more individualized programmes to be designed focusing on the appropriate PA or sedentary behaviour outcomes for a specified subgroup.
Strengths and limitations
Strengths of this study include the use of accelerometers, the repeated measures design, the focus on 4 physical behaviour outcomes and considering a timeframe both during and post-CR. However, there are also limitations that need consideration. In the OPTICARE study, no control group was included with patients not following CR. Therefore, the effect of the CR program vs no CR programme could not be evaluated. Since CR is currently standard care for patients with recent acute coronary syndrome, it is unethical to include a randomized control group without CR. Nevertheless, collecting information in patients who choose to not follow CR might give valuable information on the added value of CR in physical behaviour changes and is recommended in future projects. Furthermore, although we adjusted for major confounders, sample size did not allow for more extensive multivariate testing of the predictors, or to test for interactions between predictors. This was mainly due to the fact that the majority of patients were members of the cluster with steady levels, and the clusters showing a change (increase or decrease) were small. Lastly, no information was available on the PA level of participants before the acute coronary syndrome occurred and on more psychological aspects, such as coping, personality, motivation and problem-solving. It would be interesting to determine whether these are potential predictors for the physical behaviour physical behaviour clusters.
CONCLUSION
Patients with recent acute coronary syndrome can be clustered according to the change in their physical behaviour during and after CR. Although the majority showed steady levels, groups of patients with improving and deteriorating levels could also be identified. Hence, individual differences in physical behaviour changes during and after CR exist, which advocates a personalized approach to CR. The individual differences could be predicted mainly by baseline physical behaviour level.
ACKNOWLEDGEMENTS
The OPTICARE trial was an investigator-initiated study, co-financed by Capri Cardiac Rehabilitation Rotterdam (the Netherlands) and the Zilveren Kruis healthcare insurance company (the Netherlands).
This project received funding from the European Union’s Horizon 2020 research and innovation project [780495]. Any dissemination of results here presented reflects only the author’s view.
REFERENCES
- Bussmann JB, van den Berg-Emons RJ. To total amount of activity..... and beyond: perspectives on measuring physical behavior. Front Psychol 2013; 4: 463.
- Giannuzzi P, Mezzani A, Saner H, Bjornstad H, Fioretti P, Mendes M, et al. Physical activity for primary and secondary prevention. Position paper of the Working Group on Cardiac Rehabilitation and Exercise Physiology of the European Society of Cardiology. Eur J Cardiovasc Prevent Rehab 2003; 10: 319–327.
- Balady GJ, Williams MA, Ades PA, Bittner V, Comoss P, Foody JM, et al. Core components of cardiac rehabilitation/secondary prevention programs: 2007 update: a scientific statement from the American Heart Association Exercise, Cardiac Rehabilitation, and Prevention Committee, the Council on Clinical Cardiology; the Councils on Cardiovascular Nursing, Epidemiology and Prevention, and Nutrition, Physical Activity, and Metabolism; and the American Association of Cardiovascular and Pulmonary Rehabilitation. Circulation 2007; 115: 2675–2682.
- Al-Khalili F, Janszky I, Andersson A, Svane B, Schenck-Gustafsson K. Physical activity and exercise performance predict long-term prognosis in middle-aged women surviving acute coronary syndrome. J Intern Med 2007; 261: 178–187.
- Dibben GO, Dalal HM, Taylor RS, Doherty P, Tang LH, Hillsdon M. Cardiac rehabilitation and physical activity: systematic review and meta-analysis. Heart 2018; 104: 1394–1402.
- Meiring RM, Tanimukai K, Bradnam L. The effect of exercise-based cardiac rehabilitation on objectively measured physical activity and sedentary behavior: a systematic review and meta-analysis. J Prim Care Community Health 2020; 11: 2150132720935290.
- Blanchard CM, Giacomantonio N, Lyons R, Cyr C, Rhodes RE, Reid RD, et al. Examining the steps-per-day trajectories of cardiac rehabilitation patients – a latent class growth analysis perspective. J Cardiopulm Rehabil Prev 2014; 34: 106–113.
- Ter Hoeve N, Sunamura M, Stam HJ, Boersma E, Geleijnse ML, van Domburg RT, et al. Effects of two behavioral cardiac rehabilitation interventions on physical activity: A randomized controlled trial. Int J Cardiol 2018; 255: 221–228.
- Sunamura M, Ter Hoeve N, van den Berg-Emons HJ, Haverkamp M, Redekop K, Geleijnse ML, et al. OPTImal CArdiac REhabilitation (OPTICARE) following Acute Coronary Syndromes: Rationale and design of a randomised, controlled trial to investigate the benefits of expanded educational and behavioural intervention programs. Neth Heart J 2013; 21: 324–330.
- PAAHR RNNep. Multidisciplinary guidelines cardiac rehabilitation 2011. Utrecht: Nederlandse Vereniging Voor Cardiologie; 2011.
- Ter Hoeve N, Sunamura M, van Geffen ME, Fanchamps MH, Horemans HL, Bussmann JB, et al. Changes in physical activity and sedentary behavior during cardiac rehabilitation. Arch Phys Med Rehabil 2017; 98: 2378–2384.
- Sasaki JE, John D, Freedson PS. Validation and comparison of ActiGraph activity monitors. J Sci Med Sport 2011; 14: 411–416.
- Carr LJ, Mahar MT. Accuracy of intensity and inclinometer output of three activity monitors for identification of sedentary behavior and light-intensity activity. J Obes 2012; 2012: 460271.
- Bjelland I, Dahl AA, Haug TT, Neckelmann D. The validity of the Hospial Anxiety and Depression Scale, an update literature review. J Psychosom Res 2002; 52: 69–77.
- Armutlu K, Korkmaz NC, Keser I, Sumbuloglu V, Akbiyik DI, Guney Z, et al. The validity and reliability of the Fatigue Severity Scale in Turkish multiple sclerosis patients. Int J Rehab Res 2007; 30: 81–85.
- Valko PO, Vassetti CL, Bloch KE, Held U, Baumann CR. Validation of the Fatigue Severity Scale in a Swiss Cohort. Sleep 2008; 31: 1601–1607.
- Zotti AM, Balestroni G, Cerutti P, Ferrario SR, Angelino E, Miglioretti M. Application of the general perceived self-efficacy scale in cardiovascular rehabilitation. Monaldi Arch Chest Dis 2007; 68: 178–183.
- Sunamura M, Ter Hoeve N, van den Berg-Emons RJG, Geleijnse ML, Haverkamp M, Stam HJ, et al. Randomised controlled trial of two advanced and extended cardiac rehabilitation programmes. Heart 2018; 104: 430–437.
- Nguena Nguefack HL, Page MG, Katz J, Choiniere M, Vanasse A, Dorais M, et al. Trajectory modelling techniques useful to epidemiological research: a comparative narrative review of approaches. Clin Epidemiol 2020; 12: 1205–1222.
- Lennon H, Kelly S, Sperrin M, Buchan I, Cross AJ, Leitzmann M, et al. Framework to construct and interpret latent class trajectory modelling. BMJ Open 2018; 8: e020683.
- Klijn SL, Weijenberg MP, Lemmens P, van den Brandt PA, Lima Passos V. Introducing the fit-criteria assessment plot – a visualisation tool to assist class enumeration in group-based trajectory modelling. Stat Methods Med Res 2017; 26: 2424–2436.
- Ter Hoeve N, Huisstede BMA, Stam HJ, Van Domburg RT, Sunamura M, van den Berg-Emons HJG. Does cardiac rehabilitation after an acute cardiac syndrome lead to changes in physical activity habits? Systematic review. Phys Ther 2015; 95: 167–179.
- Sweet SN, Tulloch H, Fortier MS, Pipe AL, Reid RD. Patterns of motivation and ongoing exercise activity in cardiac rehabilitation settings: a 24-month exploration from the TEACH Study. Ann Behav Med 2011; 42: 55–63.
- Linden A. Assessing regression to the mean effects in health care initiatives. BMC Med Res Methodol 2013; 13: 1–7.
- Nooijen CFJ, Moller J, Forsell Y, Ekblom M, Galanti MR, Engstrom K. Do unfavourable alcohol, smoking, nutrition and physical activity predict sustained leisure time sedentary behaviour? A population-based cohort study. Prev Med 2017; 101: 23–27.
Supplementary material has been published as submitted. It has not been copyedited, typeset or checked for scientific content by Journal of Rehabilitation Medicine
Tables SI, SII, SIII, SIV, SV