ORIGINAL REPORT
PHYSICAL ACTIVITY LEVELS IN ADULTS WITH CHRONIC LOW BACK PAIN: A NATIONAL SURVEY IN THE GENERAL SPANISH POPULATION
Marta MORENO-LIGERO, MSc1,2, Jose A. MORAL-MUNOZ, PhD2–4, Inmaculada FAILDE, PhD1,2,4 and María DUEÑAS, PhD2,4,5
From the 1Preventive Medicine and Public Health Area, Department of Biomedicine, Biotechnology and Public Health, 2Observatory of Pain, 3Department of Nursing and Physiotherapy, University of Cadiz, 4Biomedical Research and Innovation Institute of Cadiz (INiBICA) and 5Department of Statistics and Operational Research, University of Cadiz, Cadiz, Spain
Objective: To identify and compare physical activity levels in the Spanish population with chronic low back pain and their associated factors.
Design: Cross-sectional national study.
Subjects: A total of 3,220 adults with chronic low back pain from the 2017 Spanish National Health Survey.
Methods: Three groups were defined according to physical activity level (low, moderate, and high) assessed with the International Physical Activity Questionnaire. Descriptive analysis and an ordinal regression model were performed.
Results: Thirty percent of the subjects were classed as doing a low level of physical activity, 53% moderate, and 17% high. Females predominated in the low and moderate groups, and the subjects in the high group were younger. Subjects in the low group reported more use of pain-relief, more severe-extreme pain, more functional limitations, and worse quality of life and mental health. Factors more likely to be associated with higher levels of physical activity were: being male, normal body mass index or overweight, better health status, less pain, less physical and cognitive limitations, and more social support.
Conclusion: Different aspects of the biopsychosocial framework were associated with the different levels of physical activity in subjects with chronic low back pain. These findings should be taken into consideration in order to establish suitable public health strategies.
LAY ABSTRACT
Physical activity benefits subjects with chronic pain, although its performance depends on various factors. This study analysed 3,220 adults with chronic low back pain from the 2017 Spanish National Health Survey, in order to identify and compare levels of physical activity (International Physical Activity Questionnaire) and their associated factors. Thirty percent of subjects were classed as doing low levels of physical activity, 53% moderate, and 17% high. Females predominated in the low and moderate level groups, and subjects with a high level of physical activity were younger. Subjects in the low level of physical activity group reported more consumption of pain-relief, more severe-extreme pain, more functional limitations, and worse quality of life and mental health. Factors associated with more physical activity were being male, normal body mass index (BMI) or overweight, better health status, less pain, less physical and cognitive limitations, and more social support. In conclusion, different biopsychosocial aspects were associated with the different levels of physical activity in subjects with chronic low back pain, and this information should be taken into consideration in order to establish suitable public health strategies.
Key words: biopsychosocial model; chronic pain; low back pain; musculoskeletal pain; physical activity.
Citation: J Rehabil Med 2023; 55: jrm00366. DOI: http://dx.doi.org/10.2340/jrm.v55.4352.
Copyright: © Published by Medical Journals Sweden, on behalf of the Foundation for Rehabilitation Information. This is an Open Access article distributed under the terms of the Creative Commons Attribution-NonCommercial 4.0 International License (https://creativecommons.org/licenses/by-nc/4.0/)
Accepted: Nov 23, 2022; Published: Jan 20, 2023
Correspondence address: Jose A. Moral-Munoz, Observatory of Pain, University of Cadiz, Avda. Ana de Viya, 52, ES-11009 Cádiz, Spain. E-mail: joseantonio.moral@uca.es
Competing interests and funding: The authors have no conflicts of interest to declare.
Low back pain (LBP) is the most common musculoskeletal disorder and is a leading cause of disability (1). In addition, it is one of the primary public health problems, with the highest global burden of disease (2). The worldwide prevalence of LBP has increased from 9.4% (2) to 20% in 2019 (3). In Spain, the prevalence of LBP was 20.9% in 2017(5). The economic and social impact related to LBP was estimated at an overall cost of €8,945.57 million, of which 74.5% represents indirect costs related to loss of productivity (5). The evidence that this condition increases expenditure on healthcare resources (1), together with the high number of workers taking sick leave, reveals its important individual, social and economic impact (6).
LBP lasting for more than 3 months is of clinical importance, since it is considered chronic low back pain (CLBP). This condition is frequently classified as non-specific, making its diagnosis and treatment difficult (7). Furthermore, it is related to several risk factors, such as older age, female sex, unhealthy lifestyle habits, and psychosocial factors (anxiety, work stress, depressive mood, and somatization) (4, 8). This interaction between biological, behavioural, environmental, and social factors in chronic pain conditions should be addressed by taking into consideration the biopsychosocial context of the individual (9). Therefore, the different programmes and therapies encompassed by this model could serve to control the increase in CLBP.
Several practice guidelines and recommendations worldwide have described many non-pharmacological interventions to treat CLBP (10). In this sense, physical activity (PA) showed benefits with regard to pain, sleep quality, cognitive function, and physical ability in subjects with chronic pain conditions (11). These effects on several health-related aspects make PA suitable for minimizing disability, improving participation in physical and social activities, and promoting quality of life (12). Furthermore, PA as part of multidisciplinary biopsychosocial framework appears to contribute positively to sick leave days, being part of a successful return-to work strategy (13). Thus, PA combines both preventive and multisystemic effects with few adverse consequences and at little cost (12).
Consequently, it is important to have an overview of the PA levels of the general adult population diagnosed with CLBP in order to gain insights into the impact that this condition has on health and social systems. In this regard, several studies have used data from European and national surveys (5, 14). However, it is still necessary to enhance PA levels among the Spanish population with CLBP and to examine the characteristics and factors related to each level.
Therefore, the current study aims to: (i) analyse PA levels among subjects with CLBP and identify groups according to those levels; (ii) compare the characteristics of the PA groups (high, moderate, and low); and (iii) recognize the sociodemographic, lifestyle, health-related, social, and activity limitations factors associated with each of these groups.
METHODS
Study design
The data source used to perform the current cross-sectional study was the 2017 Spanish National Health Survey (SNHS 2017). Detailed information of the methodology of the survey is openly available (15). For the current study, only data from the adult population over 15 years old living in family dwellings were used; a sample of 23,089 people being reached.
Study population
Firstly, those individuals who responded affirmatively to the 2 questions: “Have you suffered from chronic back pain in the last 12 months?” and “Has the doctor told you that you suffer from chronic back pain?” were selected to form the population diagnosed with CLBP. Secondly, since this study aimed to categorize the sample according to the PA level defined in the short-form version of the International Physical Activity Questionnaire (IPAQ) (16) for the adult population (age range 15–69 years), the study sample was limited to those subjects with diagnosed CLBP who were under 70 years of age.
Study variables
To evaluate the PA levels of the population, this study used data obtained from the validated Spanish short-form version of the IPAQ, administered to respondents under 70 years old. This tool includes questions about 3 types of activity (walking, moderate-intensity activities, and vigorous-intensity activities) performed over the last 7 days, and a question about the time spent sitting. IPAQ short form variables can be analysed as continuous and categorical. In continuous scores, the results are reported in metabolic equivalent of tasks (MET)-min/week. MET is defined as the metabolic rate when sitting at rest, and is a concept to quantify the energy cost of physical activities (17). For the IPAQ data analysis, MET values correspond to the intensity of the activities (walking = 3.3 METs, moderate PA = 4 METs, and vigorous PA = 8 METs), which are multiplied by duration (min) and frequency (days/week). The overall PA score is the sum of the 3 MET-min/week activities. Three PA levels were defined to classify the population, low, moderate, and high, following the guidelines of the IPAQ (18). The “high” level is defined by a total vigorous-intensity PA of a least 1,500 MET-min/week or any combination of the 3 activities with a total PA of a least 3,000 MET-min/week. The “moderate” level is defined by any combination of the 3 activities with a total PA of at least 600 MET-min/week, but without meeting the criteria of the high PA group. And “low” is assigned when the criteria of the other 2 levels is not met.
Furthermore, the variables analysed in this study are shown and described in Appendix S1, and included sociodemographic characteristics, lifestyle information, and 2 questions for caregivers. The study analysed information on perceived health status, diagnosed chronic comorbidities, severity of pain in the previous 4 weeks, taking pain-relief medication, and consumption of other naturopathic and homeopathic products. Diagnosed chronic comorbidities were selected from those with a prevalence of more than 20% in our study sample, including hypertension, high cholesterol, arthrosis, chronic neck pain, migraine, chronic depression, and chronic anxiety. Moreover, mental health status was assessed using the validated Spanish version of the General Health Questionnaire (GHQ-12) to evaluate the overall psychological well-being of the individual to detect non-psychotic psychiatric problems (19). The total score ranged from 0 to 12, with higher scores being considered a worse state of mental health. A GHQ-12 cut-off score > 3 denotes psychological distress (20).
The Duke-UNK Functional Social Support Questionnaire (DUKE-UNC-11) was used to assess emotional and social support (21). Overall score ranged from 11 to 55, categorizing the social support perceived by the individuals as “low” (< 32) and “normal” (≥ 32). Levels of occupational stress and job satisfaction were also collected using a numerical rating scale of 1–7.
Regarding the use of healthcare consultations and other care services, we selected 6 questions about visits to the physiotherapist and psychologist/psychiatrist, as well as alternative medicines during the previous 12 months.
Finally, information about the respondent’s limitations was also analysed. The questions referred to limitation caused by any health problem in the last 6 months and the type of limitation causing difficulty (physical and/or mental), physical and cognitive limitations, limitations in performing activities of daily living and household-related chores. A question about pain interference was also included.
Statistical analysis
First, a descriptive analysis of the characteristics of the studied sample with diagnosed CLBP under 70 years old was performed. Likewise, the prevalence of low, moderate, and high PA levels among subjects with CLBP was estimated, along with 95% confidence intervals (95% CI). Differences between groups were analysed using the χ2, likelihood ratio, and Kruskal-Wallis tests. Furthermore, a stepwise ordinal regression model was performed to identify the factors associated with the level of PA, where PA level was the dependent variable, and sociodemographic and social variables, health-related status, comorbidities, and health use were the independent variables. The criteria used to include the variables in the model were clinical and statistical significance (p < 0.05). The IBM Statistical Package for the Social Sciences (SPSS, IBM Corporation, Somers, NY, USA) version 24.0 statistical tool was used to perform the analyses.
RESULTS
A total of 3,220 subjects diagnosed with CLBP under 70 years old were analysed, 59% of whom were female and the mean (standard deviation (SD) age was 52.29 (11.60) years). The subjects were most frequently active employees (47.7%), overweight (39.4%), reported that their type of work was “standing without great efforts” (46.3%), and 39.4% did not do exercise in their leisure time. In terms of health status, 42.1% of the subjects perceived their overall health status during the last year as good-very good; additional diagnoses of chronic neck pain (50.8%) and arthrosis (38.3%) were the most frequent; most reported a moderate level of pain (29.8%), took pain medication (70.8%), and requested healthcare consultations mostly for physiotherapy (31.7%). The GHQ-12 score was relatively low in the population (mean 2.35 (3.27)). Table I shows more detail about sociodemographic and health status-related variables.
| Total sample CLBP (n = 3,220) | Physical activity level (IPAQ) | p-value# | |||
| Low (n = 964) | Moderate (n = 1,707) | High (n = 549) | |||
| Sociodemographic | |||||
| Age, mean (SD) | 52.29 (11.60) | 52.78 (11.1) | 53.01 (11.5) | 49.20 (12.3) | < 0.001c |
| Sex, n (%) Males Females |
1,319 (41.0) 1,901 (59.0) |
378 (39.2) 589 (60.8) |
661 (38.7) 1,046 (61.3) |
280 (51.0) 269 (49.0) |
< 0.001a |
| Marital status (n = 3,217*), n (%) Single Married Widow Separated Divorced |
620 (19.3) 2,001 (62.2) 210 (6.5) 117 (3.6) 269 (8.4) |
172 (17.8) 614 (63.7) 56 (5.8) 40 (4.1) 82 (8.5) |
321 (18.8) 1,050 (61.6) 131 (7.7) 55 (3.2) 147 (8.6) |
127 (23.1) 337 (61.4) 23 (4.2) 22 (4.0) 40 (7.3) |
0.026a |
| Educational level, n (%) None Primary Secondary Professional training University |
267 (8.3) 615 (19.1) 1,286 (39.9) 584 (18.2) 468 (14.5) |
16 (1.7) 312 (32.4) 369 (38.3) 166 (17.2) 101 (10.5) |
9 (0.5) 438 (25.7) 691 (40.4) 304 (17.8) 265 (15.5) |
3 (0.5) 104 (19) 226 (41.2) 114 (20.8) 102 (18.6) |
< 0.001a |
| Employment status (n = 3,217*), n (%) Active Unemployed Retired/Early retired Student Unable to work Homemaker Others |
1,533 (47.7) 482 (15.0) 609 (18.9) 48 (1.5) 212 (6.6) 333 (10.4) 3 (0.1) |
436 (45.2) 132 (13.7) 183 (19.0) 5 (0.5) 105 (10.9) 103 (10.7) 0 (0.0) |
778 (45.7) 257 (15.1) 355 (20.8) 28 (1.6) 91 (5.3) 195 (11.4) 0 (0.0) |
319 (58.1) 93 (16.9) 71 (12.9) 15 (2.7) 16 (2.9) 35 (6.4) 0 (0.0) |
< 0.001a |
| Lifestyle habits | |||||
| Smoking habits (n = 3,218*), n (%) Smoker Ex-smoker Non-smoker |
985 (30.6) 947 (29.4) 1286 (40) |
319 (33.1) 269 (27.9) 375 (39) |
488 (28.6) 505 (29.6) 714 (41.8) |
178 (32.5) 173 (31.6) 197 (35.9) |
0.037b |
| Alcohol consumption (n = 3216*), n (%) Yes No |
2,142 (66.6) 1,074 (33.4) |
587 (60.9) 377 (39.1) |
1,143 (67.0) 563 (33.0) |
412 (75.5) 134 (24.5) |
< 0.001a |
| BMI (n = 3,131*), n (%) Underweight Normal Overweight Obesity |
64 (2.0) 1,108 (35.4) 1,233 (39.4) 726 (23.2) |
24 (2.6) 294 (31.9) 337 (36.6) 266 (28.9) |
27 (1.6) 601 (36.0) 670 (40.1) 372 (22.3) |
13 (2.4) 213 (39.4) 226 (41.9) 88 (16.3) |
< 0.001a |
| Frequency of PA in leisure time, n (%) No exercise Occasionally Several times per month Several times per week |
1,317 (40.9) 1,278 (39.7) 356 (11.1) 269 (8.4) |
730 (75.7) 168 (17.4) 45 (4.7) 21 (2.2) |
489 (28.6) 912 (53.4) 185 (10.8) 121 (7.1) |
98 (17.9) 198 (36.1) 126 (23.0) 127 (23.1) |
< 0.001a |
| Type of activity during work, school, home, etc. (n = 3,219*), n (%) Sitting during the working day Standing without great efforts Walking, carrying some weight, with frequent displacements Tasks with great efforts Not applicable |
1,053 (32.7) 1,490 (46.3) 440 (13.7) 118 (3.7) 118 (3.6) |
430 (44.6) 386 (40.0) 96 (10.0) 27 (2.8) 25 (2.6) |
491 (28.9) 852 (49.9) 236 (13.8) 48 (2.8) 79 (4.6) |
132 (24.0) 252 (45.9) 108 (19.7) 43 (7.8) 14 (2.6) |
< 0.001a |
| Care for another person (n = 3,217*), n (%) Yes No |
583 (18.1) 2,634 (81.9) |
158 (16.4) 806 (83.6) |
332 (19.5) 1,373 (80.5) |
93 (17.0) 455 (83.0) |
0.104a |
| Care hours (n = 518*), n (%) Less than 10 h per week 10 or more h per week 20 or more h per week |
200 (34.5) 128 (22.0) 253 (43.5) |
52 (32.9) 31 (19.6) 75 (47.5) |
116 (35.0) 68 (20.5) 147 (44.4) |
32 (34.8) 29 (31.5) 31 (33.7) |
0.120a |
| Health status | |||||
| Perceived health status over the previous 12 months, n (%) Very good-Good Fair Bad-Very bad |
1,357 (42.1) 1,261 (39.2) 602 (18.7) |
298 (31.0) 367 (38.1) 299 (31.0) |
761 (44.6) 692 (40.5) 254 (14.9) |
298 (54.3) 202 (36.8) 49 (8.9) |
< 0.001a |
| Chronic comorbidities diagnosis | |||||
| Hypertension, n (%) Yes No |
940 (29.2) 2,280 (70.8) |
340 (35.3) 624 (64.7) |
484 (28.4) 1,223 (71.6) |
116 (21.1) 433 (78.9) |
< 0.001a |
| Cholesterol, n (%) | |||||
| Yes | 991 (30.8) | 314 (32.6) | 540 (31.6) | 137 (25.0) | 0.005a |
| No | 2,229 (69.2) | 650 (67.4) | 1,167 (68.4) | 412 (75.0) | |
| Arthrosis, n (%) Yes No |
1,233 (38.3) 1987 (61.7) |
433 (44.9) 531 (55.1) |
640 (37.5) 1067 (62.5) |
160 (29.1) 389 (70.9) |
< 0.001a |
| Chronic neck pain, n (%) Yes No |
1,637 (50.8) 1,583 (49.2) |
539 (55.9) 425 (44.1) |
867 (50.8) 840 (49.2) |
231 (42.1) 318 (57.9) |
< 0.001a |
| Migraine, n (%) Yes No |
693 (21.5) 2,527 (78.5) |
238 (24.7) 726 (75.3) |
340 (19.9) 1,367 (80.1) |
115 (20.9) 434 (79.1) |
0.015a |
| Chronic depression, n (%) Yes No |
731 (22.7) 2,489 (77.3) |
281 (29.1) 683 (70.9) |
363 (21.3) 1,344 (78.7) |
87 (15.8) 462 (84.2) |
< 0.001a |
| Chronic anxiety, n (%) Yes No |
676 (21.0) 2,544 (79.0) |
260 (27.0) 704 (73.0) |
338 (19.8) 1,369 (80.2) |
78 (14.2) 471 (85.8) |
< 0.001a |
| Degree of limitation experienced at least 6 months due to a health problem, n (%) Severely limited Limited Not at all limited |
317 (9.8) 1,316 (40.9) 1,587 (49.3) |
183 (19.0) 402 (41.7) 379 (39.3) |
115 (6.7) 718 (42.1) 874 (51.2) |
19 (3.5) 196 (35.7) 334 (60.8) |
< 0.001a |
| Type of limitation causing difficulty (n = 1,633*), n (%) Physical Mental Both |
1,426 (87.3) 35 (2.1) 172 (10.5) |
501 (85.6) 12 (2.1) 72 (12.3) |
734 (88.1) 20 (2.4) 79 (9.5) |
191 (88.8) 3 (1.4) 21 (9.8) |
0.421a |
| Level of pain in the previous 4 weeks None Very mild-Mild Moderate Severe-Extreme |
716 (22.2) 884 (27.5) 958 (29.8) 662 (20.6) |
148 (15.4) 209 (21.7) 301 (31.2) 306 (31.8) |
412 (24.1) 495 (29) 503 (29.5) 297 (17.4) |
156 (28.4) 180 (32.7) 154 (28.1) 59 (10.7) |
< 0.001a |
| Pain medication taken in the previous 2 weeks (n = 2,688*), n (%) Yes No |
1,904 (70.8) 784 (29.2) |
652 (76.9) 196 (23.1) |
968 (68.3) 449 (31.7) |
284 (67.1) 139 (32.9) |
< 0.001a |
| Homeopathic consumption (n = 2,688*), n (%) Yes No |
45 (1.4) 2,643 (82.1) |
10 (1.2) 838 (98.8) |
26 (1.8) 1,391 (98.2) |
9 (2.1) 414 (97.9) |
0.366a |
| Naturopathic consumption (n = 2,688*), n (%) Yes No |
131 (4.9) 2,557 (95.1) |
31 (3.7) 817 (96.3) |
67 (4.7) 1,350 (95.3) |
33 (7.8) 390 (92.2) |
0.005a |
| GHQ-12 scores (n = 3,218*), mean (SD) | 2.35 (3.27) | 3.07 (3.8) | 2.14 (3.1) | 1.73 (2.6) | < 0.001c |
| DUKE categorical scores (n = 3,104*), n (%) Low social support (< 32) Normal social support (≥32) |
168 (5.4) 2936 (94.6) |
81 (8.6) 857 (91.4) |
75 (4.6) 1565 (95.4) |
12 (2.3) 514 (97.7) |
< 0.001a |
| DUKE overall score (n = 3,104*), mean (SD) | 46.62 (8.04) | 45.10 (9.0) | 47.03 (7.7) | 48.02 (7.0) | < 0.001c |
| Level of job stress (n = 1,517*), mean (SD) | 4.66 (1.70) | 4.71 (1.7) | 4.70 (1.7) | 4.50 (1.8) | 0.282c |
| Level of job satisfaction (n = 1,518*), mean (SD) | 5.30 (1.55) | 5.22 (1.6) | 5.30 (1.5) | 5.39 (1.6) | 0.216c |
| Visit to physiotherapist over the previous 12 months, n (%) Yes No |
1,021 (31.7) 2,199 (68.3) |
280 (29.0) 684 (71.0) |
539 (31.6) 1,168 (68.4) |
202 (36.8) 347 (63.2) |
0.008a |
| Visit to psychologist/psychiatrist over the previous 12 months (n = 3,219*), n (%) Yes No |
352 (10.9) 2,867 (89.1) |
135 (14.0) 829 (86.0) |
171 (10.0) 1,535 (90.0) |
46 (8.4) 503 (91.6) |
0.001a |
| Visit to homeopath over the previous 12 months, n (%) Yes No |
69 (2.1) 3,151 (97.9) |
15 (1.6) 949 (98.4) |
41 (2.4) 1,666 (97.6) |
13 (2.4) 536 (97.6) |
0.323a |
| Visit to acupuncturist over the previous 12 months, n (%) Yes No |
88 (2.7) 3,132 (97.3) |
25 (2.6) 939 (97.4) |
46 (2.7) 1,661 (97.3) |
17 (3.1) 532 (96.9) |
0.838a |
| Visit to naturopath over the previous 12 months, n (%) Yes No |
75 (2.3) 3,145 (97.7) |
19 (2.0) 945 (98.0) |
38 (2.2) 1,669 (97.8) |
18 (3.3) 531 (96.7) |
0.247a |
| Visit to another alternative medicine over the previous 12 months (n = 3,219*), n (%) Yes No |
177 (5.5) 3,042 (94.5) |
32 (3.3) 932 (96.7) |
97 (5.7) 1,609 (94.3) |
48 (8.7) 501 (91.3) |
< 0.001b |
| Degree of limitation suffered over at least 6 months due to a health problem, n (%) | |||||
| Severely limited | 317 (9.8) | 183 (19.0) | 115 (6.7) | 19 (3.5) | <0.001a |
| Limited | 1,316 (40.9) | 402 (41.7) | 718 (42.1) | 196 (35.7) | |
| Not at all limited | 1,587 (49.3) | 379 (39.3) | 874 (51.2) | 334 (60.8) | |
| Type of limitation causing difficulty (n = 1,633*), n (%) Physical Mental Both |
1,426 (87.3) 35 (2.1) 172 (10.5) |
501 (85.6) 12 (2.1) 72 (12.3) |
734 (88.1) 20 (2.4) 79 (9.5) |
191 (88.8) 3 (1.4) 21 (9.8) |
0.421a |
| Physical limitations | |||||
| Difficulty walking 500 metres, n (%) No difficulty Some difficulty Great difficulty Unable to do it |
2,621 (81.1) 380 (11.8) 160 (5.0) 59 (1.8) |
625 (64.8) 172 (17.8) 115 (11.9) 52 (5.4) |
1,484 (86.9) 176 (10.3) 41 (2.4) 6 (0.4) |
512 (93.3) 32 (5.8) 4 (0.7) 1 (0.2) |
< 0.001a |
| Difficulty walking up or down 12 steps, n (%) No difficulty Some difficulty Great difficulty Unable to do it |
2,411 (74.9) 480 (14.9) 275 (8.5) 54 (1.7) |
568 (58.9) 183 (19.0) 165 (17.1) 48 (5.0) |
1,359 (79.6) 240 (14.1) 102 (6.0) 6 (0.4) |
484 (88.2) 57 (10.4) 8 (1.5) 0 (0.0) |
< 0.001a |
| Cognitive limitations | |||||
| Difficulty to remember or concentrate (n = 2,441*), n (%) No difficulty Some difficulty Great difficulty Unable to do it |
1,862 (76.3) 498 (20.4) 77 (3.2) 4 (0.2) |
520 (69.6) 191 (25.6) 32 (4.3) 4 (0.5) |
1,053 (79.0) 243 (18.2) 37 (2.8) 0 (0.0) |
289 (80.1) 64 (17.7) 8 (2.2) 0 (0.0) |
< 0.001b |
| BMI: body mass index; CLBP: chronic low back pain; DUKE: Duke-UNK Functional Social Support Questionnaire; GHQ-12: General Health Questionnaire; IPAQ: International Physical Activity Questionnaire; PA: physical activity; SD: standard deviation. #Differences between PA groups; aPearson’s χ2; bLikelihood function; cKruskal-Wallis H test. *Sample of IPAQ respondents. |
|||||
Concerning activity limitations, the study shows that 50.7% of subjects were limited in the last 6 months by a health problem, and most reported a physical type of limitation (87.3%). Nevertheless, they most frequently reported that the level of pain had not affected daily activities at all in the previous 4 weeks (33.4%) (Table I). In fact, the only question that some subjects (17.8%) responded they were “unable to do” was the question related to performing household chores. Figs 1 and 2 show more details of activity limitation variables.
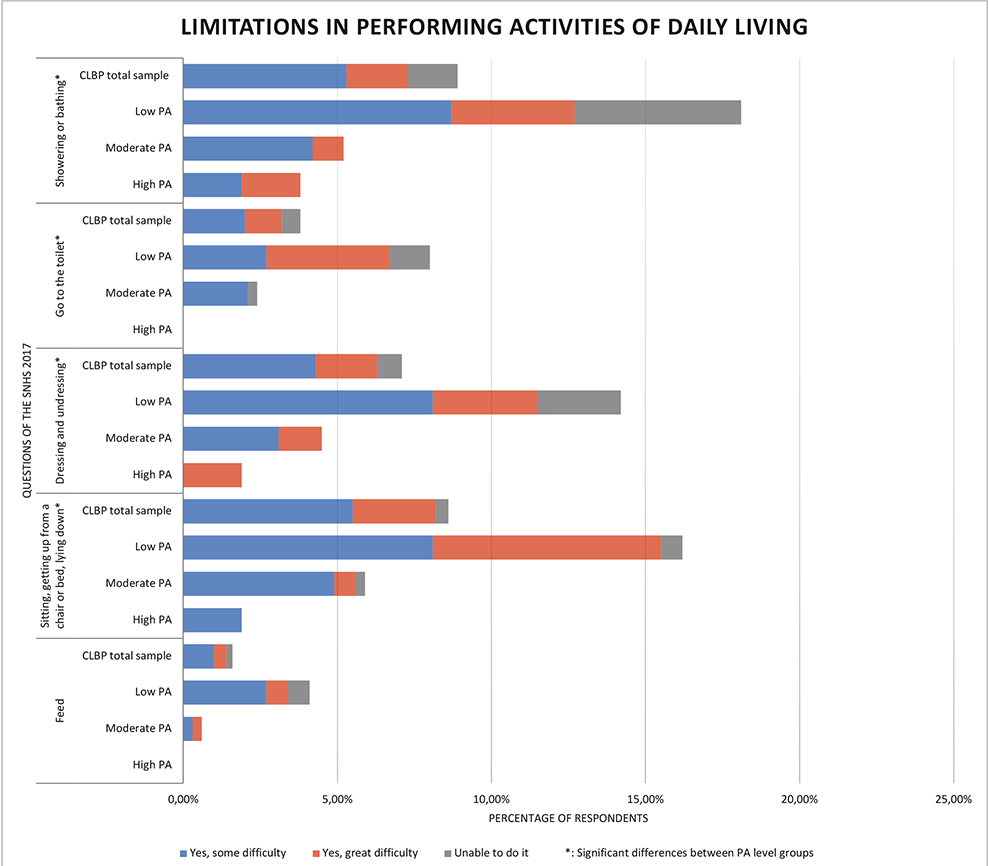
Fig. 1. Limitations in performing activities of daily living. PA: physical activity; CLBP: chronic low back pain.
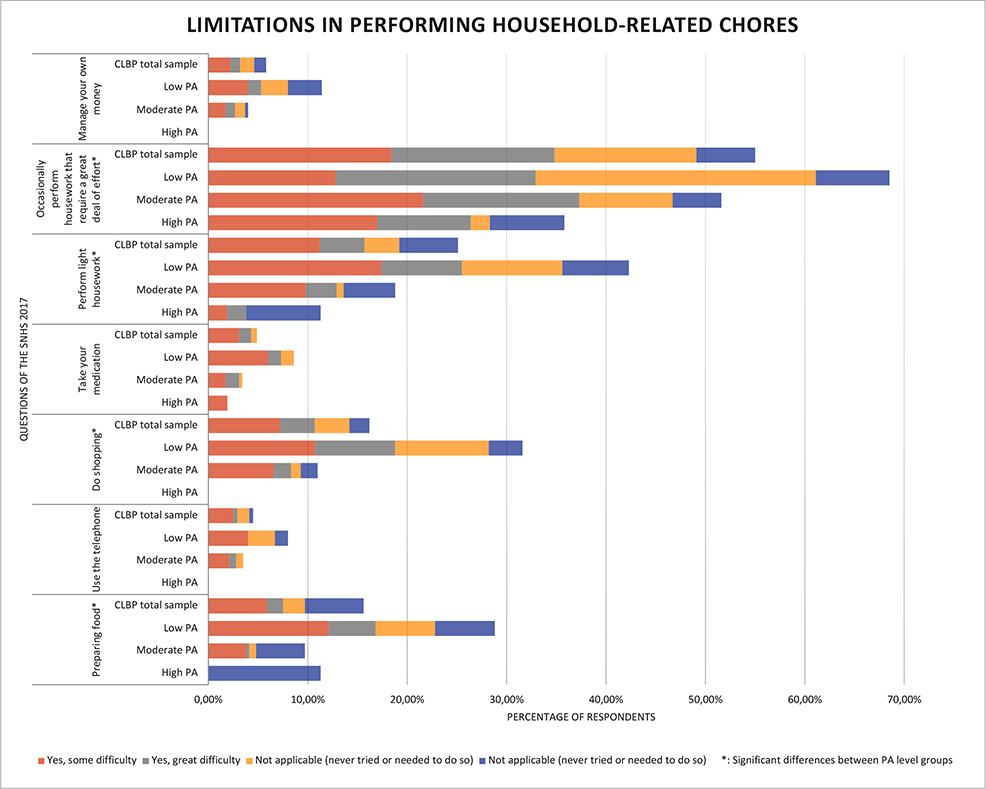
Fig. 2. Limitations in performing household-related chores. PA: physical activity; CLBP: chronic low back pain.
Differences between physical activity level groups
According to the IPAQ questions, 30% (95% CI 28.34–31.54) of the studied sample performed low PA, 53% (95% CI 51.27–54.75) moderate PA, and 17% (95% CI 15.74–18.36) high PA. Comparing these groups showed that the high PA group had a lower mean (SD) age (49.20 (12.3) years), had a similar proportion of females and males, and had the highest percentage of single people (23.1%). Meanwhile, the low PA group presented lower educational levels (34%), and 11% were on sick leave, which was more than in the moderate (5.3%) and high PA (3%) groups. In addition, 27.6% of subjects in the low PA group were obese, the most frequent occupational activity was “sitting during the working day” (44.6%) and a higher percentage of subjects did not perform PA in their leisure time (75.7%) (Table I).
In relation to health status, 31% of the subjects in the low PA group reported their perceived health status during the previous 12 months as “bad” or “very bad”, compared with 15% and 9% in the moderate and high PA groups, respectively. Similarly, the percentage of subjects who had chronic comorbidities increased as the PA level decreased (Table I). Also, the low PA group most frequently had severe-extreme pain (31.8%) and took more pain-relief medication (77%). Likewise, the subjects in this group scored highest on the GHQ-12 (mean = 3.07) and visited the psychologist or psychiatrist more frequently (14%). Conversely, subjects in the high PA group visited physiotherapists more frequently (36.8%) or used other alternative medicine (8.7%) and consumed more naturopathic products (7.8%) compared with the other groups. The highest overall score on the DUKE-UNC-11 was obtained by the high PA group (mean = 48.02), in which 97.7% reported “normal” social support (Table I).
Regarding physical and cognitive limitations, the study showed that 19% of the subjects in the low PA group were “severely limited” during the previous 6 months. This group also reported the most that both physical and mental health problems caused the limitations (12.3%) (Table I). In addition, the percentage of subjects who responded “some or great difficulty” increased as the PA level decreased (Figs 1 and 2). Of note are the percentages of subjects in the low PA group who could not perform light household chores (10.1% vs 0.7% and 0%) and household chores with a great deal of effort (28.2% vs 9.4% and 2%) compared with the other 2 groups (Figs 1 and 2). Finally, 78.1% of the subjects in the low PA group reported some pain impairment in activities of daily living compared with the moderate and high PA groups (63.9% and 55.2%, respectively) (Table I).
Factors related to levels of physical activity
Analysis of factors related to PA levels revealed that the following are more likely to have a higher level of PA: males (odds ratio (OR) 1.22); subjects with normal or overweight BMI, in relation to obesity (OR 1.36 and OR 1.35, respectively); subjects with a very good/good or fair perceived health status (OR 1.60 and OR 1.41, respectively); those with moderate pain, compared with severe-extreme pain (OR 1.49); those without difficulty or some difficulty or difficulty walking 500 m, in relation to those unable to do it (OR 14.44, OR 7.85 and OR 3.07, respectively); those without difficulty or difficulty to remember or concentrate, in relation to those unable to do it; and those with a high level of personal emotional support (OR 1.02) (Table II).
| B (SE) | OR (95% CI) | p-value | |
| Umbral Low PA Moderate PA High PA* |
19.159 (0.56) 21.953 (0.56) |
209241574.2 (70420854.1; 622341789.1) 3420320167.9 (1131714979.4; 10326714342.2) |
< 0.001 < 0.001 |
| Sex Males Females* |
0.202 (0.9) |
1.224 (1.030; 1.455) |
0.021 |
| BMI Underweight Normal Overweight Obesity* |
0.291 (0.39) 0.309 (0.11) 0.298 (0.11) |
1.338 (0.629; 2.843) 1.362 (1.089; 1.702) 1.347 (1.092; 1.662) |
0.450 0.007 0.005 |
| Perceived health status over the previous 12 months Very good-Good Fair Bad-Very bad* |
0.471 (0.14) 0.341 (0.13) |
1.602 (1.213; 2.117) 1.406 (1.097; 1.804) |
0.001 0.007 |
| Level of pain in the previous 4 weeks None Very mild-Mild Moderate Severe-Extreme* |
0.286 (0.15) 0.398 (0.13) 0.169 (0.12) |
1.331 (0.996; 1.778) 1.489 (1.147; 1.933) 1.184 (0.928; 1.511) |
0.053 0.003 0.173 |
| Difficulty walking 500 m No difficulty Some difficulty Great difficulty Unable to do it* |
2.670 (0.45) 2.061 (0.46) 1.123 (0.48) |
14.440 (6.007; 34.674) 7.854 (3.219; 19.183) 3.074 (1.196; 7.909) |
< 0.001 < 0.001 0.020 |
| Difficulty to remember or concentrate No difficulty Some difficulty Great difficulty Unable to do it* |
15.658 (0.26) 15.745 (0.26) 15.946 (0.00) |
6312232.66 (3828562.6; 10407112.24) 6885993.6 (4114385.3; 11524664.1) 8418986.4 (8418986.4; 8418986.4) |
< 0.001 < 0.001 < 0.001 |
| DUKE overall score | 0.023 (0.01) | 1.023 (1.013; 1.034) | < 0.001 |
| Dependent variable: Level of Physical Activity (IPAQ): Low, Moderate, High*. *Reference category. Goodness of fit: Deviance: χ2 = 2767.042, p = 0.943; Parallel lines test: χ2 = 19.636, p = 0.237. |
|||
DISCUSSION
This study analyses PA levels in the general Spanish adult population under 70 years old with CLBP, establishes groups according to PA levels and identifies the factors related to these groups. A total of 30% of the sample performed low PA and only 17% high PA, differences found between these groups. The literature suggests individual-level reasons associated with PA adherence, such as demographic, health-related, physical and psychological factors (22). Thus, males and subjects with normal or overweight BMI had a higher PA level, with a better perceived health status, lower level of pain, fewer physical and cognitive limitations, and greater social support. In that sense, the global well-being provided by PA has been widely described, for both the general and specific populations (23). Because PA affects different health-related spheres (pain, sleep quality, cognition and functionality), it is considered a modality of the care management for several chronic pain conditions (11). PA has been shown to reduce the severity of chronic pain and improve physical functioning (24). Furthermore, an inverse association between physical disability and PA (25) suggests that higher levels of disability are related to lower levels of PA. Therefore, these findings help to explain why clinical practice guidelines consider PA as a main goal of multidisciplinary programmes for CLBP (26).
The low PA group reported a higher level of pain and took more pain-relief medication. In addition, a lower level of pain (moderate vs severe-extreme) was associated with a higher PA level. The effects of PA on LBP symptomatology stated in the literature could explain this association. In this sense, Middelkoop et al. (27) showed that PA interventions improved the level of pain, disability, and long-term function in subjects with CLBP. Moreover, Ambrose et al. (11) reported that the inclusion of PA programmes as part of the prevention and management of chronic pain conditions is endorsed by the resulting improvements in pain and related symptoms. Thus, the aforementioned effects of PA on reducing pain could be an alternative to the prescription of medication as a first treatment option for the management of subjects with CLBP (28), encouraging active treatments and some recommendations, such as avoiding bed rest, staying active and continuing with activities of daily living (12, 29).
PA also reduces the risk of mental health problems, an inverse association having been reported between these 2 variables (30). The low PA group obtained the highest mean score in the GHQ-12, being the only group to reach the cut-off point to determine psychological distress. Moreover, these subjects had visited psychologists or psychiatrists more frequently during the last year. In this sense, the relationship between mental health and PA behaviour is based on physiological and psychological mechanisms, showing the favourable influences of PA on mood states, such as stress, anxiety, and depression (31). In contrast, a sedentary lifestyle is correlated with depression, morbidity and psychological distress (32).
The current study found a relationship between a lower level of PA and difficulty remembering or concentrating. Accordingly, the positive influence of PA on cognition is well-described, the direct relationship between PA and improvements in specific cognitive functions, such as learning and memory, having been reported. Those associations seem to depend on different PA modalities and their characteristics, such as intensity (34). In fact, Stenling et al. (35) observed that higher levels of PA were related to a lower reduction in memory recall, suggesting the protective effect of PA on cognitive functions. Some findings showed that subjects who engaged in more PA were better able to upregulate their attentional inhibition and to achieve better performance on tests of cognitive control (25, 36). Furthermore, greater amounts of PA are associated with a reduced risk of developing cognitive impairment (37) and moderate-high intensity PA during adulthood could maintain and alleviate the decline in cognitive functions in old age (34). Thus, some factors related to the effects of PA on mental and cognitive issues, such as elderly age, presence of chronic diseases, poor adherence to PA programmes, individuals’ preferences and experiences, and the place in which PA is performed might be considered when recommending PA programmes (20, 30).
Social support is another key factor related to a higher PA level, subjects performing more PA reporting higher scores on the DUKE-UNC-11. Along with intrinsic motivation, psychological satisfaction and self-efficacy, social support plays a significant role in enhancing a participant’s engagement, increasing adherence and promoting a healthy lifestyle (38, 39). In fact, several theories of behaviour change highlight the relevance of social factors, such as social support and social connectedness, in both starting and maintaining behaviour change, also applied to PA (39). In older and middle-aged adults, social support is a social determinant of health and an influential behaviour change approach to promote PA (38, 40). Similarly, Picorelli et al. (22) related both motivation and goal-directed behaviours to promoting and striving for adherence to PA-based interventions. Therefore, strategies to promote and enhance participation in PA may consider social support and reinforcement as key factors to be included.
Finally, other demographic and lifestyle factors have been related to PA. Sex differences could be explained because practicing sport appears to be related to traditional norms and social gender inequalities, varying between countries and associated with higher national gender disparity (41). Another sex difference that could explain the current findings is the reasons for participation in PA. While females reported higher motivation for appearance, physical attractiveness, and health than males, males were more motivated by competition/ego, mastery, and affiliation (42).
In relation to age, although the model did not show an association between age and PA levels, the high PA group had the lowest mean age, and older people were more frequently in the low and moderate PA groups. Younger age is a factor associated with adherence to exercise or activity recommendations among the adult population (42), and appears to be related to a health-promoting behaviour. A lifestyle involving regular PA and its maintenance is difficult for the population of all ages (22), with the proportion of subjects who are active enough to obtain health benefits decreasing over the years (42).
The current study revealed an association between PA levels and obesity and/or overweight conditions, the lower PA group presenting a higher percentage of obesity. Thus, the negative effects of overweight and obesity on the risk of LBP (43) are well documented. The secretion of several inflammatory markers by adipose tissue seems to be related to the pain sensation in LBP (44). Thus, maintaining a healthy body composition could be one of the preventive components of LBP (43). In any case, according to the literature, regular participation in PA programmes has a positive influence on the change in body composition, modulating the risk of overweight and obesity (43), as well as providing anti-inflammatory benefits, which contributes to musculoskeletal pain relief (44).
Study limitations
Some strengths and limitations of the current study should be noted. On the one hand, the main strength is that it is a nationwide study using a representative sample of the Spanish population and using standardized health-related questionnaires and measurements. Also, to our knowledge, this is the first national survey-based study analysing PA levels in a population with a specific pain condition, CLBP, as well as biopsychosocial factors related to this health condition and PA habits. On the other hand, some limitations should be highlighted. First, it is a cross-sectional study; hence, the associations described cannot be considered to be causal. Secondly, the study defined the CLBP sample based on 2 self-reported questions of the survey, which could lead to a risk of information bias. Thirdly, the relationship analysed with mental health and social support is also based on participant self-reported questionnaires. Finally, information about the levels of PA in older adults (> 70 years of age) was not available for analysis, which may be a limitation of studies based on the use of secondary data.
CONCLUSION
This study reveals the characteristics and biopsychosocial factors associated with different PA levels in subjects with CLBP. Compared with the low PA group, the high PA group was composed of more males and subjects with normal or overweight BMI, who perceived their health status as better, reported a lower level of pain, and were less limited by a health problem. In addition, they had greater personal emotional support. Understanding the factors influencing levels of PA and the different biopsychosocial aspects associated with them in subjects with CLBP should be taken into consideration when establishing suitable public health strategies.
ACKNOWLEDGEMENTS
This work was supported by a collaboration between the University of Cádiz and the Grünenthal Foundation. The Grünenthal Foundation is a private, non-profit organization that promotes the dissemination of scientific knowledge and supports research.
This work was supported by the Spanish Ministry of Science, Innovation and Universities: grant number [FPU19/04377].
REFERENCES
- Cohen SP, Vase L, Hooten WM. Chronic Pain 1 Chronic pain: an update on burden, best practices, and new advances. Lancet 2021; 397: 2082–2097. DOI: 10.1016/S0140-6736(21)00393-7
- Hoy D, March L, Brooks P, Blyth F, Woolf A, Bain C, et al. The global burden of low back pain: Estimates from the Global Burden of Disease 2010 study. Ann Rheum Dis 2014; 73: 968–974. DOI: 10.1136/annrheumdis-2013-204428
- Fatoye F, Gebrye T, Odeyemi I. Real-world incidence and prevalence of low back pain using routinely collected data. Rheumatol Int 2019; 39: 619–626. DOI: 10.1007/s00296-019-04273-0
- Mills SEE, Nicolson KP, Smith BH. Chronic pain: a review of its epidemiology and associated factors in population-based studies. Br J Anaesth 2019; 123: 273–283. DOI: 10.1016/j.bja.2019.03.023
- Alonso-García M, Sarría-Santamera A. The economic and social burden of low back pain in spain: a national assessment of the economic and social impact of low back pain in Spain. Spine 2020; 45: 1026–1032. DOI: 10.1097/brs.0000000000003476
- Palazzo C, Ravaud JF, Papelard A, Ravaud P, Poiraudeau S. The burden of musculoskeletal conditions. PLoS One 2014; 9: 90633. DOI: 10.1371/journal.pone.0090633
- Maher C, Underwood M, Buchbinder R. Non-specific low back pain. Lancet 2017; 389: 736–747. DOI: 10.1016/s0140-6736(16)30970-9
- Parreira P, Maher CG, Steffens D, Hancock MJ, Ferreira ML. Risk factors for low back pain and sciatica: an umbrella review. Spine J 2018; 18: 1715–1721. DOI: 10.1016/j.spinee.2018.05.018
- Ampiah PK, Hendrick P, Moffatt F, Ahenkorah J. Operationalisation of a biopsychosocial approach for the non-pharmacological management of patients with chronic musculoskeletal pain in low- and middle-income countries: a systematic review. Musculoskelet. Care 2020; 18: 227–244. DOI: 10.1002/msc.1462
- Corp N, Mansell G, Stynes S, Wynne-Jones G, Morsø L, Hill JC, et al. Evidence-based treatment recommendations for neck and low back pain across Europe: a systematic review of guidelines. Eur J Pain 2021; 25: 275–295. DOI: 10.1002/ejp.1679
- Ambrose KR, Golightly YM. Physical exercise as non-pharmacological treatment of chronic pain: why and when. Best Pract Res Clin Rheumatol 2015; 29: 120–130. DOI: 10.1016/j.berh.2015.04.022
- Foster NE, Anema JR, Cherkin D, Chou R, Cohen SP, Gross DP, et al. Prevention and treatment of low back pain: evidence, challenges, and promising directions. Lancet 2018; 39: 2368–2383. DOI: 10.1016/s0140-6736(18)30489-6
- Gupta N, Rasmussen CL, Hartvigsen J, Mortensen OS, Clays E, Bültmann U, et al. Physical activity advice for prevention and rehabilitation of low back pain- same or different? A study on device-measured physical activity and register-based sickness absence. J Occup Rehabil 2022; 32: 284–294. DOI: 10.1007/s10926-021-10005-8
- Dueñas M, Munoz JAM, Osuna JP, Salazar A. Differences in physical and psychological health in patients with chronic low back pain : a national survey in general Spanish population. Qual Life Res 2020; 29: 2935–2947. DOI: 10.1007/s11136-020-02553-y
- Ministerio de Sanidad, Servicios Sociales e Igualdad. Madrid: Ministerio de Sanidad, Servicios Sociales e Igualdad. https://www.mscbs.gob.es/estadEstudios/estadisticas/encuestaNacional/
- Román Viñas B, Ribas Barba L, Ngo J, Serra Majem L. Validación en población catalana del cuestionario internacional de actividad física. Gac Sanit 2013; 27: 254–257. DOI: 10.1016/j.gaceta.2012.05.013
- Jetté M, Sidney K, Blümchen G. Metabolic equivalents (METS) in exercise testing, exercise prescription, and evaluation of functional capacity. Clin Cardiol 1990; 13: 555–565. DOI: 10.1002/clc.4960130809
- IPAQ Research Committee. Guideline for data processing and analysis of the International Physical Activity Questionnaire (IPAQ)- short and long forms. 2005. https://sites.google.com/site/theipaq/scoring-protocol
- Sánchez-López MDP, Dresch V. The 12-item general health questionnaire (GHQ-12): Reliability, external validity and factor structure in the Spanish population. Psicothema 2008; 20: 839–843.
- Hamer M, Biddle SJH, Stamatakis E. Weekend warrior physical activity pattern and common mental disorder: a population wide study of 108,011 British adults. Int J Behav Nutr Phys Act 2017; 14: 1–6. DOI: 10.1186/s12966-017-0549-0
- Bellón Saameño JA, Delgado Sánchez A, Luna del Castillo JD, Lardelli Claret P. Validez y fiabilidad del cuestionario de apoyo social funcional Duke-UNC-11 [Validity and reliability of the Duke-UNC-11 questionnaire of functional social support]. Aten Primaria 1996; 18: 153–163.
- Picorelli AMA, Pereira LSM, Pereira DS, Felício D, Sherrington C. Adherence to exercise programs for older people is influenced by program characteristics and personal factors: a systematic review. J Physiother 2014; 60: 151–156. DOI: 10.1016/j.jphys.2014.06.012
- Jalayondeja C, Jalayondeja W, Suttiwong J, Sullivan PE, Consultants PT, Centre M, et al. Physical activity, self-esteem, and quality of life among people with physical disability. Southeast Asian J Trop Med Public Heal 2016; 47: 546-558.
- Geneen LJ, Moore RA, Clarke C, Martin D, Colvin LA, Smith BH. Physical activity and exercise for chronic pain in adults: an overview of Cochrane Reviews. Cochrane Database Syst Rev 2017; 2020. DOI: 10.1002/14651858.cd011279.pub3
- Lin CWC, McAuley JH, MacEdo L, Barnett DC, Smeets RJ, Verbunt JA. Relationship between physical activity and disability in low back pain: a systematic review and meta-analysis. Pain 2011; 152: 607–613. DOI: 10.1016/j.pain.2010.11.034
- Chou R, Huffman LH. Nonpharmacologic therapies for acute and chronic low back pain: a review of the evidence for an American Pain Society/American College of Physicians clinical practice guideline. Ann Intern Med 2007; 147: 492–504. DOI: 10.7326/0003-4819-147-7-200710020-00007
- Van Middelkoop M, Rubinstein SM, Kuijpers T, Verhagen AP, Ostelo R, Koes BW, et al. A systematic review on the effectiveness of physical and rehabilitation interventions for chronic non-specific low back pain. Eur Spine J 2011; 20: 19–39. DOI: 10.1007/s00586-010-1518-3
- Tucker HR, Scaff K, McCloud T, Carlomagno K, Daly K, Garcia A, et al. Harms and benefits of opioids for management of non-surgical acute and chronic low back pain: a systematic review. Br J Sports Med 2020; 54: 664. DOI: 10.1136/bjsports-2018-099805
- de Campos TF. Low back pain and sciatica in over 16s: assessment and management NICE Guideline [NG59]. J Physiother 2017; 63: 120. DOI: 10.1016/j.jphys.2017.02.012
- Maynou L, Hernández-Pizarro HM, Rodríguez ME. The association of physical (In)activity with mental health. differences between elder and younger populations: a systematic literature review. Int J Environ Res Public Health 2021; 18: 4771. DOI: 10.3390/ijerph18094771
- Mikkelsen K, Stojanovska L, Polenakovic M, Bosevski M, Apostolopoulos V. Exercise and mental health. Maturitas 2017; 106: 48–56. DOI: 10.1016/j.maturitas.2017.09.003
- Deslandes A, Moraes H, Ferreira C, Veiga H, Silveira H, Mouta R, et al. Exercise and mental health: many reasons to move. Neuropsychobiology 2009; 59: 191–198. DOI: 10.1159/000223730
- Baumgartner NW, Walk AM, Edwards CG, Covello AR, Chojnacki MR, Reeser GE, Taylor AM, Holscher HD, Khan NA. Relationship between physical activity, adiposity, and attentional inhibition. J Phys Act Health 2018; 15: 191-6. DOI: 10.1123/jpah.2017-0181
- Engeroff T, Ingmann T, Banzer W. Physical activity throughout the adult life span and domain-specific cognitive function in old age: a systematic review of cross-sectional and longitudinal data. Sport Med 2018; 48: 1405–1436. DOI: 10.1007/s40279-018-0920-6
- Stenling A, Eriksson Sörman D, Lindwall M, MacHado L. Bidirectional within- and between-person relations between physical activity and cognitive function. J Gerontol - Ser B Psychol Sci Soc Sci 2022; 77: 704–709. DOI: 10.1093/geronb/gbab234
- Zhu W, Wadley VG, Howard VJ, Hutto B, Blair SN, Hooker SP. Objectively measured physical activity and cognitive function in older adults. Med Sci Sports Exerc 2017; 49: 47–53. DOI: 10.1249/mss.0000000000001079
- Erickson KI, Hillman C, Stillman CM, Ballard RM, Bloodgood B, Conroy DE, et al. Physical activity, cognition, and brain outcomes: a review of the 2018 physical activity guidelines. Med Sci Sport Exerc 2019; 51: 1242–1251. DOI: 10.1249/mss.0000000000001936
- Lewis ZH, Swartz MC, Martinez E, Lyons EJ. Social support patterns of middle-aged and older adults within a physical activity app: secondary mixed method analysis. JMIR Aging 2019; 2: 12496. DOI: 10.2196/12496
- Eynon M, Foad J, Downey J, Bowmer Y, Mills H. Assessing the psychosocial factors associated with adherence to exercise referral schemes: a systematic review. Scand J Med Sci Sport 2019; 29: 638–650. DOI: 10.1111/sms.13403
- Swartz MC, Lewis ZH, Swartz MD, Martinez E, Lyons EJ. Brief report: active ingredients for adherence to a tracker-based physical activity intervention in older adults. J Appl Gerontol 2019; 38: 1023–1034. DOI: 10.1177/0733464817739350
- de Looze M, Elgar FJ, Currie C, Kolip P, Stevens GWJM. Gender inequality and sex differences in physical fighting, physical activity, and injury among adolescents across 36 countries. J Adolesc Heal 2019; 64: 657–663. DOI: 10.1016/j.jadohealth.2018.11.007
- Molanorouzi K, Khoo S, Morris T. Motives for adult participation in physical activity: type of activity, age, and gender health behavior, health promotion and society. BMC Public Health 2015; 15: 66. DOI: 10.1186/s12889-015-1429-7
- Zhang TT, Liu Z, Liu YL, Zhao JJ, Liu DW, Tian QB. Obesity as a risk factor for low back pain. Clin Spine Surg 2018; 31: 22–27. DOI: 10.1097/bsd.0000000000000468
- Fernandes IM da C, Pinto RZ, Ferreira P, Lira FS. Low back pain, obesity, and inflammatory markers: exercise as potential treatment. J Exerc Rehabil 2018; 14: 168–174. DOI: 10.12965/jer.1836070.035