ORIGINAL ARTICLE
PATIENT SATISFACTION WITH HOSPITAL-BASED OUTPATIENT REHABILITATION AFTER STROKE IN SWEDEN AND ITS ASSOCIATION WITH LIFE SATISFACTION AND HEALTH-RELATED QUALITY OF LIFE: A LONGITUDINAL NATIONAL REGISTER STUDY
Anna BRÅNDAL, PhD1, Britt-Marie STÅLNACKE, Prof2 and Gudrun M. JOHANSSON, PhD2
From the 1Department of Public Health and Clinical Medicine, Umeå University, Umeå, and 2Department of Community Medicine and Rehabilitation, Rehabilitation Medicine, Umeå University, Umeå, Sweden
Objective: To examine stroke survivors’ satisfaction with hospital-based outpatient rehabilitation and its association with life satisfaction and health-related quality of life (HRQoL), and whether sex and age affect possible associations.
Design: A longitudinal national register study.
Methods: Data from the Swedish national quality register were used and included 1,068 patients with stroke performing outpatient rehabilitation. Self-reported questionnaires collected on admission, discharge, and at 1-year follow-up were analysed. Regression analyses were used to assess possible associations between patient satisfaction and life satisfaction (Life Satisfaction Questionnaire, LiSat-11) and HRQoL (EuroQol Five Dimensions questionnaire, EQ-5D).
Results: Over 71% of the included patients were satisfied with their rehabilitation process on discharge. Satisfied patients also reported higher scores on global LiSat-11 and higher EQ-5D values. Older patients (> 58 years) satisfied with their rehabilitation process were more likely to be satisfied with global LiSat-11. Women dissatisfied with the rehabilitation process had lower EQ-5D values on discharge.
Conclusion: Patient satisfaction with hospital-based outpatient rehabilitation was associated with life satisfaction and HRQoL. Potential differences linked to sex and age support the importance of individually tailored rehabilitation strategies. Evaluating self-reported outcomes and experiences over time is essential for improving long-term recovery and for further development of person-centred stroke rehabilitation.
LAY ABSTRACT
This study investigated satisfaction with rehabilitation, and how this relates to self-reported life satisfaction and health-related quality of life in 1,068 individuals with stroke in Sweden. Using data from a national quality register, we found that most patients were satisfied with their outpatient rehabilitation in hospital settings, both directly after the rehabilitation period and 1 year later. Those who were satisfied with the rehabilitation also reported better life satisfaction and better health-related quality of life. These relationships somewhat differed depending on sex and age, which highlights the importance of individually tailored outpatient rehabilitation after stroke.
Key words: health; personal satisfaction; quality of life; stroke; outpatient rehabilitation.
Citation: J Rehabil Med 2026; 58: jrm43966. DOI: https://doi.org/10.2340/jrm.v58.43966.
Copyright: © 2026 The Author(s). Published by MJS Publishing, on behalf of the Foundation for Rehabilitation Information. This is an Open Access article distributed under the terms of the Creative Commons Attribution 4.0 International License (http://creativecommons.org/licenses/by/4.0/).
Submitted: May 26, 2025; Accepted after revision: Dec 15, 2025; Published: Jan 14, 2026.
Correspondence address: Gudrun Johansson, Department of Community Medicine and Rehabilitation, Umeå University, SE-901 87 Umeå, Sweden. E-mail: gudrun.johansson@umu.se
Competing interests and funding: The authors have no conflicts of interest to declare.
This study was funded by the Swedish Stroke Association, the Northern Swedish Stroke Fund, the Swedish NEURO foundation, and the Region Västerbotten.
Stroke is a common cause of disability in the adult population worldwide (1). Due to better treatment, growing numbers of people survive with stroke-related sequelae and need rehabilitation to function in everyday life (2–4). As stroke is more common in the older population, rehabilitation services are often designed for the elderly (5). Although people of working age represent a smaller proportion of the total stroke population, the number of working-age stroke survivors is expected to increase (6). Because they will live with their stroke-related consequences for a longer time, rehabilitation intervention is of critical importance (7). Previous research has shown that participation in work and social activities is linked to both Life Satisfaction (LS) and Health-Related Quality of Life (HRQoL) in this group (7, 8).
In Sweden, the duration of hospital stays for inpatient rehabilitation in general has declined, with a corresponding shift towards outpatient rehabilitation (9). For patients with stroke, early supported discharge in the subacute post-stroke phase is beneficial in patients treated in modern stroke units (10). Subsequent outpatient rehabilitation post-stroke is increasingly delivered by primary healthcare services and/or municipal care providers. In addition, stroke survivors of working age may be offered hospital-based outpatient rehabilitation to better facilitate ordinary life at home and at work. The National Board of Health and Welfare in Sweden provides guidelines for stroke care (2), which mainly address acute medical care and inpatient rehabilitation. To strengthen the scientific evidence regarding outpatient rehabilitation post-stroke, more research is needed in this area.
Important indicators to measure post-stroke outcome and the effect of rehabilitation include LS and HRQoL (11, 12). LS reflects an individual’s overall appraisal of life (13), whereas HRQoL captures the relationship between health, well-being, and the ability to function in physical, mental, and social domains (14). Patient-reported outcome measures (PROMs) are commonly used to assess aspects such as LS and HRQoL, whereas patient-reported experience measures (PREMs) capture patients’ perceptions of care processes, including satisfaction with rehabilitation (15). Previous studies have shown that many stroke survivors, particularly those of working age, report poor LS (16) and HRQoL (17). Despite some inconsistencies across studies, women tend to have poorer functional recovery and lower self-reported quality of life compared with men (18–21).
Age-related differences in recovery priorities have also been described, where younger individuals emphasize the importance of returning to work and social participation, while older individuals prioritize independence in daily activities (22, 23). Patient satisfaction with stroke rehabilitation has been explored using PREMs (11, 24, 25). However, the relationship between satisfaction with rehabilitation and outcomes such as LS or HRQoL remains insufficiently understood, particularly regarding potential differences depending on age and sex (20, 25–27).
The primary aim of this study was thus to investigate the effects of post-stroke hospital-based outpatient rehabilitation on LS and HRQoL before, immediately after, and at 1-year follow-up using PROMs from a national quality register. A secondary aim was to investigate whether the patients’ satisfaction with rehabilitation, assessed with a PREM, was associated with their LS or HRQoL, and if age and/or sex affected possible associations. We hypothesized that women would rate poorer LS and HRQoL. Additionally, we hypothesized that patients who were most satisfied with rehabilitation would also be satisfied with LS and report better HRQoL.
METHODS
The register study was approved by the Regional Ethics Review board in Uppsala, Sweden (Dnr 2020-02355) and the administrator responsible for the register agreed to extraction of data.
Register
SveReh is a national quality online register of rehabilitation medicine (previously named WebRehab Sweden) to which about 20 rehabilitation units in Sweden report (28). Stroke is one of the many diagnoses that are reported in the register (29). Patients are assessed at 3 time points: (i) on admission to the rehabilitation unit, (ii) on discharge from the rehabilitation unit, and (iii) at 1-year (± 2 months) follow-up from the onset date (if the onset date is missing or more than 9 months have passed between onset and admission, the interval is calculated based on the admission date instead) (28). The register contains patient data such as ICD codes, demographics, process measures, and outcomes measures including patient-reported responses.
Study population
Eligible for this study were patients with stroke registered in SveReh between 2015 and 2020. The patients had been admitted for outpatient rehabilitation at 14 units nationwide. All had participated in multidisciplinary rehabilitation that included person-centred and task-oriented treatment according to national guidelines for stroke. Rehabilitation periods varied depending on the goals set out in their individual rehabilitation plan. Inclusion criteria for the present study were: (i) 18 years of age or older, and (ii) previous stroke (i.e., ischaemic stroke, intracerebral haemorrhage, or subarachnoid haemorrhage). Fig. 1 shows a flowchart of the inclusion procedure.
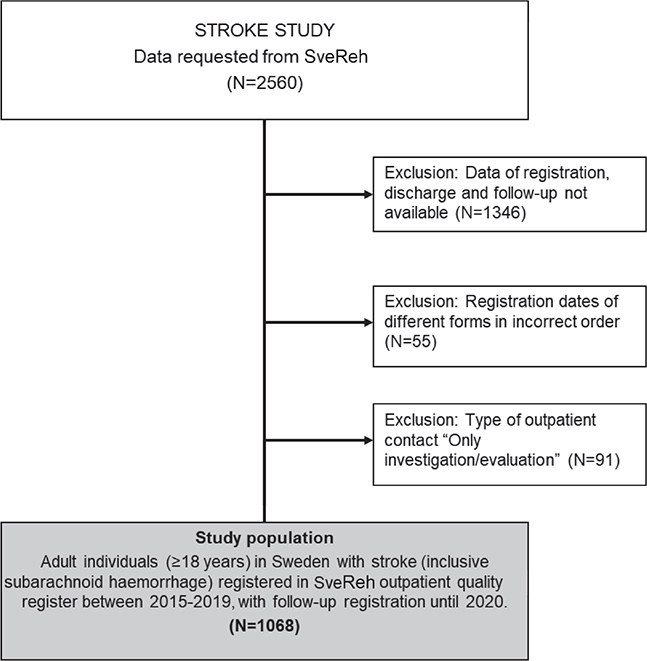
Fig. 1. Flowchart of study population selection.
Measurements
Baseline data included sex, age, stroke subtype, education, marital status, children in household, and vocational situation. Education level was categorized as compulsory school, upper secondary school, and university. In this study, the compulsory school categories “other” and “don’t know” were also added. Furthermore, marital status was categorized as single or living with a partner and vocational situation was defined as productive (> 50% working or studying), benefit (e.g., parental leave, > 50% sick leave) and retired.
The Life Satisfaction Questionnaire (Li-Sat-11) (22) is a patient-reported outcome measure (PROM) that is recommended for assessing LS after stroke (23). LiSat-11 includes 1 global item “Life as a whole” and 10 domain-specific items regarding vocation, economy, leisure, contacts with friends and acquaintances, sexual life, activities of daily living, family life, partner relationship, somatic health, and psychological health. Each item is scored on a Likert scale with 6 response levels: 1 = very dissatisfied, 2 = dissatisfied, 3 = rather dissatisfied, 4 = rather satisfied, 5 = satisfied, and 6 = very satisfied. In this study, only the global item was analysed and the scores for “Life as a whole” were dichotomized to separate those who were satisfied (scores 5–6) from those who were not satisfied (scores 1–4) (22).
The EuroQol five dimensions questionnaire (EQ-5D) (30) is the most used PROM of HRQoL after stroke (31, 32). EQ-5D consists of 5 dimensions: mobility, self-care, usual activities, pain/discomfort, and anxiety/depression. The EQ-5D 3 Level version is included in SveReh. This version contains 3 response levels: no problems, some problems, and extreme problems. The EQ-5D can be presented as a visual analogue scale (EQ VAS) allowing a direct valuation of the current state of health and a single utility value (EQ-5D index), reflecting population preferences. The Swedish tariff of the EQ-5D Index was used (33).
Patient satisfaction was assessed by a PREM that is included in SveReh. The questionnaire contains process-related items regarding the patient’s degree of satisfaction with (i) the attention received from the staff, (ii) the cooperation with the staff, (iii) the rehabilitation process, (iv) the patient’s influence over the rehabilitation process including the individual rehabilitation plan, (v) the information given concerning the stroke, (vi) the information given on where to get more support if needed after discharge, and (vii) the information and attention the family and relatives had received during the patient’s rehabilitation at the clinic. All 7 items are answered on discharge whereas 4 items (3, 4, 5, and 7) are answered at the 1-year follow-up. Each item is scored on a 4-point Likert scale: very dissatisfied, dissatisfied, satisfied, and very satisfied. In this study, the responses “dissatisfied” and “very dissatisfied” were merged into 1 response category due to the low number of responses in the latter. The response categories “satisfied” and “very satisfied” were kept separate.
Statistical analysis
Crude data of the different questionnaires and of their coverage information are presented separately for admission, discharge, and follow-up, separated by sex as shhown in Supplementary material. Proportions of crude data of patient satisfaction variables and their change from discharge to follow-up are displayed in Sankey diagrams.
Descriptive data of the study population are presented in categories described earlier based on the baseline data registered on admission. The included patients who appeared several times in the data file were analysed in the study only for the first registered rehabilitation period. Data on global LS (life as a whole) were presented in proportions, and data on EQ-5D (VAS and index) were presented in mean and SD, separately for admission, discharge, and at 1-year follow-up, by sex.
To investigate the associations between patient satisfaction and global LS and EQ-5D on discharge and follow-up, regression models were used. The odds ratio (OR) for patient satisfaction and association with global LS was calculated with logistic regression models. Coefficients for patient satisfaction and association with EQ-5D were calculated with linear regression. The regression models were performed separately for discharge and follow-up, and both unadjusted and multivariable adjusted. The multivariable adjusted regression models included age on admission (in categories: 18–44, 45–49, 50–54, 55–59, 60–64, 65–69, 70 and above), sex, education level, stroke subgroup, and data of the outcome (categorized global LS variable, EQ-5D Index, and EQ VAS) on admission (for discharge analysis) or on discharge (if missing on discharge; data on admission were used for follow-up analysis). The 95% confidence intervals calculated by robust standard errors and the heteroscedasticity HC3 option were applied for the linear regression analysis.
To investigate possible effect modification by sex and age (below or above median age 57 yearson discharge and 58 years at follow-up) on the associations between patient satisfaction and global LS and EQ-5D, we calculated interaction between sex and age and the outcomes, in similar regression models to those described above, with separate analyses for sex and age. P-values were used to determine statistical significance for the categories included in the patient satisfaction questionnaire within the regression models. These were calculated as the two-sided significance level of the z-value (in logistic regression) and t statistics (in linear regression). All analyses were performed using Stata 17.0 MP (StataCorp LLC, College Station TX, USA).
RESULTS
Characteristics of the 1,068 patients in the study are presented in Table I. The cohort consisted of 61% men (mean age 57 years) and 39% women (mean age 53 years). Most of the patients were aged 45–64 years (67%). Ischaemic stroke was the most common cause of stroke (71%). A higher proportion of women than men had suffered from subarachnoid haemorrhage (17% and 6%, respectively). Most of the patients lived with a partner (69%) and more women than men had children living at home (37% and 27%, respectively). Approximately one-third had a university education, and 16% of the patients were retired. The rehabilitation programme typically involved between 5 and 20 h per week of participation, with an average duration of about 10 weeks.
| Item | Total n = 1,068 |
Women n = 417 |
Men n = 651 |
| Age | |||
| 18–44 years | 176 (16.5 %) | 97 (23.3%) | 79 (12.1%) |
| 45–64 years | 715 (66.9%) | 259 (62.1%) | 456 (70.0%) |
| 65 years or older | 177 (16.6%) | 61 (14.6%) | 116 (17.8%) |
| Stroke sub-groups | |||
| Subarachnoid haemorrhage | 111 (10.4%) | 72 (17.3%) | 39 (6.0%) |
| Ischaemic stroke | 756 (70.8%) | 265 (63.5%) | 491 (75.4%) |
| Intracerebral haemorrhage | 201 (18.8%) | 80 (19.2%) | 121 (18.6%) |
| Marital status | |||
| Single | 327 (30.6%) | 129 (30.9%) | 198 (30.4%) |
| Living with a partner | 741 (69.4%) | 288 (69.1%) | 453 (69.6%) |
| Children at home | |||
| Yes | 334 (31.3%) | 156 (37.4%) | 178 (27.3%) |
| No | 710 (66.5%) | 252 (60.4%) | 458 (70.4%) |
| Missing | 24 (2.2%) | 9 (2.2%) | 15 (2.3%) |
| Education level | |||
| Compulsory school (9 years)* | 249 (23.3%) | 90 (21.6%) | 159 (24.4%) |
| Upper secondary school | 496 (46.4%) | 189 (45.3%) | 307 (47.2%) |
| University | 323 (30.2%) | 138 (33.1%) | 185 (28.4%) |
| Vocational situation | |||
| Productive | 180 (16.9%) | 73 (17.5%) | 107 (16.4%) |
| Benefit | 675 (63.2%) | 275 (65.9%) | 400 (61.4%) |
| Retired | 169 (15.8%) | 58 (13.9%) | 111 (17.1%) |
| Missing | 44 (4.1%) | 11 (2.6%) | 33 (5.1%) |
| Rehabilitation | |||
| Hours/week | |||
| < 5 | 75 (7.0%) | 31 (7.4%) | 44 (6.8%) |
| 5 to 10 | 384 (36.0%) | 150 (36.0%) | 234 (35.9%) |
| 10 to 20 | 417 (39.0%) | 151 (36.2%) | 266 (40.9%) |
| 20 to 30 | 105 (9.8%) | 44 (10.6%) | 61 (9.4%) |
| > 30 | 87 (8.2%) | 41 (9.8%) | 46 (7.1%) |
| Duration in days, mean (SD) | 67.3 (43.9) | 70.6 (45.4) | 65.2 (42.8) |
| *Also includes categories “other” and “don’t know”. | |||
The coverage rate for the various questionnaires administered on admission, discharge, and at 1-year follow-up ranged between 62% and 98%. The capture ratios of the EQ-5D, LiSat-11 and patient satisfaction in the studied population from each time point, separately for sex, are presented in Table SI. Crude values of the separate questionnaires are presented in Tables SII–SIV.
Life satisfaction and health-related quality of life
A higher proportion of women reported lower scores on the global item “Life as a whole” (LS) and lower values on EQ VAS and EQ Index (HRQoL) compared with men across all time points (Table II). Both men and women exhibited higher LS on discharge, an increase that declined at the 1-year follow-up. In contrast, higher scores on HRQoL on discharge remained at the 1-year follow-up for both women and men.
Patient satisfaction
Fig. 2 shows Sankey diagrams of patient satisfaction on discharge and at 1-year follow-up. On discharge, most patients (> 71 %) reported being satisfied or very satisfied. However, the proportion of patients who were very satisfied on discharge declined at the 1-year follow-up due to a change to increased proportions of satisfied individuals and dissatisfied individuals. Additionally, the rate of missing data showed a slight increase at the 1-year follow-up for all except the final one of the 4 items.

Fig. 2. Sankey diagrams visualizing the changes of patient satisfaction from discharge to 1-year follow-up regarding 4 items: (A) rehabilitation process, (B) patient’s influence over the rehabilitation process, (C) information given concerning the stroke, and (D) information and attention the family and relatives had received.
Associations between patient satisfaction and life satisfaction and health-related quality of life on discharge and at 1-year follow-up.
Table III displays the regression models of patient satisfaction and association with LS and HRQoL on discharge and at follow-up. On discharge, patients who were very satisfied with the rehabilitation process were more likely to be satisfied with the global LS and reported higher values on EQ VAS. These associations continued to be significant at the 1-year follow-up. Furthermore, patients dissatisfied with the rehabilitation process reported lower values on EQ VAS, an association that was still significant at the 1-year follow-up and further accompanied by lower values on the EQ-5D Index. On discharge, patients very satisfied with the information provided about the stroke were more likely to be satisfied with the LS and reported better HRQoL. These associations were not significant at the 1-year follow-up except for the EQ VAS. On discharge, being very satisfied with staff cooperation was associated with being satisfied with LS and better HRQoL, while being very satisfied with the attention received from staff was associated with better HRQoL. Notably, satisfaction with one’s own influence over the rehabilitation process and satisfaction with the information and attention given to family and relatives were only associated with the LS and HRQoL at the 1-year follow-up.
| Item | Life as a wholea | EQ-5D Indexb | EQ VASb | ||||||
| Unadjusted | Multivariable adjusted | p-value | Unadjusted | Multivariable adjusted | p-value | Unadjusted | Multivariable adjusted | p-value | |
| OR (95% CI) | OR (95% CI) | Coefficient (95% CI) | Coefficient (95% CI) | Coefficient (95% CI) | Coefficient (95% CI) | ||||
| Discharge | |||||||||
| Rehabilitation process | |||||||||
| Very dissatisfied/dissatisfied | NA | NA | –0.08 (–0.22, 0.06) | –0.09 (–0.30, 0.12) | 0.406 | –17.29 (–35.68, 1.09) | –29.48 (–46.13, –12.83) | 0.001 | |
| Satisfied | 1, ref | 1, ref | 0, ref | 0, ref | 0, ref | 0, ref | |||
| Very satisfied | 2.01 (1.43, 2.84) | 2.09 (1.34, 3.24) | 0.001 | 0.04 (0.02, 0.05) | 0.02 (0.00, 0.03) | 0.011 | 7.81 (5.04, 10.59) | 4.79 (2.42, 7.16) | < 0.001 |
| Patient’s influence over the rehabilitation process | |||||||||
| Very dissatisfied/dissatisfied | 0.98 (0.21, 4.45) | 0.36 (0.01, 10.55) | 0.550 | –0.02 (–0.15, 0.11) | –0.02 (–0.13, 0.09) | 0.733 | –10.30 (–25.19, 4.59) | –13.41 (–27.28, 0.45) | 0.058 |
| Satisfied | 1, ref | 1, ref | 0, ref | 0, ref | 0, ref | 0, ref | |||
| Very satisfied | 1.18 (0.87, 1.62) | 1.24 (0.83, 1.85) | 0.292 | 0.02 (0.00, 0.04) | 0.01 (–0.00, 0.02) | 0.148 | 3.58 (0.95, 6.21) | 2.14 (–0.12, 4.40) | 0.063 |
| Information given concerning the stroke | |||||||||
| Very dissatisfied/dissatisfied | 0.99 (0.41, 2.38) | 0.77 (0.23, 2.56) | 0.668 | 0.01 (–0.05, 0.06) | 0.02 (–0.02, 0.06) | 0.331 | –2.08 (–11.25, 7.09) | –3.10 (–11.34, 5.14) | 0.459 |
| Satisfied | 1, ref | 1, ref | 0, ref | 0, ref | 0, ref | 0, ref | |||
| Very satisfied | 1.41 (1.03, 1.92) | 1.74 (1.17, 2.59) | 0.006 | 0.04 (0.02, 0.06) | 0.02 (0.01, 0.04) | 0.001 | 5.75 (3.18, 8.33) | 4.21 (1.97, 6.45) | < 0.001 |
| Information and attention the family and relatives had received | |||||||||
| Very dissatisfied/dissatisfied | 0.78 (0.22, 2.74) | 1.79 (0.40, 8.15) | 0.449 | –0.07 (–0.127, 0.002) | –0.05 (–0.09, –0.00 | 0.034 | –2.68 (–14.18, 8.82) | –0.66 (–10.91, 9.59) | 0.899 |
| Satisfied | 1, ref | 1, ref | 0, ref | 0, ref | 0, ref | 0, ref | |||
| Very satisfied | 1.34 (0.95, 1.89) | 1.31 (0.83, 2.06) | 0.247 | 0.02 (–0.00, 0.04) | 0.01 (–0.00, 0.03) | 0.160 | 3.30 (0.44, 6.16) | 1.86 (–0.65, 4.36) | 0.147 |
| Attention received from the staff | |||||||||
| Very dissatisfied/dissatisfied | NA | NA | 0.20 (–0.03, 0.42) | 0.05 (–0.12, 0.22) | 0.591 | 31.53 (–31.46, 94.51) | 11.37 (–5.14, 27.8) | 0.177 | |
| Satisfied | 1, ref | 1, ref | 0, ref | 0, ref | 0, ref | 0, ref | |||
| Very satisfied | 1.98 (1.15, 3.38) | 1.63 (0.77, 3.44) | 0.202 | 0.06 (0.03, 0.08) | 0.03 (0.01, 0.05) | 0.007 | 6.74 (1.94, 11.53) | 4.42 (0.62, 8.2) | 0.023 |
| Cooperation with the staff | |||||||||
| Very dissatisfied/dissatisfied | NA | NA | –0.14 (–0.28, –0.01) | –0.11 (–0.24, 0.02) | 0.107 | –34.84 (–62.82, –6.86) | –30.73 (–56.99, –4.46) | 0.022 | |
| Satisfied | 1, ref | 1, ref | 0, ref | 0, ref | 0, ref | 0, ref | |||
| Very satisfied | 2.48 (1.54, 4.01) | 3.28 (1.64, 6.56) | 0.001 | 0.05 (0.02, 0.08) | 0.03 (0.01, 0.05) | 0.002 | 5.76 (2.05, 9.47) | 5.06 (1.80 8.32) | 0.002 |
| Information given on where to get more support after discharge | |||||||||
| Very dissatisfied/dissatisfied | 1.00 (0.43, 2.33) | 0.75 (0.27, 2.10) | 0.585 | –0.02 (–0.07, 0.03) | –0.00 (–0.05, 0.04) | 0.879 | –5.04 (–12.36, 2.28) | –3.61 (–10.76 3.53) | 0.321 |
| Satisfied | 1, ref | 1, ref | 0, ref | 0, ref | 0, ref | 0, ref | |||
| Very satisfied | 1.57 (1.14, 2.16) | 1.58 (1.05, 2.37) | 0.028 | 0.02 (0.00, 0.03) | 0.01 (–0.01, 0.02) | 0.249 | 3.67 (1.04, 6.31) | 2.09 (–0.21, 4.39) | 0.075 |
| Follow-up | |||||||||
| Rehabilitation process | |||||||||
| Very dissatisfied/dissatisfied | 0.21 (0.06, 0.70) | 0.57 (0.15, 2.18) | 0.409 | –0.11 (–0.15, –0.07) | –0.09 (–0.13, –0.04) | 0.001 | –13.84 (–19.83, –7.84) | –8.95 (–14.93, –2.98) | 0.003 |
| Satisfied | 1, ref | 1, ref | 0, ref | 0, ref | 0, ref | 0, ref | |||
| Very satisfied | 1.75 (1.29, 2.38) | 1.54 (1.07, 2.22) | 0.020 | 0.03 (0.02, 0.05) | 0.02 (0.00, 0.03) | 0.033 | 6.46 (3.94, 8.97) | 5.03 (2.72, 7.35) | < 0.001 |
| Patient’s influence over the rehabilitation process | |||||||||
| Very dissatisfied/dissatisfied | 0.42 (0.18, 0.99) | 0.90 (0.34, 2.40) | 0.833 | –0.10 (–0.14, –0.07) | –0.06 (–0.10, –0.02) | 0.003 | –14.42 (–20.59, –8.26) | –9.24 (–15.41, –3.08) | 0.003 |
| Satisfied | 1, ref | 1, ref | 0, ref | 0, ref | 0, ref | 0, ref | |||
| Very satisfied | 1.76 (1.30, 2.40) | 1.64 (1.13, 2.36) | 0.009 | 0.03 (0.02, 0.05) | 0.02 (0.01, 0.03) | 0.006 | 6.03 (3.58, 8.47) | 4.00 (1.78, 6.22) | < 0.001 |
| Information given concerning the stroke | |||||||||
| Very dissatisfied/dissatisfied | 0.27 (0.12, 0.58) | 0.35 (0.14, 0.87 | 0.024 | –0.07 (–0.10, –0.03) | –0.04 (–0.07, –0.01) | 0.021 | –7.29 (–12.77, –1.81) | –4.14 (–9.26, 0.98) | 0.113 |
| Satisfied | 1, ref | 1, ref | 0, ref | 0, ref | 0, ref | 0, ref | |||
| Very satisfied | 1.40 (1.03, 1.90) | 1.30 (0.90, 1.86) | 0.164 | 0.02 (0.00, 0.03) | 0.01 (–0.00, 0.02) | 0.193 | 5.20 (2.67, 7.73) | 3.13 (0.85, 5.40) | 0.007 |
| Information and attention the family and relatives had received | |||||||||
| Very dissatisfied/dissatisfied | 0.68 (0.34, 1.36) | 0.69 (0.28, 1.66) | 0.403 | –0.04 (–0.08, –0.00) | 0.00 (–0.04, 0.04) | 0.997 | –5.49 (–11.69, 0.70) | –1.22 (–6.87, 4.44) | 0.673 |
| Satisfied | 1, ref | 1, ref | 0, ref | 0, ref | 0, ref | 0, ref | |||
| Very satisfied | 1.89 (1.38, 2.60) | 1.67 (1.14, 2.44 | 0.008 | 0.04 (0.02, 0.05) | 0.02 (0.01, 0.03) | 0.007 | 6.48 (3.86, 9.10) | 4.24 (1.90, 6.58) | < 0.001 |
| aOR calculated by logistic regression, dichotomization Satisfied (scores 5–6) vs Not satisfied (scores 1–4). bCoefficients calculated by linear regression. NA: not applicable, OR: odds ratio, CI: confidence interval, ref: reference. Items shown in bold denote statistically significant results with p-value less than 0.05. |
|||||||||
Effect modification by sex and age on the associations between patient satisfaction and life satisfaction and health-related quality of life on discharge and at 1-year follow-up
Table IV displays the impact of sex on patient satisfaction in the regression models. On discharge, men satisfied with the rehabilitation (3 of 7 items) were more likely to be satisfied with LS and reported better HRQoL. These associations between patient satisfaction and LS declined at the 1-year follow-up. Women dissatisfied with the rehabilitation process and dissatisfied with the cooperation with staff were associated with poorer HRQoL on discharge. At the 1-year follow-up, the associations between patient satisfaction and HRQoL were more equally present between the sexes.
| Item | Life as a wholea | EQ-5D Indexb | EQ VASb | |||
| Multivariable adjusted, OR (95% CI) | Multivariable adjusted, Coefficient (95% CI) | Multivariable adjusted, Coefficient (95% CI) | ||||
| Men | Women | Men | Women | Men | Women | |
| Discharge | ||||||
| Rehabilitation process | ||||||
| Very dissatisfied/dissatisfied | NA | NA | NS | –0.19 (–0.21, –0.17) p < 0.001 | NS | –43.11 (–46.46, –39.75) p < 0.000 |
| Satisfied | 1, ref | NS | 0, ref | NS | 0, ref | NS |
| Very satisfied | 2.21 (1.28, 3.83) p = 0.005 |
NS | 0.02 (0.00, 0.04) p = 0.023 |
NS | 3.90 (0.97, 6.83) p = 0.009 |
NS |
| Patient’s influence over the rehabilitation process | ||||||
| Very dissatisfied/dissatisfied | NS | NA | NS | NS | NS | NS |
| Satisfied | 1, ref | NS | 0, ref | NS | 0, ref | NS |
| Very satisfied | NS | NS | 0.02 (0.00, 0.03) p = 0.035 |
NS | 3.25 (0.49, 6.00) p = 0.021 |
NS |
| Information given concerning the stroke | ||||||
| Very dissatisfied/dissatisfied | NS | NS | 0.04 (0.00, 0.08) p = 0.033 |
NS | NS | NS |
| Satisfied | 1, ref | NS | 0, ref | NS | 0, ref | NS |
| Very satisfied | 1.95 (1.18, 3.23) p = 0.009 |
NS | 0.03 (0.01, 0.04) p = 0.004 |
NS | 3.10 (0.31, 5.88) p = 0.030 |
NS |
| Information and attention the family and relatives had received | ||||||
| Very dissatisfied/dissatisfied | NS | NS | NS | NS | NS | Ns |
| Satisfied | 1, ref | NS | 0, ref | NS | 0, ref | NS |
| Very satisfied | NS | NS | 0.02 (0.00, 0.04) p = 0.014 |
NS | NS | NS |
| Attention received from the staff | ||||||
| Very dissatisfied/dissatisfied | NA | NA | NS | NA | 11.23 (5.8, 16.65) p = 0.001 |
NA |
| Satisfied | 1, ref | NS | 0, ref | NS | 0, ref | NS |
| Very satisfied | NS | NS | NS | NS | 4.26 (0.23, 8.30) p = 0.039 |
NS |
| Cooperation with the staff | ||||||
| Very dissatisfied/dissatisfied | NA | NA | NA | NS | NA | –33.04 (–56.33, –6.76) p = 0.014 |
| Satisfied | 1, ref | NS | 0, ref | NS | 0, ref | NS |
| Very satisfied | 3.05 (1.43, 6.48) p = 0.004 |
2.56 (1.16, 5.66) p = 0.02 |
0.03 (0.00, 0.05) p = 0.020 |
NS | 4.55 (0.96, 8.15) p = 0.013 |
NS |
| Information given on where to get more support after discharge | ||||||
| Very dissatisfied/dissatisfied | NS | NS | NS | NS | NS | NS |
| Satisfied | 1, ref | NS | 0, ref | NS | 0, ref | NS |
| Very satisfied | 1.68 (1.00, 2.81) p = 0.0497 |
NS | NS | NS | NS | NS |
| Follow-up | ||||||
| Rehabilitation process | ||||||
| Very dissatisfied/dissatisfied | NS | NS | –0.09 (–0.14, –0.04) p = 0.009 | –0.10 (–0.18, –0.02) p = 0.020 | –10.06 (–18.67, –1.44) p = 0.022 | –9.29 (–14.75, –3.84) p < 0.001 |
| Satisfied | 1, ref | NS | 0, ref | NS | 0, ref | NS |
| Very satisfied | NS | NS | NS | NS | 3.71 (0.66, 6.76) p = 0.017 |
4.74 (1.51, 7.97) p = 0.004 |
| Satisfied | 1, ref | NS | 0, ref | –0.03 (–0.05, 0.00) p = 0.024 | 0, ref | NS |
| Very satisfied | NS | 1.76 (1.08, 2.87) p = 0.024 |
NS | NS | NS | 3.84 (0.83, 6.85) p = 0.012 |
| Information given concerning the stroke | ||||||
| Very dissatisfied/dissatisfied | NS | 0.09 (0.01, 0.74) p = 0.025 |
NS | NS | NS | –9.65 (–17.32, –1.99) p = 0.014 |
| Satisfied | 1, ref | NS | 0, ref | NS | 0, ref | NS |
| Very satisfied | NS | NS | NS | NS | NS | 3.84 (0.83, 6.86) p = 0.013 |
| Information and attention the family and relatives had received | ||||||
| Very dissatisfied/dissatisfied | NS | NS | NS | NS | NS | NS |
| Satisfied | 1, ref | 0.40 (0.21, 0.74) p = 0.004 |
0, ref | NS | 0, ref | NS |
| Very satisfied | NS | NS | 0.02 (0.00, 0.04) p = 0.047 | NS | 3.48 (0.46, 6.50) p = 0.024 | 4.28 (1.03, 7.54) p = 0.010 |
| aOR calculated by logistic regression, dichotomisation Satisfied (scores 5–6) vs Not satisfied (scores 1–4). bCoefficients calculated by linear regression. NA: not applicable, OR: odds ratio, CI: confidence interval, ref: reference. Items shown in bold denote statistically significant results with p-value less than 0.05. |
||||||
Table V presents the impact of age on patient satisfaction in the regression models. Younger patients who were dissatisfied with the rehabilitation process reported poorer EQ Index, while older patients who were dissatisfied with the rehabilitation process reported lower values on EQ VAS. Furthermore, younger patients satisfied with various aspects of rehabilitation reported better HRQoL, while older patients who were satisfied with many aspects of the rehabilitation reported both better LS and HRQoL.
| Item | Life as a wholea | EQ-5D Indexb | EQ VASb | |||
| Multivariable adjusted, OR (95% CI) | Multivariable adjusted, Coefficient (95% CI) | Multivariable adjusted, Coefficient (95% CI) | ||||
| Below median age | Above median age | Below median age | Above median age | Below median age | Above median age | |
| Discharge | ||||||
| Rehabilitation process | ||||||
| Very dissatisfied/dissatisfied | NA | NA | –0.18 (–0.20, –0.16) p < 0.001 | NS | –29.99 (–54.36, –5.61) p = 0.016 | –27.09 (–30.92, –23.26) p < 0.001 |
| Satisfied | 1, ref | NS | 0, ref | NS | 0, ref | NS |
| Very satisfied | 1.84 (1.03, 3.29) p = 0.039 |
2.61 (1.41, 4.83) p = 0.002 |
0.02 (0.00, 0.04) p = 0.015 |
0.03 (0.01, 0.05) p = 0.009 |
5.44 (2.31, 8.57) p < 0.001 |
4.45 (1.03, 7.87) p = 0.011 |
| Patient’s influence over the rehabilitation process | ||||||
| Very dissatisfied/dissatisfied | NS | NA | NS | NS | NS | NS |
| Satisfied | 1, ref | NS | 0, ref | NS | 0, ref | NS |
| Very satisfied | NS | NS | NS | NS | NS | NS |
| Information given concerning the stroke | ||||||
| Very dissatisfied/dissatisfied | NS | NS | NS | NS | NS | NS |
| Satisfied | 1, ref | NS | 0, ref | NS | 0, ref | NS |
| Very satisfied | 1.76 (1.04, 2.97) p = 0.038 |
2.33 (1.28, 4.27) p = 0.006 |
0.03 (0.01, 0.05) p = 0.002 |
0.03 (0.01, 0.05) p = 0.004 |
3.90 (0.99, 6.82) p = 0.001 |
3.74 (0.59, 6.88) p = 0.020 |
| Information and attention the family and relatives had received | ||||||
| Very dissatisfied/dissatisfied | NS | NS | –0.05 (–0.10, –0.01) p = 0.030 | 0.03 (0.00, 0.06) p = 0.049 | NS | Ns |
| Satisfied | 1, ref | NS | 0, ref | NS | 0, ref | NS |
| Very satisfied | NS | NS | NS | NS | NS | NS |
| Attention received from the staff | ||||||
| Very dissatisfied/dissatisfied | NA | NA | NS | 0.08 (0.04, 0.11) p < 0.001 |
NA | NS |
| Satisfied | 1, ref | NS | 0, ref | 0.06 (0.01, 0.10) p = 0.015 |
0, ref | NS |
| Very satisfied | NS | NS | 0.05 (0.02. 0.09) p = 0.001 |
0.06 (0.02, 0.09) p = 0.015 |
5.29 (0.01, 10.57) p = 0.049 | NS |
| Cooperation with the staff | ||||||
| Very dissatisfied/dissatisfied | NA | NA | NS | NA | –28.92 (–55.67, –2.17) p = 0.034 | NA |
| Satisfied | 1, ref | NS | 0, ref | 0.05** (0.02, 0.09) | 0, ref | NS |
| Very satisfied | 3.82 (1.42, 10.29) p = 0.008 | 4.64 (1.71, 12.60) p = 0.003 | 0.06 (0.03, 0.08) p < 0.001 |
0.06 (0.03, 0.08) p < 0.001 |
7.19 (02.81, 11.58) p = 0.001 | 5.72 (1.25, 10.19) p = 0.012 |
| Information given on where to get more support after discharge | ||||||
| Very dissatisfied/dissatisfied | NS | NS | NS | NS | NS | NS |
| Satisfied | 1, ref | NS | 0, ref | NS | 0, ref | NS |
| Very satisfied | NS | 2.33 (1.23, 4.39) p = 0.009 | NS | NS | NS | NS |
| Analysis for follow-up | ||||||
| Rehabilitation process | ||||||
| Very dissatisfied/dissatisfied | NS | NS | –0.09 (–0.15, –0.03) p = 0.002 | –0.07 (–0.14, –0.01) p = 0.028 | NS | –8.86 (–15.61, –2.11) p = 0.010 |
| Satisfied | 1, ref | NS | 0, ref | NS | 0, ref | NS |
| Very satisfied | NS | 2.27 (1.35, 3.80) p = 0.002 |
0.02 (0.00, 0.04) p = 0.030 |
NS | 6.57 (3.33, 9.81) p < 0.001 |
6.76 (3.33, 10.19) p < 0.001 |
| Patient’s influence over the rehabilitation process | ||||||
| Very dissatisfied/dissatisfied | NS | NA | NS | –0.07 (–0.13, –0.01) p = 0.015 | NS | –7.83 (–14.56, –1.11) p = 0.022 |
| Satisfied | 1, ref | NS | 0, ref | 0, ref | 0, ref | NS |
| Very satisfied | 1.87 (1.14, 3.06) p = 0.014 |
2.23 (1.33, 3.73) p = 0.002 |
0.02 (0.00, 0.04) p 0.027 |
NS | 5.56 (2.62, 8.50) p < 0.001 |
4.85 (1.67, 8.03) p = 0.003 |
| Information given concerning the stroke | ||||||
| Very dissatisfied/dissatisfied | NS | NS | NS | NS | NS | NS |
| Satisfied | 1, ref | NS | 0, ref | NS | 0, ref | NS |
| Very satisfied | NS | 1.78 (1.08, 2.92) p = 0.023 |
NS | NS | 3.69 (0.58, 6.80) p = 0.020 |
3.52 (0.47, 6.58) p = 0.024 |
| Information and attention the family and relatives had received | ||||||
| Very dissatisfied/dissatisfied | NS | NS | NS | NS | NS | NS |
| Satisfied | 1, ref | 1.92 (1.11, 3.32) p = 0.020 | 0, ref | NS | 0, ref | NS |
| Very satisfied | 2.16 (1.30, 3.59) p = 0.003 |
2.35 (1.38, 4.01) p = 0.002 |
0.02 (0.00, 0.04) p = 0.017 |
0.02 (0.00, 004) p = 0.044 |
5.79 (2.56, 9.01) p < 0.001 |
5.37 (2.02, 8.73) p = 0.002 |
| aOR calculated by logistic regression, dichotomization Satisfied (scores 5–6) vs Not satisfied (scores 1–4). bCoefficients calculated by linear regression. NA: not applicable, OR: odds ratio, CI: confidence interval, ref: reference. Items shown in bold denote statistically significant results with p-value less than 0.05. |
||||||
DISCUSSION
This study investigated the experiences and effects of hospital-based outpatient rehabilitation among 1,068 stroke survivors, using a PREM to assess patient satisfaction and PROMs to evaluate LS and HRQoL. Most participants were satisfied with several aspects of outpatient rehabilitation on discharge and at the 1-year follow-up. Stroke survivors with higher LS scores and higher HRQoL values tended to report greater satisfaction with their outpatient rehabilitation.
Previous studies have shown that higher functional levels (24) and returning to work (34) were linked to greater satisfaction with rehabilitation. In line with this, our results indicated that greater satisfaction with the rehabilitation process was related to better LS and HRQoL both on discharge and at the follow-up. Dissatisfaction, on the other hand, appeared to be linked with poorer HRQoL at both time points, which might reflect the importance of ongoing support to help maintain health-related functioning. Higher values of HRQoL observed on discharge seemed to be sustained at follow-up, which may indicate that discharge could represent an important point in the rehabilitation trajectory, although this needs to be further explored.
The patients’ influence over the rehabilitation process was associated with LS and HRQoL at the 1-year follow-up but not on discharge. Earlier research has suggested that patients’ participation and involvement in care are decisive factors for satisfaction, sometimes outweighing disease-specific factors after stroke (35). Satisfaction with care has also been identified as a key indicator of quality of life (36). Moreover, dissatisfaction with healthcare 1-year post-stroke has been associated with low coping skills, impaired function, and limited participation (37). In our cohort, patients who were very satisfied with the information provided concerning stroke on discharge also tended to report better LS and HRQoL, which may indicate the value of patient-centred care (38) and provision of repeated information (39, 40). In contrast, satisfaction with the information and attention given to the family and relatives was not associated with the patients’ self-reported LS and HRQoL on discharge.
The sex differences observed in our study were somewhat inconsistent and therefore difficult to interpret. However, women were somewhat more dissatisfied with the rehabilitation process both on discharge and at the 1-year follow-up compared with men. This finding is in line with earlier research showing that women post-stroke generally report poorer HRQoL than men (19). Women also tend to be older at stroke onset and more severely affected by the stroke (19, 41–44). In our predominantly working-age sample, these explanations may be less relevant. One alternative explanation for our sample could be related to family and caregiving responsibilities, but this remains speculative because we did not include data on family roles or caregiving burden. Recent qualitative work has further highlighted that younger women may face unique challenges in resuming social and family roles after stroke, which could negatively influence their satisfaction with rehabilitation (25).
Age appeared to play some role in the associations observed. In our data, the relationship between patient satisfaction and LS was somewhat stronger in older patients, whereas the association with HRQoL seemed more evident among younger patients. This may indicate that different age groups value different aspects of their rehabilitation, although the data do not permit firm conclusions on this matter. A previous study has reported low LS among younger stroke survivors (45). Although age-related differences in LS and HRQoL have been described, findings remain inconsistent across studies (35). Additionally, Ullberg et al. identified a higher prevalence of stroke-related health problems among younger patients, many of whom experience invisible impairments that affect everyday life (46). Such factors may partly explain why the younger stroke survivors in our study reported lower HRQoL despite associations between satisfaction and HRQoL outcomes in this group.
Methodological considerations
This study focused on individuals who received hospital-based outpatient rehabilitation, excluding those who received inpatient care. This may have introduced selection bias and reduced the generalizability of the results, especially for older adults or those with more severe impairments. While adherence to national stroke guidelines was assumed, differences in rehabilitation volume (i.e., hours per week) and duration (i.e., total days/weeks) as well as access to multidisciplinary teams likely occurred. The study did not consider specific rehabilitation content or differences between units, which could have influenced outcomes. Furthermore, the lack of socioeconomic and disability-related data limits the ability to explain variations in satisfaction and HRQoL. Decreasing response rates over time may have led to recall bias and missing data, affecting internal validity. Despite a smaller sample size, long-term follow-up was prioritized. Nevertheless, the study’s national scope, with data from rehabilitation units across Sweden, enhances generalizability. The use of a large, consecutively registered sample and valid PROMs and PREM collected at defined timepoints provide valuable longitudinal insights into patient experiences and outcomes.
In conclusion, the findings suggest that while stroke survivors generally report satisfaction with hospital-based outpatient rehabilitation, certain outcomes may change over time, with variations across age and sex. The sustained improvements in HRQoL observed from discharge to follow-up suggest discharge as an important time point for supporting patients and consolidating rehabilitation gains. This finding underscores the clinical importance of structured discharge planning, goal-setting, and continued follow-up. The observed variations depending on sex and age highlight the potential value of tailoring rehabilitation strategies to meet the needs of specific subgroups of patients. Overall, the study illustrates the value of national register data incorporating patient-reported outcomes and experiences, contributing to development of more person-centred and individualized outpatient stroke rehabilitation.
ACKNOWLEDGEMENTS
The authors would like to thank Christel Häggström for statistical support and Andrew Strong for proofreading the manuscript.
Ethical clearance: The study was approved by the Regional Ethics Review board in Uppsala, Sweden (Dnr 2020-02355).
REFERENCES
- Global, regional, and national burden of stroke and its risk factors, 1990–2019: a systematic analysis for the Global Burden of Disease Study 2019. Lancet Neurol 2021; 20: 795–820. https://doi.org/10.1016/S1474-4422(21)00252-0
- National Board of Health and Welfare. National Guidelines for Stroke Care: support for governance and management [cited 2020]. Available from: https://www.socialstyrelsen.se/globalassets/sharepoint-dokument/artikelkatalog/nationella-riktlinjer/2020-1-6545.pdf
- Winstein CJ, Stein J, Arena R, Bates B, Cherney LR, Cramer SC, et al. Guidelines for adult stroke rehabilitation and recovery: a guideline for healthcare professionals from the American Heart Association/American Stroke Association. Stroke 2016; 47: e98–e169. https://doi.org/10.1161/STR.0000000000000098
- National Board of Health and Welfare. Statistics on stroke 2023. [cited 2024; Available from: https://www.socialstyrelsen.se/statistik-och-data/statistik/alla-statistikamnen/stroke/
- Shipley J, Luker J, Thijs V, Bernhardt J. How can stroke care be improved for younger service users? A qualitative study on the unmet needs of younger adults in inpatient and outpatient stroke care in Australia. Disabil Rehabil 2020; 42: 1697–1704. https://doi.org/10.1080/09638288.2018.1534278
- Boissonneault M, Mulders JO, Turek K, Carriere Y. A systematic review of causes of recent increases in ages of labor market exit in OECD countries. PLoS One 2020; 15: e0231897. https://doi.org/10.1371/journal.pone.0231897
- Martinsen R, Kirkevold M, Sveen U. Young and midlife stroke survivors’ experiences with the health services and long-term follow-up needs. J Neurosci Nurs 2015; 47: 27–35. https://doi.org/10.1097/JNN.0000000000000107
- Harris GM, Prvu Bettger J. Parenting after stroke: a systematic review. Top Stroke Rehabil 2018; 25: 384–392. https://doi.org/10.1080/10749357.2018.1452366
- Ludvigsson JF, Bergman D, Lundgren CI, Sundquist K, Geijerstam J-La, Glenngård AH, et al. The healthcare system in Sweden. Eur J Epidemiol 2025: 1–17. https://doi.org/10.1007/s10654-025-01226-9
- Bråndal A, Eriksson M, Glader EL, Wester P. Effect of early supported discharge after stroke on patient reported outcome based on the Swedish Riksstroke registry. BMC Neurol 2019; 19: 40. https://doi.org/10.1186/s12883-019-1268-8
- Norrving B, Barrick J, Davalos A, Dichgans M, Cordonnier C, Guekht A, et al. Action Plan for Stroke in Europe 2018–2030. Eur Stroke J 2018; 3: 309–336. https://doi.org/10.1177/2396987318808719
- Hamza AM, Al-Sadat N, Loh SY, Jahan NK. Predictors of poststroke health-related quality of life in Nigerian stroke survivors: a 1-year follow-up study. Biomed Res Int 2014; 2014: 350281. https://doi.org/10.1155/2014/350281
- OECD Better Life Index [cited]. Available from: https://www.oecdbetterlifeindex.org/topics/life-satisfaction/
- Taylor RM, Gibson F, Franck LS. A concept analysis of health-related quality of life in young people with chronic illness. J Clin Nurs 2008; 17: 1823–1833. https://doi.org/10.1111/j.1365-2702.2008.02379.x
- Kingsley C, Patel S. Patient-reported outcome measures and patient-reported experience measures. BJA Educ 2017; 17: 137–144. https://doi.org/10.1093/bjaed/mkw060
- Abualait TS, Alzahrani MA, Ibrahim AI, Bashir S, Abuoliat ZA. Determinants of life satisfaction among stroke survivors 1 year post stroke. Medicine (Baltimore) 2021; 100: e25550. https://doi.org/10.1097/MD.0000000000025550
- Palmcrantz S, Widén Holmqvist L, Sommerfeld DK. Young individuals with stroke: a cross sectional study of long-term disability associated with self-rated global health. BMC Neurol 2014; 14: 20. https://doi.org/10.1186/1471-2377-14-20
- Yoon CW, Bushnell CD. Stroke in women: a review focused on epidemiology, risk factors, and outcomes. J Stroke 2023; 25: 2–15. https://doi.org/10.5853/jos.2022.03468
- Phan HT, Blizzard CL, Reeves MJ, Thrift AG, Cadilhac DA, Sturm J, et al. Sex differences in long-term quality of life among survivors after stroke in the INSTRUCT. Stroke 2019; 50: 2299–2306. https://doi.org/10.1161/STROKEAHA.118.024437
- Phan HT, Gall SL, Blizzard CL, Lannin NA, Thrift AG, Anderson CS, et al. Sex differences in quality of life after stroke were explained by patient factors, not clinical care: evidence from the Australian Stroke Clinical Registry. Eur J Neurol 2021; 28: 469–478. https://doi.org/10.1111/ene.14531
- Laurent K, De Sèze M-P, Delleci C, Koleck M, Dehail P, Orgogozo J-M, et al. Assessment of quality of life in stroke patients with hemiplegia. Ann Phys Rehabil Med 2011; 54: 376–390. https://doi.org/10.1016/j.rehab.2011.06.002
- Fugl-Meyer AR, Melin R, Fugl-Meyer KS. Life satisfaction in 18- to 64-year-old Swedes: in relation to gender, age, partner and immigrant status. J Rehabil Med 2002; 34: 239–246. https://doi.org/10.1080/165019702760279242
- Ekstrand E, Lexell J, Brogårdh C. Test–retest reliability of the Life Satisfaction Questionnaire (LiSat-11) and association between items in individuals with chronic stroke. J Rehabil Med 2018; 50: 713–718. https://doi.org/10.2340/16501977-2362
- Hansson EE, Beckman A, Wihlborg A, Persson S, Troein M. Satisfaction with rehabilitation in relation to self-perceived quality of life and function among patients with stroke: a 12 month follow-up. Scand J Caring Sci 2013; 27: 373–379. https://doi.org/10.1111/j.1471-6712.2012.01041.x
- Tarihoran DE, Honey M, Slark J. Younger women’s experiences of stroke: a qualitative study. Nurs Prax Aotearoa NZ 2023; 39. https://doi.org/10.36951/001c.73355
- Gurková E, Štureková L, Mandysová P, Šaňák D. Factors affecting the quality of life after ischemic stroke in young adults: a scoping review. Health Qual Life Outcomes 2023; 21: 4. https://doi.org/10.1186/s12955-023-02090-5
- Segerdahl M, Hansson P-O, Samuelsson CM, Persson CU. Health-related quality of life in stroke survivors: a 5-year follow-up of the Fall Study of Gothenburg (FallsGOT). BMC Geriatr 2023; 23: 584. https://doi.org/10.1186/s12877-023-04308-z
- Svenskt Register för Rehabiliteringsmedicin [cited]. Available from: https://svereh.registercentrum.se
- Sunnerhagen KS, Flansbjer UB, Lannsjö M, Tölli A, Lundgren-Nilsson A. WebRehab: a Swedish database for quality control in rehabilitation. J Rehabil Med 2014; 46: 958–962. https://doi.org/10.2340/16501977-1886
- Rabin R, de Charro F. EQ-5D: a measure of health status from the EuroQol Group. Ann Med 2001; 33: 337–343. https://doi.org/10.3109/07853890109002087
- Joundi RA, Adekanye J, Leung AA, Ronksley P, Smith EE, Rebchuk AD, et al. Health state utility values in people with stroke: a systematic review and meta-analysis. J Am Heart Assoc 2022; 11: e024296. https://doi.org/10.1161/JAHA.121.024296
- Zhou J, Wei Q, Hu H, Liu W, Guan X, Ma A, et al. A systematic review and meta-analysis of health utility values among patients with ischemic stroke. Front Neurol 2023; 14: 1219679. https://doi.org/10.3389/fneur.2023.1219679
- Burström K, Sun S, Gerdtham UG, Henriksson M, Johannesson M, Levin L, et al. Swedish experience-based value sets for EQ-5D health states. Qual Life Res 2014; 23: 431–442. https://doi.org/10.1007/s11136-013-0496-4
- Matérne M, Strandberg T, Lundqvist LO. Change in quality of life in relation to returning to work after acquired brain injury: a population-based register study. Brain Inj 2018; 32: 1731–1739. https://doi.org/10.1080/02699052.2018.1517224
- Ytterberg C, Kristensen HK, Tistad M, von Koch L. Factors related to met needs for rehabilitation 6 years after stroke. Plos One 2020; 15: e0227867. https://doi.org/10.1371/journal.pone.0227867
- Cramm JM, Strating MM, Nieboer AP. Satisfaction with care as a quality-of-life predictor for stroke patients and their caregivers. Qual Life Res 2012; 21: 1719–1725. https://doi.org/10.1007/s11136-011-0107-1
- Tistad M, Tham K, von Koch L, Ytterberg C. Unfulfilled rehabilitation needs and dissatisfaction with care 12 months after a stroke: an explorative observational study. BMC Neurol 2012; 12: 40. https://doi.org/10.1186/1471-2377-12-40
- Håkansson Eklund J, Holmström IK, Kumlin T, Kaminsky E, Skoglund K, Höglander J, et al. “Same same or different?” A review of reviews of person-centered and patient-centered care. Patient Educ Couns 2019; 102: 3–11. https://doi.org/10.1016/j.pec.2018.08.029
- Forster A, Brown L, Smith J, House A, Knapp P, Wright JJ, et al. Information provision for stroke patients and their caregivers. Cochrane Database Syst Rev 2012; 11: Cd001919. https://doi.org/10.1002/14651858.CD001919.pub3
- Davoody N, Koch S, Krakau I, Hägglund M. Post-discharge stroke patients’ information needs as input to proposing patient-centred eHealth services. BMC Med Inform Decis Mak 2016; 16: 66. https://doi.org/10.1186/s12911-016-0307-2
- Gargano JW, Reeves MJ. Sex differences in stroke recovery and stroke-specific quality of life: results from a statewide stroke registry. Stroke 2007; 38: 2541–2548. https://doi.org/10.1161/STROKEAHA.107.485482
- Gall SL, Donnan G, Dewey HM, Macdonell R, Sturm J, Gilligan A, et al. Sex differences in presentation, severity, and management of stroke in a population-based study. Neurology 2010; 74: 975–981. https://doi.org/10.1212/WNL.0b013e3181d5a48f
- Gall SL, Tran PL, Martin K, Blizzard L, Srikanth V. Sex differences in long-term outcomes after stroke: functional outcomes, handicap, and quality of life. Stroke 2012; 43: 1982–1987. https://doi.org/10.1161/STROKEAHA.111.632547
- Silva Y, Sánchez-Cirera L, Terceño M, Dorado L, Valls A, Martínez M, et al. Sex and gender differences in acute stroke care: metrics, access to treatment and outcome. A territorial analysis of the Stroke Code System of Catalonia. Eur Stroke J 2023; 8: 557–565. https://doi.org/10.1177/23969873231156260
- Röding J, Glader E-L, Malm J, Lindström B. Life satisfaction in younger individuals after stroke: different predisposing factors among men and women. J Rehabil Med 2010; 42: 155–161. https://doi.org/10.2340/16501977-0497
- Ullberg T, Månsson K, Berhin I, Pessah-Rasmussen H. Comprehensive and structured 3-month stroke follow-up using the post-stroke checklist (The Struct-FU study): a feasibility and explorative study. J Stroke Cerebrovasc Dis 2021; 30: 105482. https://doi.org/10.1016/j.jstrokecerebrovasdis.2020.105482