ORIGINAL REPORT
RELATIONSHIP BETWEEN HEART RATE AND PERCEIVED EXERTION IN NEUROMUSCULAR DISEASES: HOW DO LABORATORY-BASED EXERCISE TESTING RESULTS TRANSLATE TO HOME-BASED AEROBIC TRAINING SESSIONS?
Eric L. VOORN, PhD1,2, Sander OORSCHOT, MSc1,2, Tim VENEMAN, MSc1,2, Bart RAIJMAKERS, MSc1,2 and Frans NOLLET, MD, PhD1,2
From the 1Amsterdam UMC location University of Amsterdam, Department of Rehabilitation Medicine, and 2Amsterdam Movement Sciences, Rehabilitation & Development, Amsterdam, The Netherlands
Objective: To examine the heart rate-perceived exertion relationship between maximal exercise testing and home-based aerobic training in neuromuscular diseases.
Design: Multicentre randomized controlled trial, intervention group data.
Participants: Individuals with Charcot-Marie-Tooth disease (n = 17), post-polio syndrome (n = 7) or other neuromuscular diseases (n = 6).
Methods: Participants followed a 4-month, home-based aerobic training programme guided by heart rate. Heart rate and ratings of perceived exertion (6–20 Borg Scale) were assessed for each minute during a maximal exercise test, and at the end of each exercise interval and recovery period during training. Heart rate and corresponding ratings of perceived exertion values of individual participants during training were visualized using plots, together with the exercise testing linear regression line between heart rate and ratings of perceived exertion.
Results: High correlation coefficients (i.e. > 0.70) were found between heart rate and ratings of perceived exertion, in all participants during testing (n = 30), and in 57% of the participants during training. Based on the plots the following distribution was found; participants reporting lower (n = 12), similar (n = 10), or higher (n = 8) ratings of perceived exertion values for corresponding heart rates during training compared with testing.
Conclusion:
Most participants had a different perception of effort for corresponding heart rates during training in comparison with exercise testing. Healthcare professionals should be aware that this may imply under- and over-training.
LAY ABSTRACT
Aerobic training, also called endurance training, is usually guided by target heart rate ranges based on exercise testing results. It is not known how the perception of effort for the same heart rate during a training programme relates to the perceived effort during exercise testing in people with neuromuscular diseases. This is important information for healthcare professionals. For instance, if patients report a higher perceived effort during training, this may explain their difficulties reaching target heart rate ranges. Maximal exercise testing and training data from 30 individuals with neuromuscular diseases were analysed. Most participants reported lower (10 participants) or higher (8 participants) perceived effort values for similar heart rates during training compared with exercise testing. Healthcare professionals in neuromuscular rehabilitation should be aware that this may indicate too low loads in some individuals and too high loads in others. This requires evaluation in further research.
Key words: rehabilitation; exercise; physical exertion; physiological monitoring; exercise test; neuromuscular disease; anaerobic threshold; heart rate; physical therapist.
Citation: J Rehabil Med 2023; 55: jrm00387. DOI: https://doi.org/10.2340/jrm.v55.4523
Copyright: © Published by Medical Journals Sweden, on behalf of the Foundation for Rehabilitation Information. This is an Open Access article distributed under the terms of the Creative Commons Attribution-NonCommercial 4.0 International License (https://creativecommons.org/licenses/by-nc/4.0/)
Accepted: Feb 23, 2023; Published: Apr 28, 2023
Correspondence address: Eric Voorn, Department of Rehabilitation Medicine, Amsterdam UMC, Location AMC, Meibergdreef 9, NL-1105 AZ, Amsterdam, The Netherlands. E-mail: e.l.voorn@amsterdamumc.nl
Competing interests and funding: The authors have no conflicts of interest to declare.
In individuals with neuromuscular diseases (NMD), symptoms such as muscle weakness, fatigue and pain, may lead to physical inactivity (1, 2). Physical inactivity causes deconditioning, further restricting physical functioning and societal participation. Therefore, improving physical fitness through aerobic training is an important component of neuromuscular rehabilitation (3).
Aerobic training intensity is usually prescribed based on exercise testing results, using relative intensities, such as a percentage of the heart rate reserve, or threshold concepts, such as the anaerobic threshold (4). In NMD, ratings of perceived exertion (RPE) are often used in conjunction with target heart rate ranges to regulate training intensity, but also to monitor the training programme (5). It is currently not known how the patient’s perception of effort for the same heart rate (HR) during a training programme relates to the perceived effort during exercise testing in NMD. Practitioners may need to consider potential differences in perceived effort when they prescribe and monitor training based on exercise testing results. For instance, if patients report higher RPE values during training, this may explain their difficulties attaining target heart rate zones, possibly requiring adjusted exercise intensity prescription.
Previous research in NMD has demonstrated that there appears to be a linear relationship between HR and RPE during exercise testing. A study in patients with poliomyelitis, a slowly progressive NMD, found that HR correlated strongly with RPE during an arm-crank exercise test, and that this relationship was similar to able-bodied individuals (6, 7). Whether such a strong relationship is also applicable to other NMD and other exercise modes, such as bicycle ergometry, is unknown. In addition, information about the HR-RPE relationship during a training programme in NMD is also lacking. The perception of effort for corresponding HRs may vary between testing and training, because of differences in exercise protocols and the setting (8–11). Maximal exercise testing usually consists of progressive, continuous exercise of a limited duration (i.e. 8–12 min) in a laboratory setting, while aerobic training sessions are usually performed in the home environment, mostly involving (intermittent) exercise at fixed intensity levels and varying in duration. Results from previous work in cardiac patients are conflicting, with some studies showing similar RPE values at given HRs during exercise testing and training (10, 11), while others found lower (9) or higher RPE values during training (8). It is not known how people with NMD, for whom the exercise capacity is often symptom-limited due to decreased muscle mass of the lower or upper extremities, perceive corresponding HRs during training in comparison with maximal exercise testing (12, 13).
The aim of the current study was therefore to examine the HR-RPE relationship between testing and training in NMD. More specifically, this study compared NMD patients’ perceptions of effort for corresponding HRs between laboratory-based standardized maximal exercise testing and training sessions from the first 2 weeks of a home-based aerobic training programme.
METHODS
Study design
The study used data collected as part of an ongoing randomized controlled trial, called I’M FINE, on the efficacy of a physical activity programme combining individualized aerobic training and coaching to improve physical fitness in NMD (https://trialsearch.who.int/Trial2.aspx?TrialID = NTR7609) (14). Participants were randomized to a physical activity programme or usual care. The current study used data from participants allocated to the physical activity programme. The Medical Ethics Committee of Amsterdam UMC, location Academic Medical Center (AMC), approved the study protocol (NL62104.018.17), and written informed consent was obtained from all participants.
Participants
Participants were recruited from Dutch hospitals and rehabilitation centres throughout the country. Inclusion criteria were: diagnosis of prior poliomyelitis or post-polio syndrome (PPS), Charcot-Marie-Tooth disease (CMT), or other NMD (e.g. congenital myopathies or inclusion body myositis); motivated to improve reduced physical fitness; and aged ≥ 18 years. Exclusion criteria were: contraindications for physical activity according to the American College of Sports Medicine (ACSM) guidelines; unable to follow verbal or written Dutch instructions; engagement in a training programme for a period longer than 4 weeks during the past 6 months. A more detailed description can be found in the published study protocol (14).
PROCEDURES
Data on demographic characteristics (age, sex, weight) and patient characteristics (diagnosis, muscle strength by manual muscle testing according to the Medical Research Council scale, self-reported present walking function, walking aids) were collected as part of the randomized controlled trial’s baseline assessment. In addition, all participants performed a maximal exercise test to assess the primary outcome, i.e. peak oxygen uptake. After baseline assessment participants were randomized to the physical activity programme or usual care. If it took more than 3 months to initiate the programme, the baseline assessment was repeated, and data from the second exercise test was used for further analysis.
Maximal exercise testing
Participants performed a progressive continuous maximal exercise test according to ACSM’s guidelines (15), on a bicycle ergometer (Lode BV, Zernikepark 16, 9747 AN Groningen, the Netherlands) with recording of gas exchange variables, 12-lead electrocardiogram and blood pressure using MasterScreen CPX (CareFusion, Hoechberg, Germany). Before testing, participants received instructions on how to use the 6–20 Borg Scale (16). After a 3-min rest period, the test started with 3 min of unloaded cycling, after which the workload was ramp-incremented by 5–20 Watts per min, depending on the participants’ physical fitness level. Criteria for stopping the test were: oxygen uptake reaching a plateau; pedal frequency dropping below 50 revolutions per min; exhaustion; or reaching 1 of ACSM’s stopping criteria (15). The protocol was completed with 3 min of unloaded cycling. At the end of each minute and at exercise test termination, participants rated their perceived exertion on the 6–20 Borg Scale. Gas exchange variables, HR, and RPE data were stored on a computer for offline analyses.
Aerobic training programme
Aerobic training was guided by HR and consisted of a 4-month polarized, home-based programme, with 2 low-intensity sessions and 1 high-intensity session per week (see www.amc.nl/trainingguide and previous publications for more details, including the rationale) (14, 17). Training sessions included exercise intervals, interspersed with recovery periods. Target HR ranges for low- and high-intensity exercise intervals and recovery were based on the anaerobic threshold (Fig. 1, Appendix S1). The anaerobic threshold was determined from the maximal exercise testing results, using the V-slope method (18). The current study focussed on how laboratory-based maximal exercise testing results translate to home-based training sessions. Therefore, data from the first 2 weeks, i.e. 6 sessions, of the training programme were used (Fig. 1).
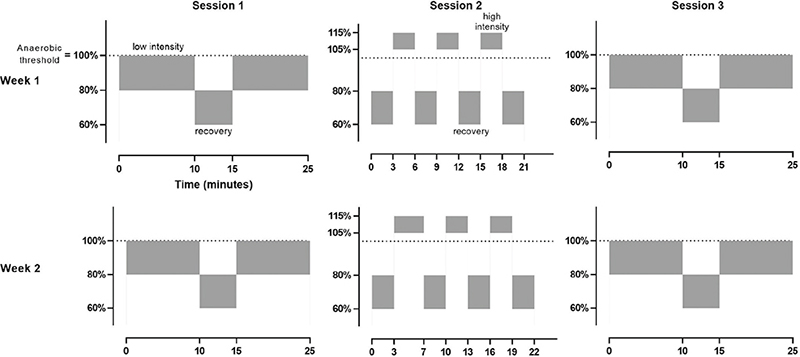
Fig. 1. Schematic overview of the first 2 weeks of the training programme, including 2 low-intensity sessions and 1 high-intensity session per week. Training sessions included 2 or 3 exercise intervals, interspersed with recovery periods, for low- and high-intensity sessions, respectively. Target heart rate ranges for low- and high-intensity exercise intervals and recovery, were based on the anaerobic threshold. Heart rate and ratings of perceived exertion on the 6–20 Borg scale were assessed at the end of each exercise interval and recovery period.
Training sessions were performed at home, in the local gym, or physical therapy practice, on a stationary ergometer, and the training programme was coordinated and supervised by trained physical therapists experienced in neuromuscular rehabilitation. Participants were supplied with the ReVi app (Amsterdam UMC, location AMC, the Netherlands) and a chest-strap HR monitor (Polar H10, Polar Electro, Kempele, Finland), that could be connected to each other. ReVi is a research application that was specifically designed for the aerobic training programme and was programmed with the participant’s individual target HR ranges. HR was continuously registered and ReVi provided real-time auditory and visual feedback to support participants to maintain their actual HR within their target HR ranges. At the end of each exercise interval, and after recovery, ReVi requested participants to score their perceived exertion on the 6–20 Borg Scale. HR and RPE data were stored in an online dashboard and downloaded for offline analyses.
Data analysis
Descriptive data were expressed as mean and standard deviation (SD) in case of normally distributed data or as median and range if data were not normally distributed. Patients’ characteristics and exercise testing parameters of individual participants are included in Appendix S2. Power output, HR, oxygen uptake, respiratory exchange ratio, and the RPE from the highest achieved workload during the maximal exercise test were determined.
Heart rate-ratings of perceived exertion relationship during maximal exercise testing
RPE values were assessed during the final 15 s of each minute during maximal exercise testing. To determine the HR corresponding to RPE values, the mean HR during the same 15-s interval was calculated. Spearman’s rank correlation coefficients were used to establish the strength of the HR-RPE relationship during maximal exercise testing at an individual level. Correlation coefficients (r) smaller than 0.50 were considered as low to moderate, 0.50–0.70 as moderate, and greater than 0.70 as high to very high (19). In addition, the linear regression line for each participant was plotted separately. This was used to compare the perception of effort between training and maximal exercise testing.
Heart rate-ratings of perceived relationship during training
RPE values during training sessions were assessed during the final minute of each exercise interval and recovery period. To determine the HR corresponding to RPE values, the mean HR over the last minute of each exercise interval and recovery period were calculated. Based on the first 6 training sessions of the programme, including 14 exercise intervals (8 low-intensity; 6 high-intensity) and 12 recovery periods this resulted in a maximum of 26 RPE and corresponding HR values for each participant (Fig. 1). Accordingly, the current study used Spearman’s rank correlation coefficients to determine the strength of the HR-RPE relationship during training at an individual level.
In addition, for each of the 6 training sessions, the course of the mean HR and RPE of all participants were displayed.
Comparing the perception of effort between training and maximal exercise testing
To compare the perception of effort for corresponding HRs between testing and training at an individual level, the RPE and corresponding HR values during training sessions were visualized using plots, together with the maximal exercise testing regression line. Based on visual judgment of the distribution of the training data in reference to the exercise testing regression line, 2 independent raters (EV and SO) allocated each participant to 1 of 3 groups; participants reporting lower (1), similar (2), or higher (3) RPE values for corresponding HRs during training compared with exercise testing. Disagreement between raters was discussed and resolved in a consensus meeting, and if consensus was not reached, a third rater was consulted (TV). Descriptive statistics of key demographic and patient characteristics and exercise testing and training characteristics of all 3 subgroups were provided.
Data analysis was performed using SPSS (version 26.0, SPSS Inc., Chicago, IL, USA).
RESULTS
Between October 2018 and April 2022, 91 participants were randomized, of whom 44 were allocated to the intervention group. Fourteen participants were excluded for the following reasons: the aerobic training programme was not initiated because of work-life imbalance or family reasons (n = 4); training was based on the Borg Scale, and HR data were not collected as part of the training programme (n = 7); missing HR data due to technical issues with the ReVi app (n = 3).
The 30 participants included in this study (14 male; median age 65 years, range 27–77 years) were diagnosed with CMT (n = 17), PPS (n = 7), or other NMD (n = 6). Muscle weakness in the lower extremities was observed based on manual muscle testing in all participants, and 23 participants (77%) used walking aids (Table I). One participant used beta-blocking agents and another participant had diabetes mellitus type 2, both of which may impact on the heart rate response.
| Demographic characteristics | |
| Sex (male/female), n | 14/16 |
| Age, years, median (range) | 65 (27–77) |
| Weight, kg, mean (SD) | 75.4 (12.3) |
| Disease characteristics | |
| Diagnosis (CMT/PPS/other neuromuscular disease), n | 17/7/6 |
| Present walking function (self-reported), n Indoors only Around the house Seldom ≥ 1 km Regularly ≥ 1 km |
0 2 10 18 |
| Walking aids (yes/no), n | 23/7 |
| MMT sum score lower extremities (0–80)*, median (range) | 72.3 (49.5–79.0) |
| *Defined as the sum of scores from 8 lower extremity muscle groups on both sides. Each muscle group had a score between 0 and 5, so that the sum score ranged from 0 to 80. | |
| SD: standard deviation; CMT: Charcot-Marie-Tooth disease; PPS: post-polio syndrome; MMT: manual muscle testing. | |
Heart rate-ratings of perceived relationship during maximal exercise testing
All participants successfully completed the maximal exercise test on the bicycle ergometer at baseline (Table II). The mean heart rate (SD) at the highest achieved workload during the maximal exercise test was 153.4 (19.0) beats per min (bpm), ranging from 115 to 184 bpm. The median RPE at the highest achieved workload was 18, ranging from 15 to 20. The correlation coefficient between HR and RPE values during maximal exercise testing was higher than 0.70 in all participants. Individual patient characteristics and exercise testing parameters are shown in Appendix S2.
Heart rate-ratings of perceived relationship during training sessions
HR and RPE data of 1 training session were missing in 6 participants. In 1 and 4 other participants, HR and RPE data of respectively 2 and 3 training sessions were missing. Data were missing due to technical issues related to the ReVi app. The correlation coefficient between HR and RPE values during training was higher than 0.70 in 17 participants (57%), between 0.50 and 0.70 in 9 participants (30%) and below 0.50 in 4 participants (13%).
Fig. 2 displays the course of the mean HR and RPE of all participants during each of the 6 training sessions.
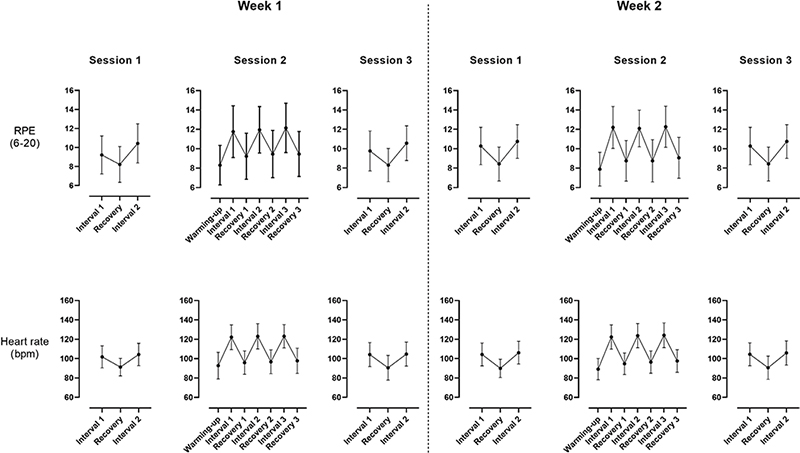
Fig. 2. The course of the mean heart rate and ratings of perceived exertion on the 6–20 Borg Scale of all participants during the 6 sessions, illustrating that perceived exertion overall showed the same pattern as heart rate. bpm: beats per minute; RPE: rating of perceived exertion.
Heart rate-ratings of perceived relationship during training in relation to exercise testing
Fig. 3 shows that the group allocation was as follows; participants reporting lower (n = 12), similar (n = 10), or higher (n = 8) RPE values for corresponding HRs during training compared with exercise testing. There was 100% agreement between the 2 independent raters regarding group allocation. Table III provides descriptive statistics of demographic and patient characteristics and exercise testing and training characteristics of all 3 subgroups.
| Characteristics | RPE training < test (n = 12) | RPE training ≈ test (n = 10) | RPE training > test (n = 8) |
| Demographic data | |||
| Age, years, median (range) | 53 (27–66) | 65 (28–77) | 67 (46–73) |
| Weight, kg, mean (SD) | 67.0 (11.1) | 79.4 (10.0) | 82.9 (9.8) |
| Patient characteristics | |||
| Diagnosis (CMT/PPS/other neuromuscular disease), n | 8/2/2 | 6/2/2 | 3/3/2 |
| MMT sum score lower extremities (0–80)*, median (range) | 74.5 (60.0–79.0) | 69.3 (49.5–78.5) | 68.5 (61.0–76.0) |
| Exercise parameters at the highest achieved workload | |||
| Workload (W), mean (SD) | 140.2 (46.5) | 123.1 (37.6) | 134.0 (40.5) |
| Heart rate (bpm), mean (SD) | 157.3 (17.6) | 151.1 (23.0) | 150.5 (16.8) |
| Rating of perceived exertion (6–20), median (range) | 18 (15–20) | 19 (15–20) | 17 (15–19) |
| Oxygen uptake (mL/min/kg), mean (SD) | 25.5 (5.8) | 20.7 (6.3) | 20.8 (6.4) |
| Training characteristics | |||
| Percentage of time in target intensity zones (%), mean (SD) | 81.4 (7.1) | 82.2 (13.5) | 85.7 (6.0) |
| *Defined as the sum of scores from 8 lower extremity muscle groups on both sides. Each muscle group had a score between 0 and 5, so that the sum score ranged from 0 to 80. | |||
| SD: standard deviation; bpm: beats per minute; CMT: Charcot-Marie-Tooth disease; PPS: post-polio syndrome; MMT: manual muscle testing; RPE: rating of perceived exertion; W: Watts. | |||
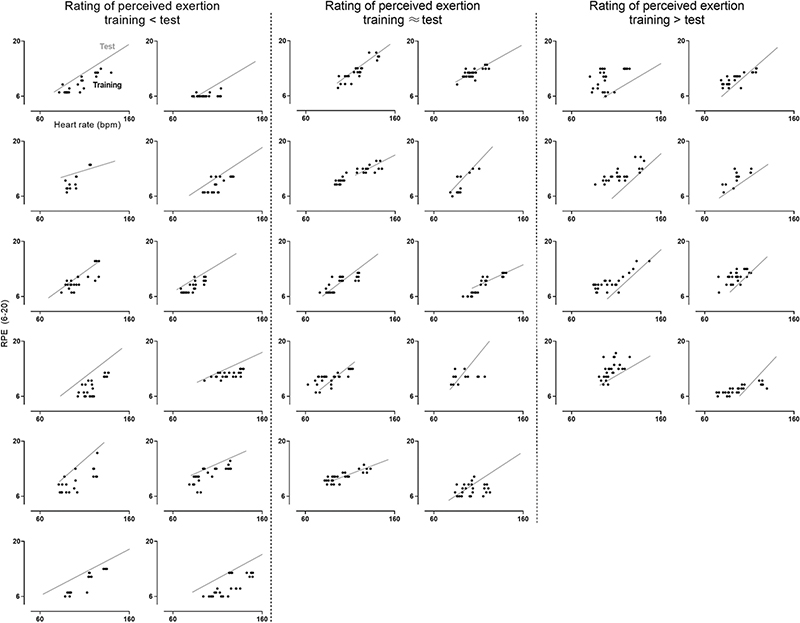
Fig. 3. Distribution of participants reporting lower (n = 12), similar (n = 10), or higher (n = 8) rating of perceived exertion values on the 6–20 Borg Scale for corresponding heart rates during training compared with exercise testing. The grey line is the regression line of the heart rate-perceived exertion relationship during maximal exercise testing. The black dots represent ratings of perceived exertion and corresponding heart rate values that were assessed at the end of each exercise interval and recovery period during training. bpm: beats per minute; RPE: rating of perceived exertion.
DISCUSSION
This study provides insight into NMD patients’ perception of effort for corresponding HRs during laboratory-based maximal exercise testing and the initial sessions of a home-based aerobic training programme. In most individuals with NMD there was a strong HR-RPE relationship, both during maximal exercise testing and training. However, when comparing the perception of effort for corresponding HRs between testing and training, most people with NMD reported lower or higher RPE values.
There appeared to be a very strong relationship between the HR and RPE during laboratory-based maximal exercise testing in NMD; we found correlation coefficients that were considered as high to very high in all participants. These results are in line with an earlier study in NMD demonstrating a high explained variance (i.e. a mean R2 of 0.93) during an arm-crank exercise test in individuals with poliomyelitis (6). Research in healthy individuals also showed that, especially during progressive continuous exercise testing, RPE correlated very closely with increments in physiological markers, such as HR (7, 20). Like healthy individuals, persons with NMD thus seem very capable of perceptually rating their level of exertion in relation to HR during a laboratory-based maximal graded exercise test.
During home-based aerobic training, the relationship between HR and RPE appeared to be somewhat weaker than during maximal exercise testing. In 57% of participants, this study found high to very high correlation coefficients (i.e. > 0.70) between HR and RPE, while low to moderate correlations (i.e. < 0.50) were found in 13% of the participants. We are not aware of any previous research on this topic in NMD, but similar correlation coefficients have been reported in healthy people during comparable forms of interval-based exercise (21, 22). An important explanation for the lower correlation coefficients found during training may be the limited variation in HR, together with RPE, compared with maximal exercise testing. In the current study, peak HR and RPE, respectively, ranged from 116 to 184, and from 15 to 20 during maximal exercise testing, while peak values during training sessions were clearly lower in most participants (Figs 2 and 3). This implies that, during training, only part of the full HR-RPE relationship could be examined. In addition, correlation coefficients differ between exercise protocols. In general, correlation coefficients are lower for intermittent exercise, such as the current interval-based training programme, than for progressive continuous protocols, such as the current maximal exercise test (20). Nevertheless, it was found that, during the interval-based training sessions, perceived exertion overall showed the same pattern as HR (Fig. 2). Therefore, it seems that other factors, such as the intra-individual day-to-day variability in RPE and HR, and the setting (laboratory vs home) may also play a role in the weaker HR-RPE relationship, as found during training, in comparison with exercise testing. Taken together, these results indicate that, as during maximal exercise testing, people with NMD are able to rate their level of exertion in relation to HR during home-based interval training.
When comparing the HR-RPE relationship between laboratory-based maximal exercise testing and home-based training, participants did not consistently report lower, similar, or higher RPE values for corresponding HRs in the current study sample. In fact, a more or less even distribution of subjects was found over these different ratings. The group reporting lower RPE values during training may be younger, less affected and have a higher fitness level in comparison with the other 2 groups, but the subgroups were too small for statistical comparison, and this warrants further research. Contrary to the methodology of the current study, previous studies in cardiac patients have presented their results only at group level. Given the individual variance in the current study among people with NMD, this may explain the conflicting results that were reported in cardiac patients, with some studies showing lower, or higher RPE values at given HRs during training in comparison with exercise testing, while others found similar RPE values (8–11). Therefore, the current results emphasize the need for an individualized approach when comparing the perception of effort for corresponding HRs between testing and training in NMD, which probably also holds for other clinical populations.
Study limitations
This study has a relatively small sample size, consisting mainly of mildly affected people with CMT. Although there were also some more affected individuals with PPS and other NMD included, this limits generalizability. In addition, all participants were tested on a bicycle ergometer. Extending this work to other exercise modes, such as arm ergometry or wheelchair propulsion, would be of interest for training prescription in NMD.
Clinical implications
Lower or higher RPE values were found in most people with NMD for corresponding HRs during training in comparison with exercise testing. Therefore, healthcare professionals should take both HR and RPE into account when monitoring home-based training guided by HR, as using only HR or RPE provides limited information. The lower or higher RPE values during training may imply too low loads in some individuals and too high loads in others, with potential risks of under- and over-training, but future research to evaluate this is warranted.
CONCLUSION
This study examined the HR-RPE relationship between testing and training in NMD. The results indicate that people with NMD appear to be capable of perceptually rating their level of exertion in relation to HR, both during exercise testing and during training. However, when comparing corresponding intensities between testing and training, in terms of HR, most people had a different perception of effort. Healthcare professionals should take both HR and RPE into account when monitoring home-based aerobic training guided by HR.
ACKNOWLEDGEMENTS
This work was supported by the Prinses Beatrix Spierfonds (grant number W.OK17–3).
REFERENCES
- McDonald CM. Physical activity, health impairments, and disability in neuromuscular disease. Am J Phys Med Rehabil 2002; 81: S108–S120.
- Phillips M, Flemming N, Tsintzas K. An exploratory study of physical activity and perceived barriers to exercise in ambulant people with neuromuscular disease compared with unaffected controls. Clin Rehabil 2009; 23: 746–755.
- Abresch RT, Carter GT, Han JJ, McDonald CM. Exercise in neuromuscular diseases. Phys Med Rehabil Clin 2012; 23: 653–673.
- Medicine ACoS. ACSM’s clinical exercise physiology. Lippincott Williams & Wilkins; Philadelphia, United States of America, 2019.
- Voorn EL, Koopman F, Nollet F, Brehm MA. Aerobic exercise in adult neuromuscular rehabilitation: a survey of healthcare professionals. J Rehabil Med 2019; 51: 518–524.
- Al-Rahamneh HQ, Faulkner JA, Byrne C, Eston RG. Relationship between perceived exertion and physiologic markers during arm exercise with able-bodied participants and participants with poliomyelitis. Arch Phys Med Rehabil 2010; 91: 273–277.
- Scherr J, Wolfarth B, Christle JW, Pressler A, Wagenpfeil S, Halle M. Associations between Borg’s rating of perceived exertion and physiological measures of exercise intensity. Eur J Appl Physiol 2013; 113: 147–155.
- Brubaker PH, jack Rejeski W, Law HC, Pollock WE, Wurst ME, Miller Jr HS. Cardiac patients’ perception of work intensity during graded exercise testing: do they generalize to field settings? J Cardiopulm Rehabil Prev 1994; 14: 127–133.
- Buckley JP, Sim J, Eston RG. Reproducibility of ratings of perceived exertion soon after myocardial infarction: responses in the stress-testing clinic and the rehabilitation gymnasium. Ergonomics 2009; 52: 421–427.
- Birk T, Jeffery K, Birk C, Theurer L, Johnson G. Relationship of perceived exertion and heart rate during exercise testing and training in cardiac patients. Med Sci Sports Exerc 1985; 17:199.
- Gutmann M, Squires R, Pollock M, Foster C, Anholm J. Perceived exertion-heart rate relationship during exercise testing and training in cardiac patients. J Card Rehabil 1981; 1: 52–59.
- Carroll JE, Hagberg JM, Brooke MH, Shumate JB. Bicycle ergometry and gas exchange measurements in neuromuscular diseases. Arch Neur 1979; 36: 457–461.
- Willén CR, Cider ÅR, Stibrant Sunnerhagen KM. Physical performance in individuals with late effects of polio. Scand J Rehab Med 1999; 31: 244–249.
- Oorschot S, Brehm MA, van Groenestijn AC, Koopman FS, Verhamme C, Eftimov F, et al. Efficacy of a physical activity programme combining individualized aerobic exercise and coaching to improve physical fitness in neuromuscular diseases (I’M FINE): study protocol of a randomized controlled trial. BMC Neur 2020; 20: 1–10.
- Medicine ACoS. ACSM’s guidelines for exercise testing and prescription. Lippincott Williams & Wilkins; Philadelphia, United States of America, 2013.
- Borg G. Perceived exertion as an indicator of somatic stress. Scand J Rehabil Med 1970; 2: 92–98.
- Voorn EL, Koopman FS, Nollet F, Brehm M-A. Individualized aerobic exercise in neuromuscular diseases: a pilot study on the feasibility and preliminary effectiveness to improve physical fitness. Phys Ther 2021; 101: pzaa213.
- Wasserman K, Hansen JE, Sue DY, Whipp BJ, Froelicher VF. Principles of exercise testing and interpretation. J Cardiopulm Rehabil Prev 1987; 7:189.
- Asuero AG, Sayago A, Gonzalez A. The correlation coefficient: an overview. Crit Rev Anal Chem 2006; 36: 41–59.
- Chen MJ, Fan X, Moe ST. Criterion-related validity of the Borg ratings of perceived exertion scale in healthy individuals: a meta-analysis. J Sports Sci 2002; 20: 873–899.
- Green JM, McLester JR, Crews TR, Wickwire PJ, Pritchett RC, Lomax RG. RPE association with lactate and heart rate during high-intensity interval cycling. Med Sci Sports Exerc 2006; 38: 167–172.
- Arney BE, Glover R, Fusco A, Cortis C, de Koning JJ, van Erp T, et al. Comparison of rating of perceived exertion scales during incremental and interval exercise. Kinesiology 2019; 51: 150–157.