ORIGINAL ARTICLE
PSYCHOMETRIC PROPERTIES OF UPPER-BODY DRESSING SCALE IN PEOPLE WITH STROKE
Shamay S. M. NG, PhD1,2, Peiming CHEN, PhD1,2, Him-Shun CHANG, BSc1, Wing-Kiu CHUN, BSc1, Tsz-Ho KONG, BSc1, Yunon LAM, BSc1, Wing-Yan LAU, BSc1, Tai-Wa LIU, PhD3, Lily Y. W. HO, DHSc1,4, Cynthia Y. Y. LAI, PhD1 and Mimi M. Y. TSE, PhD3
From the 1Department of Rehabilitation Sciences, 2Research Centre for Chinese Medicine Innovation, The Hong Kong Polytechnic University, Hung Hom, 3School of Nursing and Health Studies, Hong Kong Metropolitan University, Ho Man Tin and 4School of Nursing, The Hong Kong Polytechnic University, Hung Hom, Hong Kong SAR, China
Objectives: To investigate the psychometric properties of the Upper-Body Dressing Scale (UBDS), a tool for evaluating upper-body dressing performance in stroke patients.
Design: Cross-sectional study.
Subjects: Seventy-six chronic stroke patients and 49 healthy older adults.
Methods: UBDS, Fugl-Meyer Assessment (FMA), Wolf Motor Function Test (WMFT), Berg Balance Scale (BBS), Timed Up-and-Go Test (TUGT), Limit of Stability (LOS) test, Motor Activity Log (MAL-30), Arm Activity Measure (AAM), 12-item Short Form Health Survey, and Community Integration Measure – Cantonese version were assessed
Results: UBDS time and UBDS score demonstrated good to excellent inter-rater and test-retest reliabilities for chronic stroke patients (intraclass correlation coefficient 0.759–1.000). UBDS time correlated significantly with FMA Upper and Lower Extremity, WMFT, and BBS scores, TUGT time, LOS Movement Velocity (affected side), LOS Maximal Excursion (composite), MAL-30 Amount of Use and Quality of Movement (affected side), and AAM (section B) scores (r = –0.61 to 0.63). The minimal detectable changes in UBDS time and UBDS score were 28.67 s and 0, respectively. The cut-off UBDS time and UBDS score were 37.67 s and 7.50, respectively.
Conclusion: UBDS time is a reliable, sensitive, and specific measurement for assessing upper-body dressing performance in chronic stroke patients.
LAY ABSTRACT
The skill of upper body dressing is an important component of activities of daily living in people with stroke. However, there are many limitations in current outcome measures to assess upper-body dressing performance. The Upper-Body Dressing Scale was developed to evaluate upper-body dressing performance. The objectives of this study were to investigate the inter-rater, test–retest reliabilities, and minimal detectable changes (MDCs) of Upper-Body Dressing Scale time and Upper-Body Dressing Scale score for chronic stroke patients, the correlations of Upper-Body Dressing Scale time and Upper-Body Dressing Scale score with stroke-specific outcome measures, and the cut-off Upper-Body Dressing Scale time and Upper-Body Dressing Scale score for distinguishing upper-body dressing performance of stroke survivors from that of healthy older adults. The Upper-Body Dressing Scale time and Upper-Body Dressing Scale score demonstrated good to excellent inter-rater and test–retest reliabilities for chronic stroke patients. Upper-Body Dressing Scale time correlated significantly with stroke-specific outcome measures. Thus, Upper-Body Dressing Scale time is a reliable, sensitive, and specific measurement for assessing upper-body dressing performance in chronic stroke patients.
Key words: Upper limb; Stroke; Activities of Daily Living.
Citation: J Rehabil Med 2023; 55: jrm00391. DOI: https://dx.doi.org/10.2340/jrm.v55.5766.
Copyright: © Published by Medical Journals Sweden, on behalf of the Foundation for Rehabilitation Information. This is an Open Access article distributed under the terms of the Creative Commons Attribution-NonCommercial 4.0 International License (https://creativecommons.org/licenses/by-nc/4.0/)
Accepted: Mar 14, 2023; Published: Apr 19, 2023
Correspondence address: Shamay S. M. Ng, QT516, 5/F, The Hong Kong Polytechnic University, Hong Kong, China. E-mail: Shamay.Ng@polyu.edu.hk
Competing interests and funding: The authors have no conflicts of interest to declare.
Upper-body dressing ability is important for independent dressing, which affects one’s sense of dignity, self-respect, and achievement (1). In order to perform upper-body dressing, coordination, sequencing, and proficiency in particular dressing components, such as buttoning, and putting the arms into the correct sleeves, are necessary (2). Poor upper-body dressing performance may affect quality of life of both patients and caregivers. A previous study found that 36% of stroke patients still experienced difficulties in dressing 2 years post-stroke (3). Since dysfunction of the upper limbs hinders stroke patients’ ability to perform daily tasks, such as dressing, assessment of their upper-body dressing performance reflects their control of the upper limbs (4), which may indicate their independence level and quality of life.
There are key limitations in the currently used outcome measures for assessing upper-body dressing performance. The Functional Independence Measure (FIM) and Barthel Index (BI) each contain 1 item (item D “Dressing: upper-body” and item 8 “Dressing”, respectively) to assess general upper-body dressing performance (4). The Motor Activity Log (MAL-30) includes 1 item (item 29 “Button a shirt”) to measure 1 component action of upper-body dressing (5). However, they lack sensitivity in monitoring patients’ progress in particular component actions. In addition, MAL-30, being self-reported by patients may also lead to desirability bias. Nottingham Stroke Dressing Assessment assesses both upper- and lower-body dressing performances (6), but does not include standardized instructions for the level of assistance provided by assessors, and is time-consuming, as more than 36 stages are assessed. This may reduce its clinical practicality (7).
To help address these limitations, the Upper-Body Dressing Scale (UBDS) was proposed in a previous study (8), to evaluate upper-body dressing performance of stroke patients. UBDS separately assesses component actions in upper-body dressing and standardizes the cues given by assessors, which is crucial for organizing new motor patterns in training, and helps clinicians to develop evidence-based training for specific component actions (9).
UBDS assesses 7 upper-body dressing component actions: (i) paretic hand is passed into the sleeve; (ii) sleeve is pulled up beyond the elbow joint; (iii) sleeve is pulled up beyond the shoulder joint; (iv) shirt is pulled across the back to opposite shoulder joint; (v) healthy hand is passed into the sleeve; (vi) collar is arranged; and (vii) buttons are fastened. Each component is rated on a 5-point scale according to patient’s reliance on given cues. UBDS scores range from 7 points (no cues, indicating least severe disability) to 35 points (highest level of cues, indicating most severe disability). UBDS score has demonstrated good to excellent inter-rater, intra-rater and test–retest reliabilities (intraclass correlation coefficient (ICC) = 0.87–0.999) in vascular dementia and stroke patients, and has shown a significant negative correlation with FIM (r = –0.72 to –0.93) in hemiparesis patients (7, 8).
More research is needed to thoroughly assess the reliability of UBDS, its correlation with stroke-specific outcome measures and its cut-off for stroke patients. Also, previous studies did not include UBDS time as a metric for evaluating subjects’ performance. To help fill these gaps, the objectives of this study were to evaluate the: (i) inter-rater reliability of UBDS time and UBDS score for chronic stroke patients; (ii) test–retest reliability of UBDS time and UBDS score for chronic stroke patients; (iii) minimal detectable changes (MDCs) of UBDS time and UBDS score for chronic stroke patients; (iv) correlations of UBDS time and UBDS score with stroke-specific outcome measures; and (v) cut-off UBDS time and UBDS score for distinguishing upper-body dressing performance of chronic stroke patients from that of healthy older adults.
METHODS
Study design
This was a cross-sectional study. The study was approved by the Hong Kong Polytechnic University Ethics Committee and conducted following the guidelines of the Declaration of Helsinki. The ethical approval number is HSEARS20210110002-01. Participants were well-informed about the study procedures and objectives, and written consent was obtained before the start of the study.
Sample calculation
As excellent inter-rater (ICC = 0.971) reliability has been reported for UBDS score for patients with vascular dementia and stroke (7), the ICC for chronic stroke patients was assumed to be 0.9. As no previous study has evaluated correlations between UBDS and stroke-specific outcome measures for chronic stroke patients, a medium correlation was assumed (ρ = 0.30). To obtain a statistically significant difference at a significance level of 0.05 and power of 80%, a sample size of ≥ 64 subjects was required (10).
Participants
A total of 76 chronic stroke patients (i.e. diagnosed with stroke for more than 6 months) were recruited from local self-help groups in Hong Kong between January 2021 and July 2021. Patients were included if they: (i) were ≥ 50 years old; (ii) were ≥ 6 months post-stroke confirmed by magnetic resonance imaging; (iii) were medically stable to complete the assessments safely; (iv) scored ≥ 7 in the Abbreviated Mental Test (AMT) (11); (v) had no neurological, cardiovascular, or musculoskeletal comorbidities that would affect the assessments; (vi) could understand and follow simple instructions; (vii) had voluntary control in their non-paretic arm; (viii) had at least minimal antigravity shoulder movement and ≥ 5° antigravity wrist extension in their paretic arm.
A total of 49 healthy older adults aged ≥ 50 years old with stable health condition were recruited from local community centres. The inclusion and exclusion criteria for the healthy group are the same as the stroke group, except that the healthy participants did not have history of stroke. Participants were excluded if they had any neurological, cardiovascular, or musculoskeletal disorders that would affect the assessments.
Testing procedures
All raters were trained sufficiently and approved by the principal investigator before conducting the study. The testing procedure is shown in Fig. 1. On day 1, the demographics and stroke-specific outcome measures of chronic stroke patients were evaluated by rater A, who was randomly assigned by the research team. UBDS time and UBDS score of the stroke patients were then simultaneously assessed by rater A and rater B. On day 2, 7 days after day 1, UBDS time and UBDS score of the stroke subjects were assessed again by rater A. The demographics, UBDS time and UBDS score of the healthy older adults were assessed only once by rater A on day 1.
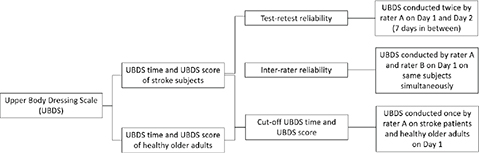
Fig. 1. Testing procedure for determining test–retest and inter-rater reliability, and cut-off Upper-Body Dressing Scale (UBDS) time and UBDS score.
Outcome measures
Upper-Body Dressing Scale (UBDS). The UBDS assesses upper-body dressing ability (8). Subjects were asked to grasp their shirt collar as the starting position. Assessors started timing on giving the verbal instruction “Please put on the shirt” and stopped when subjects had fastened the fourth button. Subjects underwent 1 trial after instructions and demonstrations. Praise was given to subjects after completing each component action. One score was given if no cues were needed. When subjects showed inadequate component actions or did nothing for 10 s, cues were offered using time-delay method and scores were instead given at 4 levels in the following order: 2 scores for verbal cue (e.g. “Can you pass your right hand into the sleeve?”); 3 scores for modelling (the assessor mimicked the component action); 4 scores for tapping (the assessor tapped on subject’s body or clothing); 5 scores for assistance (the assessor physically guided subject’s hand). The total score of each component was taken as UBDS score while the total time used was taken as UBDS time. Both were used for data analysis. UBDS scores range from 7 to 35. Higher UBDS scores and longer UBDS time indicate poorer upper-body dressing performance. Excellent inter-rater (ICC = 0.999), intra-rater (ICC = 0.971), and test–retest (ICC = 0.87) reliabilities have been demonstrated for UBDS score in vascular dementia and stroke patients (7, 8).
Fugl-Meyer Assessment (FMA). FMA assess the motor control of upper extremity and lower extremity (12). Motor domains of FMA-UE and FMA-LE quantify stroke patients’ motor impairments, including reflexes, movement synergy, and coordination, using a 3-point scale for each item. FMA-UE and FMA-LE contain 33 and 17 items with maximum scores of 66 and 34, respectively. Higher scores indicate less motor impairment. Excellent inter-rater (ICC3,1 = 1.000) and test–retest (ICC3,1 = 0.972) reliabilities have been demonstrated for FMA-UE. Good to excellent inter-rater (ICC3,1 = 0.93) and test–retest (ICC3,1 = 0.868) reliabilities have been demonstrated for FMA-LE in stroke patients (12).
Wolf Motor Function Test (WMFT). WMFT includes 17 items for assessing the functional ability of the more-affected upper-limb using a 6-point scale, except tasks 7 and 14 (13). Performance of task 7, which measured the amount of weight carried in lbs, and performance of task 14, which measures grip strength in kg. The maximum score is 75. Higher score indicates better motor function. Excellent inter-rater (ICC3,1 > 0.93), and test–retest (r = 0.95) reliabilities have been demonstrated for WMFT in chronic hemiplegic stroke patients (13).
Berg Balance Scale (BBS). BBS measures functional balance (14). It is a 14-item ordinal scale, 5-point scale for each item, with a maximum score of 56. Higher scores indicate better balance performance. Excellent inter-rater (ICC = 0.98), intra-rater (ICC = 0.97), and test–retest (ICC2,1 = 0.98) reliabilities have been demonstrated for BBS in independently-mobile older individuals and stroke patients (14).
Timed Up-and-Go Test (TUGT). TUGT measures the functional mobility of older individuals (15). The subjects were required to stand up from a chair with a backrest and walk along a 3-m straight line at their normal gait speed, make a 360° turn and then walk back to the chair and sit down with their trunk touching the backrest. Subjects underwent 1 practice trial and 3 timed trials. The mean time taken to complete the task was calculated in seconds. Longer time indicates poorer functional mobility, while time exceeding 30 s implies mobility deficits. Good to excellent test–retest (ICC > 0.95) (15), intra-rater (ICC ≥ 0.91) (16), and inter-rater (ICC ≥ 0.75) (16) reliabilities have been demonstrated for TUGT in stroke patients.
Limit of Stability (LOS) test. LOS test measures subjects’ ability to volitionally move their centre of gravity (COG) without losing their balance or changing their base of support (BOS) (17). In this study, a computed dynamic posturography system (Bertec Corporation, Columbus, OH, USA) was used to conduct the test, with visual feedback provided on a computer screen. Subjects were instructed to stand on a force plate and shift their COG to 8 target body positions on the screen. A harness was used for safety. Subjects’ reaction time (RT), movement velocity (MV), endpoint excursion (EE), maximal excursion (ME), and directional control (DC) were measured in 5 components (forward, backward, right, left, composite) (18). “RT” refers to time between the cue and the initiation of COG movement. “MV” refers to mean speed of movement towards the target. “EE” refers to the distance travelled on the first attempt to reach the target. “ME” refers to the furthest distance travelled. “DC” refers to the amount of movement towards the target minus the amount of movement away from the target (18). Lower RT, and higher MV, EE, ME, and DC indicate better balance performance. Good test–retest reliability (ICCs = 0.84–0.88) has been demonstrated for LOS test in stroke patients (17).
Motor Activity Log (MAL-30). MAL-30 assesses the functional ability of the more-affected arm of community-dwelling stroke patients (19). The amount of use (AOU) and quality of movement (QOM) for 30 functional tasks were quantified using an 11-point sub-scale. The mean scores for AOU and QOM were calculated, respectively, with maximum scores of 5. Higher scores indicate greater functional ability. Excellent inter-rater (ICC = 0.91–0.98) and test–retest (ICC = 0.99) reliabilities have been demonstrated for MAL-30 in chronic stroke patients (19).
Arm Activity Measure (AAM). AAM assesses active and passive upper-limb function of hemiplegic patients using a 5-point scale (20). Session A (passive domain) and Section B (active domain) contain 7 and 13 items with maximum scores of 28 and 52, respectively. Higher scores indicate more severe disability. Good test–retest reliability (quadratic-weighted kappa = 0.71–0.94) and good to excellent internal consistency (Cronbach’s alpha = 0.85–0.96) have been demonstrated for AAM in hemiparetic patients (20).
12-Item Short Form Health Survey (SF-12). SF-12 assesses the health-related quality of life (21). Physical component summary (PCS) is categorized into physical functioning, role limitations due to physical health problems, bodily pain, and general pain. Mental component summary (MCS) is categorized into vitality, social functioning, role limitations due to emotional problems, and mental health. Scores range from 0 to 100. Higher scores indicate better physical and mental quality of life. Good internal consistency (Cronbach’s alpha = 0.833–0.894) has been demonstrated for SF-12 in ischaemic stroke patients (22).
Community Integration Measure–Cantonese version (CIM-C). CIM-C assesses the community integration level in people with stroke (23). It is a 10-item questionnaire measuring community integration of Hong Kong stroke individuals using a 5-point scale (23). Scores range from 10 to 50. Higher scores indicate better community integration. Good test–retest reliability (ICC = 0.84) and internal consistency (Cronbach’s alpha = 0.84) have been demonstrated for CIM-C in chronic stroke patients (23).
Statistical analysis
SPSS software (version 26; IBM Corp., Armonk, NY, USA) was used to perform the data analyses.
Descriptive statistics were used to calculate subjects’ demographics, and UBDS time and UBDS score for subgroups analysis. Kolmogorov–Smirnov test and Levene’s test were used to calculate the normality and the homogeneity of variance, respectively. Independent t-tests, 1-way analysis of variance, and Tukey’s tests were used for comparing parametric data. χ2 and Mann–Whitney U test were used for comparing non-parametric data. Significance level was set at α = 0.05.
ICC3,2 and ICC2,1 were used to quantify inter-rater and test–retest reliabilities, respectively (24).
The MDCs were calculated as follows (25):

where SEM is the standard error of measurement, calculated as

where SD is the standard deviation, and r is the test–retest reliability coefficient.
Correlations analyses were calculated by Pearson’s r values for parametric data and Spearman’s rho values for non-parametric data. Correlations analyses were calculated by Pearson’s r for parametric data, and Spearman’s rho for non-parametric data. The Bonferroni correction was used, as the Bonferroni correction was more commonly used to control the false-positive rate in the multiple comparison compared with other adjustment tests (26). The significance level was adjusted to α = 0.008 (0.05/6) after Bonferroni corrections as motor control, upper-limb motor function, balance function, upper-limb usage, health-related quality of life, and community integration were the primary outcome categories.
Cut-off UBDS time and UBDS score were determined by receiver operating characteristic (ROC) curves and Youden index (27). Area under curve (AUC) was used to calculate the discrimination accuracy.
ICC values, correlation values, and AUC values of < 0.25, 0.25–0.5, 0.5–0.75, 0.75–0.9, and > 0.9 were defined as poor, fair, moderate, good, and excellent, respectively (25).
RESULTS
A total of 76 chronic stroke patients (47 men, 29 women) and 49 healthy older adults (14 men, 35 women) were recruited. The mean (SD) ages of the 2 groups were 64.07 (6.25) and 61.90 (7.29) years, respectively. The mean time since stroke for stroke patients was 85.29 (56.02) months. There were significant differences in sex, weight, and BMI between stroke patients and healthy older adults. Subjects’ demographics are shown in Table I.
| Characteristics | Stroke (n = 76) | Healthy (n = 49) | p-value |
| Age, years, mean (SD) | 64.07 (6.25) | 61.90 (7.29) | 0.050 |
| Sex, male/female, n | 47/29 | 14/35 | < 0.001* |
| Height, cm, mean (SD) | 163.70 (7.24) | 162.04 (8.39) | 0.243 |
| Weight, kg, mean (SD) | 64.44 (9.88) | 59.39 (11.40) | 0.001* |
| Body mass index, kg/m2, mean (SD) | 24.01 (3.09) | 22.53 (3.18) | 0.006* |
| Time since stroke, month, mean (SD) | 85.29 (56.02) | NA | NA |
| Affected side, left/right, n | 35/41 | NA | NA |
| Type of stroke, ischaemia/haemorrhage, n | 48/28 | NA | NA |
| NA: not applicable. SD: standard deviation. | |||
| *Significant difference at the p < 0.05 level of confidence. | |||
On both days, UBDS time (mean 90.54 s; SD 63.20) was significantly longer for stroke patients than for healthy older adults (mean 28.84 s; SD 14.37). However, there was no significant difference in UBDS score between stroke patients (mean 7.19; SD 0.96) and healthy older adults (mean 7.00; SD 0.00). Subjects’ mean values of UBDS time, UBDS score and other stroke-specific outcome measures are listed in Table II.
| Parameters | Affected side of stroke patients (n = 76) Mean (SD) | Healthy (n = 49) Mean (SD) | p-value (stroke patients compared with healthy older adults) |
| Day 1 Rater A | 91.81 (64.24) | 28.84 (14.37) | < 0.001* |
| Rater B | 91.59 (64.05) | < 0.001* | |
| Day 2 | 89.26 (62.16) | < 0.001* | |
| Day 1 Rater A | 7.16 (0.93) | 7.00 (0.00) | 0.161 |
| Rater B | 7.16 (0.93) | 0.161 | |
| Day 2 | 7.21 (0.98) | 0.068 | |
| Upper extremity | 45.61 (17.56) | ||
| Lower extremity | 26.38 (4.65) | ||
| WMFT | 52.14 (20.00) | ||
| BBS | 50.62 (5.84) | ||
| TUGT (s) | 16.83 (11.90) | ||
| Forward | 1.52 (0.50) | ||
| Backward | 1.61 (0.48) | ||
| Affected side | 1.43 (0.48) | ||
| Unaffected side | 1.44 (0.49) | ||
| Composite | 1.49 (0.43) | ||
| LOS_MV (degree/s) | |||
| Forward | 2.28 (1.19) | ||
| Backward | 1.69 (1.11) | ||
| Affected side | 2.74 (1.70) | ||
| Unaffected side | 2.67 (1.33) | ||
| Composite | 2.31 (1.00) | ||
| LOS_EE (%) | |||
| Forward | 37.91 (22.44) | ||
| Backward | 33.08 (21.31) | ||
| Affected side | 44.57 (22.78) | ||
| Unaffected side | 44.12 (20.41) | ||
| Composite | 39.53 (17.99) | ||
| LOS_ME (mm) | |||
| Forward | 51.68 (26.21) | ||
| Backward | 48.17 (27.40) | ||
| Affected side | 55.07 (22.85) | ||
| Unaffected side | 58.07 (23.19) | ||
| Composite | 53.43 (21.31) | ||
| LOS_DC (%) | |||
| Forward | 50.02 (23.10) | ||
| Backward | 28.98 (22.52) | ||
| Affected side | 47.27 (23.05) | ||
| Unaffected side | 49.77 (21.22) | ||
| Composite | 42.43 (19.83) | ||
| AOU, Affected side | 1.62 (1.35) | ||
| AOU, Unaffected side | 4.89 (0.29) | ||
| QOM, Affected side | 1.85 (1.51) | ||
| QOM, Unaffected side | 4.94 (0.18) | ||
| Section A | 2.30 (3.03) | ||
| Section B | 24.32 (15.73) | ||
| PCS | 39.79 (8.76) | ||
| MCS | 49.46 (10.84) | ||
| Total | 89.25 (15.83) | ||
| CIM-C | 40.78 (7.02) | ||
| SD: standard deviation; UBDS: Upper-Body Dressing Scale; FMA: Fugl-Meyer Assessment; WMFT: Wolf Motor Function Test; BBS: Berg Balance Scale; TUGT: Timed Up-and-Go Test; LOS: Limit of Stability; RT: Reaction Time; MV: Movement Velocity; EE: Endpoint Excursion; ME: Maximum Excursion; DC: Directional Control; MAL-30: Motor Activity Log; AOU: Amount of Use; QOM: Quality of Movement; AAM: Arm Activity Measure; SF-12: 12-item Short Form Health Survey; PCS: Physical Component Score; MCS: Mental Component Score; CIM-C: Community Integration Measure – Cantonese version. | |||
| *Significant difference at the p < 0.05 level of confidence. | |||
Both UBDS time and UBDS score demonstrated excellent inter-rater reliability (ICC3,2 = 1.000). The test–retest reliability was good for UBDS time (ICC2,1 = 0.759), and excellent for UBDS score (ICC2,1 = 0.913) (Table III). MDCs of UBDS time and UBDS score calculated were 28.71 s and 0, which indicated the smallest threshold of change that is greater than measurement error of the UBDS, respectively.
There were significant correlations between UBDS time and other stroke-specific outcome measures (Table IV, Fig. 2). UBDS time showed significant negative correlations with FMA-UE, FMA-LE, WMFT, BBS scores, LOS MV (affected side), LOS ME (composite), and MAL-30 AOU and QOM (affected side) scores (r = –0.31 to –0.61). Significant positive correlations with TUGT time and AAM (section B) score (r = 0.46 to 0.63) was also found. Meanwhile, UBDS score only showed significant negative correlation with LOS MV (composite) (r = –0.30).
| UBDS time (s) Spearman’s rho (p-value) | UBDS score Spearman’s rho (p-value) | |
| FMA | ||
| Upper extremity | –0.58 (p < 0.001)* | –0.18 (p = 0.118) |
| Lower extremity | –0.51 (p < 0.001)* | –0.06 (p = 0.616) |
| WMFT | –0.58 (p < 0.001)* | –0.28 (p = 0.016) |
| BBS | –0.41 (p < 0.001)* | –0.28 (p = 0.016) |
| TUGT (s) | 0.46 (p < 0.001)* | 0.23 (p = 0.048) |
| LOS_RT (s) | ||
| Forward | –0.25 (p = 0.027) | –0.25 (p = 0.028) |
| Backward | 0.03 (p = 0.784) | 0.02 (p = 0.855) |
| Affected side | 0.05 (p = 0.674) | 0.20 (p = 0.085) |
| Unaffected side | –0.02 (p = 0.887) | –0.06 (p = 0.614) |
| Composite | –0.03 (p = 0.786) | 0.00 (p = 0.992) |
| LOS_MV (degree/s) | ||
| Forward | –0.21 (p = 0.069) | –0.21 (p = 0.072) |
| Backward | –0.11 (p = 0.340) | –0.20 (p = 0.079) |
| Affected side | –0.32 (p = 0.005)* | –0.30 (p = 0.009) |
| Unaffected side | –0.25 (p = 0.031) | –0.21 (p = 0.076) |
| Composite | –0.27 (p = 0.016) | –0.30 (p = 0.008)* |
| LOS_EE (%) | ||
| Forward | –0.10 (p = 0.377) | –0.09 (p = 0.425) |
| Backward | –0.18 (p = 0.126) | –0.08 (p = 0.472) |
| Affected side | –0.29 (p = 0.012) | –0.20 (p = 0.082) |
| Unaffected side | –0.25 (p = 0.028) | –0.19 (p = 0.102) |
| Composite | –0.27 (p = 0.020) | –0.19 (p = 0.101) |
| LOS_ME (mm) | ||
| Forward | –0.15 (p = 0.202) | –0.16 (p = 0.165) |
| Backward | –0.27 (p = 0.019) | –0.12 (p = 0.293) |
| Affected side | –0.28 (p = 0.013) | –0.25 (p = 0.032) |
| Unaffected side | –0.29 (p = 0.011) | –0.22 (p = 0.058) |
| Composite | –0.31 (p = 0.007)* | –0.23 (p = 0.048) |
| LOS_DC (%) | ||
| Forward | –0.15 (p = 0.191) | –0.11 (p = 0.325) |
| Backward | –0.27 (p = 0.018) | –0.01 (p = 0.914) |
| Affected side | –0.26 (p = 0.024) | –0.10 (p = 0.387) |
| Unaffected side | –0.09 (p = 0.436) | –0.11 (p = 0.330) |
| Composite | –0.24 (p = 0.034) | –0.08 (p = 0.483) |
| MAL-30 | ||
| AOU, Affected side | –0.60 (p < 0.001)* | –0.26 (p = 0.021) |
| AOU, Unaffected side | 0.06 (p = 0.631) | –0.02 (p = 0.837) |
| QOM, Affected side | –0.61 (p < 0.001)* | –0.28 (p = 0.015) |
| QOM, Unaffected side | –0.02 (p = 0.901) | –0.05 (p = 0.683) |
| AAM | ||
| Section A | 0.26 (p = 0.021) | –0.06 (p = 0.590) |
| Section B | 0.63 (p < 0.001)* | 0.26 (p = 0.024) |
| SF-12 | ||
| PCS | –0.18 (p = 0.126) | –0.05 (p = 0.667) |
| MCS | –0.03 (p = 0.774) | 0.02 (p = 0.843) |
| Total | –0.17 (p = 0.144) | –0.04 (p = 0.745) |
| CIM-C | –0.03 (p = 0.803) | –0.09 (p = 0.455) |
| UBDS: Upper-Body Dressing Scale; FMA: Fugl-Meyer Assessment; WMFT: Wolf Motor Function Test; BBS: Berg Balance Scale; TUGT: Timed Up-and-Go Test; LOS: Limit of Stability; RT: Reaction Time; MV: Movement Velocity; EE: Endpoint Excursion; ME: Maximum Excursion; DC: Directional Control; MAL-30: Motor Activity Log; AOU: Amount of Use; QOM: Quality of Movement; AAM: Arm Activity Measure; SF-12: 12-item Short Form Health Survey; PCS: Physical Component Score; MCS: Mental Component Score; CIM-C: Community Integration Measure – Cantonese version | ||
| *Significant correlation after Bonferroni correction at the p < 0.008 (0.05/6) level of confidence. | ||
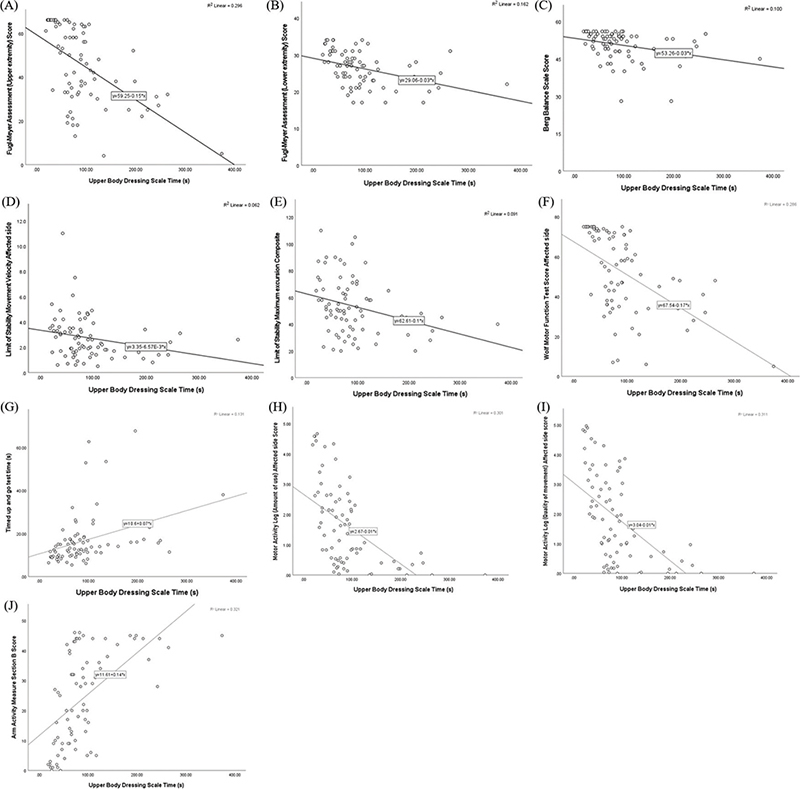
Fig. 2. Relationship between Upper-Body Dressing Scale (UBDS) Time with: (A) Fugl-Meyer Assessment- upper extremities (FMA-UE); (B) Fugl-Meyer Assessment-lower extremities (FMA-LE); (C) Berg Balance Scale (BBS); (D) Limit of Stability-Movement Velocity (LOS-MV), Affected Side; (E) Limit of Stability-Maximum Excursion (LOS-ME), Composite; (F) Wolf Motor Function Test (WMFT); (G) Timed Up-and-Go (TUG); (H) Motor Activity Log-Amount of Use (MAL-AOU), Affected Side; (I) Motor Activity Log-Quality of Movement (MAL-QOM), Affected Side; and (J) Arm Activity Measure (AAM), Section B.
The cut-off UBDS time was 37.67 s (AUC = 91.6%, sensitivity = 86.8%, specificity = 89.8%, p < 0.001) while the cut-off UBDS score was 7.50 (AUC = 52.0%, sensitivity = 3.9%, specificity = 100%, p = 0.710), which indicated the UBDS time and score has a possibility of 91.6% and 52.0% to distinguish upper-body dressing performance between chronic stroke patients and healthy older adults (Fig. 3).
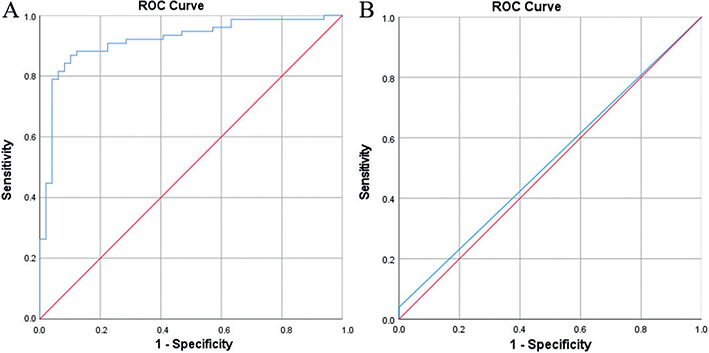
Fig. 3. Receiver operating characteristic (ROC) curves for Upper-Body Dressing Scale (UBDS) time and UBDS score. (A) ROC curve for UBDS time (area under curve; AUC) 91.6%; sensitivity, 86.8%; specificity, 89.8%; p < 0.001). (B) ROC curve for UBDS score (AUC 52.0%; sensitivity, 3.9%; specificity, 100%; p = 0.710).
Mean UBDS time and UBDS score for sub-groups of chronic stroke patients with different level of impairments were summarized (Table V). There were significant differences in UBDS time between stroke patients with different levels of motor impairment (p < 0.001); upper-limb impairment (p < 0.001), lower-limb impairment (p = 0.009); and fall risk (p < 0.001). There were no significant differences in UBDS score between sub-groups.
| Impairment | Sample, n (Total n = 76) | UBDS time (s) Mean (SD) | UBDS score Mean (SD) |
| Motor impairment, H (p-value) | p < 0.001* | 0.168 | |
| Severe to very severe (FMA-total: 0–55) | 18 | 139.31 (89.10) | 7.28 (0.96) |
| Moderate (FMA-total: 56–79) | 27 | 100.57 (52.18) | 7.26 (1.35) |
| Mild (FMA-total: 80–100) | 31 | 56.60 (27.50) | 7.00 (0.00) |
| Upper-limb impairment, U (p-value) | p < 0.001* | p = 0.400 | |
| Moderate to severe (FMA-UE: 0–39) | 32 | 126.11 (78.54) | 7.16 (0.72) |
| Minimal to mild (FMA-UE: 40–66) | 44 | 66.86 (35.20) | 7.16 (1.06) |
| Lower-limb impairment, U (p-value) | p = 0.009* | p = 0.575 | |
| Moderate to severe (FMA-LE: 0–21) | 15 | 122.46 (61.17) | 7.07 (0.26) |
| Minimal to mild (FMA-LE: 22–34) | 61 | 84.27 (63.19) | 7.18 (1.03) |
| Fall risk, U (p-value) | p < 0.001* | p = 0.087 | |
| Low risk (TUGT < 13.5 s) | 37 | 67.26 (43.69) | 7.00 (0.00) |
| High risk (TUGT ≥ 13.5 s) | 39 | 115.10 (72.07) | 7.31 (1.28) |
| SD: standard deviation; UBDS: Upper-Body Dressing Scale; FMA: Fugl-Meyer Assessment; UE: Upper extremities; LE: Lower extremities; TUGT: Timed Up-and-Go Test. | |||
| *Significant difference at the p < 0.05 level of confidence. | |||
DISCUSSION
This is the first study to evaluate the inter-rater reliability, test–retest reliability, MDCs of UBDS time and UBDS score for chronic stroke patients, correlations of UBDS time and UBDS score with stroke-specific outcome measures, and cut-off UBDS time and UBDS score best distinguishing the upper-body dressing performance of chronic stroke patients from that of healthy older adults.
Upper-Body Dressing Scale performance
This is the first study to include UBDS time as a measurement. UBDS time was significantly different between chronic stroke patients and healthy older adults, which indicates that this metric could possibly differentiate the UBDS performance of chronic stroke patients from that of healthy older adults. Meanwhile, UBDS score was not significantly different (p = 0.068–0.161) between chronic stroke patients and healthy older adults in the current study.
UBDS time in chronic stroke patients was approximately 3 times of that in healthy older adults. This may be due to the motor and sensory impairments in stroke patients, such as muscle weakness, spasticity, and visual inattention (2, 28). Abnormal firing rate patterns and motor unit control result in muscle weakness (29). Hyperexcited stretch reflex results in spasticity (29), which was experienced by 20–25% of stroke patients as shown in a previous study (30). Sensory impairments, including proprioceptive errors, may further lead to inaccurate motor output (28). These impairments may contribute to the increase in difficulties to complete the UBDS task (6). Our sub-group analysis also revealed that chronic stroke patients with more severe motor impairments and greater fall risks had longer UBDS time. Further investigation is required to evaluate the precise effect of motor impairment severity on upper-body dressing performance.
UBDS score for chronic stroke patients in this study was notably lower than that of dementia and stroke patients in the previous study (7). The differences may be due to greater functional limitation experienced by stroke patients with dementia than that by patients with stroke alone. Dementia patients may have limited learning ability to acquire new behavioural chains to accomplish dressing tasks, echoing a previous study that observed that patients with vascular dementia and Alzheimer’s disease experienced more difficulties with upper-body and lower-body dressing (31). In addition, UBDS score for our chronic stroke patients (mean = 7.19; SD = 0.96) was lower than that reported in previous study (median = 21) (8), which included subacute stroke patients with moderate to severe cognitive impairment. The differences in UBDS score may be explained by the differences in cognitive functioning between 2 study groups as our patients had relatively higher cognitive function (scored ≥ 7 in AMT). This may also explain the similar UBDS score between chronic stroke patients and healthy older adults (mean = 7.00; SD = 0.00) in this study. Cognitive impairments, such as constructional apraxia, unilateral spatial neglect, and asomatognosia, may affect upper-body dressing ability (2). Moreover, chronic stroke patients scored similarly regardless of their levels of impairment and fall risk, as they were expected to be capable of understanding the method of putting on a buttoned shirt and thus required minimal or no cues to complete the UBDS task. However, contributions of physical and cognitive factors to UBDS performance for stroke patients have not yet been established. Further research is needed to delineate the contribution of various factors affecting UBDS performance.
As this was the first study to assess UBDS time, neither UBDS time of chronic stroke patients and healthy older adults in this study could be compared with previous studies. UBDS score for healthy older adults could not be compared with previous studies either, as previous studies have performed UBDS on vascular dementia and stroke patients alone (7, 8, 28). However, all of the healthy older adults scored 7 in UBDS score, indicating that no cues were needed to complete the test.
Reliability
Consistent with previous study on UBDS score for vascular dementia and stroke patients (7), the current results showed excellent inter-rater reliability of UBDS time and UBDS score. This is because UBDS uses a standardized set-up and instructions, and raters are given sufficient time to practise implementing the scale. Therefore, consistent measurements could be obtained with minimal errors between raters.
The current results also illustrated good to excellent test–retest reliability for UBDS time and UBDS score, which were consistent with those from a previous study of UBDS score for subacute stroke patients (8). This implies that the influence of learning effects and fatigue on UBDS is minimal, thus the measurements between trials are consistent.
Correlation with stroke-specific outcome measures
UBDS time was found to have significant moderate negative correlations with FMA-UE and FMA-LE scores. Patients with lower FMA-UE score may have poorer control over their upper-limb, such as muscle synergies, multi-planar movements and coordination, while patients with lower FMA-LE score may have poorer control over their lower-limb, which may reduce their standing stability during the dressing task. Thus, more time is required to complete UBDS.
A significant moderate negative correlation was found between UBDS time and WMFT score. This was consistent with the results of a previous study suggesting a strong correlation between upper-limb functions and the degree of dressing independence (p < 0.001) (32). This may be due to the high functional demand on the affected limb in UBDS, during which patients are required to pass the paretic hand into a sleeve and fasten the buttons. Therefore, patients with poorer hand and shoulder control may complete UBDS more slowly. As the current study only included patients with voluntary control of the non-paretic arm and at least minimal antigravity movement in the paretic shoulder and wrist, patients with more severe disability could be recruited in future studies.
Significant fair correlations were found between UBDS time and both clinical and laboratory balance performance, including BBS score, LOS MV (affected side), LOS ME (composite), and TUGT time. A significant fair negative correlation was also found between UBDS score and LOS MV (composite) (r = –0.30). This was consistent with the results of previous studies, which have identified a positive correlation between independence in upper-body dressing and balance in stroke patients (33, 34).Since UBDS was performed in standing, patients with reduced standing balance capacity might adopt a more cautious and hesitant manoeuvre, and need extra time to maintain balance (33). In contrast, a previous study found no correlation between dressing ability and TUGT (35). The patients recruited to the current study have a relatively higher cognitive function, with AMT score ≥ 7, while the previous study included individuals regardless of their cognitive ability. This disparity in subject characteristics may explain the difference in results, as cognitive function is crucial in dressing (36).
However, no significant correlations were found between UBDS time and all LOS outcomes, except MV (affected side) and ME (composite), and between UBDS score and all LOS outcomes except MV (composite). As LOS primarily measures the movement of COG within the limit of BOS, while UBDS requires only minimal movement of COG, it appears logical that UBDS time and UBDS score were not correlated with most of the LOS data. The significant correlations may be attributed to the reduced general capabilities in patients with longer UBDS time and higher UBDS score, leading to a less satisfactory performance in LOS test. Nevertheless, the exact mechanism of this correlation is unclear and further investigation is needed to determine the underlying cause.
UBDS time had significant moderate negative correlations with MAL-30 AOU and QOM scores (affected side). Upper-body dressing requires sufficient upper extremity control, which was evaluated in MAL-30. The current results were expected, as subjects with a better control of affected limb may show superior execution of dressing tasks, and hence shorter UBDS time. Although MAL-30 is a self-administered questionnaire, it has been found to be correlated with several objective measures regarding general disability and upper extremity function, such as FMA-UE, National Institutes of Health Stroke Scale, and Purdue pegboard (5, 37). The current findings help to validate the correlation between an objective dressing scale and a subjective questionnaire.
The current study recognized a significant moderate positive correlation between UBDS time and AAM section B, but not section A. While section A assessed passive tasks, section B assessed tasks requiring active control of paretic upper-limb, including initiation of movement and stabilization, similar to UBDS. The correlation between UBDS time and AAM section B seems reasonable.
No significant correlations were identified between UBDS time and SF-12 or CIM-C score. These results were inconsistent with those of a previous study showing a fair to moderate positive correlation between CIM score and Jacket Test completion time (38). This result was unexpected, as dressing skills are crucial for independent functioning in people with severe disability (39). Since buttoning is not required in the Jacket Test (38), these surprising results may be due to possible compensatory strategies adopted by our subjects in daily functioning and community integration, such as wearing clothes without buttons, This results in a disparate result between UBDS time and self-reported questionnaire regarding quality of life and community integration (39)
There were no significant correlations between UBDS score and any of the stroke-specific outcome measures except LOS MV (composite), as mentioned above. This may be due to the satisfactory cognitive function of the current subjects. Their understanding of the dressing task reduced their needs for cues and guidance, which imposed a ceiling effect in UBDS score.
Cut-off score
The cut-off UBDS time could differentiate the upper-body dressing performance of chronic stroke patients from healthy older adults, but the cut-off UBDS score could not. UBDS time has a high AUC of 0.916 indicating excellent accuracy. Using the Youden index, the optimal cut-off UBDS time was found to be 37.67 s, with a high sensitivity of 86.8% and a high specificity of 89.8%. Meanwhile, the cut-off UBDS score of 7.50 has a poor discriminating ability, with a sensitivity of 3.9% and a specificity of 100%. Therefore, only UBDS time is a sensitive and specific tool for differentiating between the upper-body dressing performance of chronic stroke patients and that of healthy older adults, with an outstanding diagnostic power.
Limitations and future directions
First, the sample size estimation was based on the effect sizes calculated for reliability and correlation analyses. To draw a more robust conclusion, a larger sample size should be used in future studies. Secondly, the findings may not be generalizable to stroke patients of all ages, ethnicities, and levels of stroke chronicity. As the data were collected from chronic stroke patients age ≥ 50 years, who were recruited from a local self-help group with more active lifestyles, they may have better motor functions than other stroke patients, which may have caused bias. Thirdly, upper-body dressing ability may be affected by cognitive and sensory impairments, which were not considered in the current study. Fourthly, this study only assessed upper-body dressing in terms of time and score without considering the quality of movement. Fifthly, the stroke group showed significant differences in sex, weight, body mass index (BMI) to the healthy control in this study. All these factors may impact on the motor function of the upper limb, which may contribute to the significant difference of the UBDS performance between people with stroke and healthy older adults in this study. The unmatched characteristics between people with stroke and healthy older adults may be attributed to the small sample size of this study. Therefore, precaution should be taken before explaining the result of the cut-off score to distinguish the UBDS performance between healthy older adults and people with stroke in this study. Finally, due to the uneven sex ratio and significant differences in mean body weight and BMI between the 2 groups, the suggested MDCs and cut-off UBDS time should be interpreted with caution.
Future studies should extend our assessment of upper-body dressing performance to individuals of different ages, ethnicities, levels of stroke chronicity, and levels of cognitive and sensory impairments to increase the generalizability of UBDS to stroke population. Further research could also examine the extent of how physical and cognitive impairments affect UBDS performance, and investigate other possible neuromuscular factors, such as coordination and upper-limb proprioception. A larger sample size with an equivalent proportion of demographic data between people with stroke and healthy older adults could enable a more robust conclusion to be drawn.
CONCLUSION
This study demonstrates that UBDS time is a simple, yet reliable, sensitive, and specific measurement for evaluating upper-body dressing performance in chronic stroke patients, which has a 91.6% possibility to successfully differentiate upper-body dressing performance between chronic stroke patients and healthy older adults.
ACKNOWLEDGEMENTS
This study was supported by the Health and Medical Research Fund (17182001), Food and Health Bureau, Hong Kong SAR Government, awarded to Professor Shamay S. M. Ng and her team.
REFERENCES
- Mulley G. Practical management of stroke. Kent: Croom Helm; 1984.
- Walker C, Walker M. Dressing ability after stroke: a review of the literature. Br J Occupat Ther 2001; 64: 449–454.
- Walker M, Drummond A, Lincoln N. Evaluation of dressing practice for stroke patients after discharge from hospital: a crossover design study. Clin Rehabil 1996; 10: 23–31.
- Van der Putten J, Hobart J, Freeman J, Thompson A. Measuring change in disability after inpatient rehabilitation: comparison of the responsiveness of the Barthel index and the Functional Independence Measure. J Neurol Neurosurg Psychiatry 1999; 66: 480–484.
- Hammer AM, Lindmark B. Responsiveness and validity of the Motor Activity Log in patients during the subacute phase after stroke. Disabil Rehabil 2010; 32: 1184–1193.
- Walker M, Lincoln N. Factors influencing dressing performance after stroke. J Neurol Neurosurg Psychiatry 1991; 54: 699–701.
- Endo A, Suzuki M, Akagi A, Chiba N, Ishizaka I, Matsunaga A, et al. Reliability and validity of the upper–body dressing scale in japanese patients with vascular dementia with hemiparesis. Occup Ther Int 2015; 22: 10–18.
- Suzuki M, Yamada S, Omori M, Hatakeyama M, Sugimura Y, Matsushita K, et al. Development of the upper-body dressing scale for a buttoned shirt: a preliminary correlational study. Am J Phys Med Rehabil 2008; 87: 740–749.
- Alberto P, Troutman AC. Applied behavior analysis for teachers. Upper Saddle River, NJ: Pearson; 2013.
- Kang H. Sample size determination and power analysis using the G* Power software. J Educ Eval Health Prof 2021; 18:17.
- Lam SC, Wong Yy, Woo J. Reliability and validity of the abbreviated mental test (Hong Kong version) in residential care homes. J Am Geriatr Soc 2010; 58: 2255–2257.
- Kim H, Her J, Ko J, Park D-s, Woo J-H, You Y, et al. Reliability, concurrent validity, and responsiveness of the Fugl-Meyer Assessment (FMA) for hemiplegic patients. J Phys Ther Sci 2012; 24: 893–899.
- Morris DM, Uswatte G, Crago JE, Cook III EW, Taub E. The reliability of the wolf motor function test for assessing upper extremity function after stroke. Arch Phys Med Rehabil 2001; 82: 750–755.
- Berg K, Wood-Dauphinee S, Williams J. The Balance Scale: reliability assessment with elderly residents and patients with an acute stroke. Scand J Rehabil Med 1995; 27: 27–36.
- Ng SS, Hui-Chan CW. The Timed Up & Go test: its reliability and association with lower-limb impairments and locomotor capacities in people with chronic stroke. Arch Phys Med Rehabil 2005; 86: 1641–1647.
- Faria CD, Teixeira-Salmela LF, Neto MG, Rodrigues-de-Paula F. Performance-based tests in subjects with stroke: outcome scores, reliability and measurement errors. Clin Rehabil 2012; 26: 460–469.
- Liston RA, Brouwer BJ. Reliability and validity of measures obtained from stroke patients using the Balance Master. Arch Phys Med Rehabil 1996; 77: 425–430.
- Geldhof E, Cardon G, De Bourdeaudhuij I, Danneels L, Coorevits P, Vanderstraeten G, et al. Static and dynamic standing balance: test-retest reliability and reference values in 9 to 10 year old children. Eur J Pediatr 2006; 165: 779–786.
- Pereira ND, Ovando AC, Michaelsen SM, Anjos SMd, Lima RCM, Nascimento LR, et al. Motor Activity Log-Brazil: reliability and relationships with motor impairments in individuals with chronic stroke. Arq Neuropsiquiatr 2012; 70: 196–201.
- Ashford S, Turner-Stokes L, Siegert R, Slade M. Initial psychometric evaluation of the Arm Activity Measure (ArmA): a measure of activity in the hemiparetic arm. Clin Rehabil 2013; 27: 728–740.
- Kosinski M, Keller S. SF-12: How to score the SF-12 physical and mental health summary scales. Boston, MA: The Health Institute, New England Medical Center; 1995.
- Bohannon RW, Maljanian R, Lee N, Ahlquist M. Measurement properties of the short form (SF)-12 applied to patients with stroke. Int J Rehabil Res 2004; 27: 151–154.
- Liu T-W, Ng SS, Ng GY. Translation and initial validation of the Chinese (Cantonese) version of community integration measure for use in patients with chronic stroke. Biomed Res Int 2014; 2014: 623836.
- Koo TK, Li MY. A guideline of selecting and reporting intraclass correlation coefficients for reliability research. J Chiropr Med 2016; 15: 155–163.
- Portney LG. Foundations of clinical research: applications to evidence-based practice: FA Davis; 2020.
- Armstrong RA. When to use the Bonferroni correction. Ophthalmic Physiol Opt 2014; 34: 502–508.
- Kumar R, Indrayan A. Receiver operating characteristic (ROC) curve for medical researchers. Indian Pediatr 2011; 48: 277–287.
- Suzuki M, Omori M, Hatakeyama M, Yamada S, Matsushita K, Iijima S. Predicting recovery of upper-body dressing ability after stroke. Arch Phys Med Rehabil 2006; 87: 1496–1502.
- Raghavan P. Upper limb motor impairment after stroke. Phys Med Rehabil Clin 2015; 26: 599–610.
- Sommerfeld DK, Gripenstedt U, Welmer A-K. Spasticity after stroke: an overview of prevalence, test instruments, and treatments. Am J Phys Med Rehabil 2012; 91: 814–820.
- Shiau M-Y, Yu L, Yuan H-S, Lin J-H, Liu C-K. Functional performance of Alzheimer’s disease and vascular dementia in southern Taiwan. Kaohsiung J Med Sci 2006; 22: 437–446.
- Miyamoto S, Kondo T, Suzukamo Y, Michimata A, Izumi S-I. Reliability and validity of the Manual Function Test in patients with stroke. Am J Phys Med Rehabil 2009; 88: 247–255.
- Fujita T, Sato A, Yamamoto Y, Yamane K, Otsuki K, Tsuchiya K, et al. Relationship between dressing and motor function in stroke patients: a study with partial correlation analysis. J Phys Ther Sci 2015; 27: 3771–3774.
- Fujita T, Sato A, Yamamoto Y, Otsuki K, Tsuchiya K, Tozato F. Motor function cutoff values for independent dressing in stroke patients. Am J Occup Ther 2016; 70: 7003290010p1-p7.
- Silverio VS, Porras VA, Costa IR. Dynamic balance performance in relation to the dependence in activities of daily living: a cross-sectional study in stroke patients. Age 2020; 29: 46.8.
- De Wit L, Putman K, Devos H, Brinkmann N, Dejaeger E, De Weerdt W, et al. Long-term prediction of functional outcome after stroke using single items of the Barthel Index at discharge from rehabilitation centre. Diasbil Rehabil 2014; 36: 353–358.
- Stewart JC, Cramer SC. Patient-reported measures provide unique insights into motor function after stroke. Stroke 2013; 44: 1111–1116.
- Chen P, Lai CK, Chung RC, Ng SS. The Jacket Test for assessing people with chronic stroke. Disabil Rehabil 2017; 39: 2577–2583.
- Hughes MW, Schuster JW, Michael Nelson C. The acquisition of independent dressing skills by students with multiple disabilities. J Dev Phys Disabil 1993; 5: 233–252.