ORIGINAL REPORT
PSYCHOMETRIC ASSESSMENT OF THE SWEDISH VERSION OF THE WORK ABILITY INDEX IN PATIENTS WITH CHRONIC PAIN IN SPECIALIZED CARE
Hedvig ZETTERBERG, PhD1, Sofia WAGNER, MSc1, Lisa EKSELIUS, MD, PhD1, Rolf KARLSTEN, MD, PhD2, Ida FLINK, PhD3 and Pernilla ÅSENLÖF, PhD1
From the 1Department of Women's and Children's Health, 2Department of Surgical Sciences, Uppsala University, Uppsala, and 3The Center for Health and Medical Psychology, School of Law, Psychology and Social Work, Örebro University, Örebro, Sweden
Objective: To evaluate the construct validity and internal consistency of the Work Ability Index (WAI) in patients with chronic pain in secondary and tertiary care.
Methods: Cross-sectional study based on 200 patients with chronic pain (> 3 months), with a final sample of 118 participants, 18–64-years-old. Construct validity was assessed by exploratory factor analysis for the structural validity of the WAI, and by correlating the WAI with EuroQol EQ-5D, Brief Pain Inventory pain severity and interference, Patient Health Questionnaire and Generalized Anxiety Disorder scales. The study also assessed the discriminant validity of the WAI for occupational status, and the validity of the single-item work ability score. Reliability was assessed by internal consistency.
Results: A single-factor model of WAI was supported. Internal consistency was good. Moderate correlations were found, except for Brief Pain Inventory pain severity, where the correlation was weak; hence, both convergent and divergent validity of the WAI were supported. The work ability score correlated strongly with the total WAI, and the discriminant validity for both was good.
Conclusion: In patients with chronic pain in specialized care, the WAI and the work ability score displayed acceptable construct validity and internal consistency, supporting their use in a clinical context and research.
LAY ABSTRACT
Chronic pain may result in sick leave and work limitations. Assessment of work ability can be important for screening of needs and follow-up over time. Therefore, work ability among individuals with chronic pain should be assessed using valid measures. This study evaluated the measurement properties of the Work Ability Index among patients with chronic pain referred to a pain clinic. Analyses were performed to evaluate the degree to which the Work Ability Index measures work ability in a valid way, including aspects of construct validity and the interrelatedness among the items. The results of this study demonstrate acceptable measurement properties of the Work Ability Index among patients with chronic pain in specialized care; hence, the Work Ability Index could be used in pain care and research. In addition, the single-item work ability score included in the Work Ability Index was highly correlated with the total score and could be used as an alternative.
Key words: chronic pain; construct validity; internal consistency; psychometrics; work ability.
Citation: J Rehabil Med 2023; 55: jrm7146. DOI: https://doi.org/10.2340/jrm.v55.7146.
Copyright: © Published by Medical Journals Sweden, on behalf of the Foundation for Rehabilitation Information. This is an Open Access article distributed under the terms of the Creative Commons Attribution 4.0 International License (https://creativecommons.org/licenses/by/4.0/)
Accepted: Aug 24, 2023; Published: Sep 27, 2023.
Correspondence address: Hedvig Zetterberg, Department of Women’s and Children’s Health, Uppsala University, Akademiska sjukhuset, SE-751 85 Uppsala, Sweden. E-mail: hedvig.zetterberg@neuro.uu.se
Competing interests and funding: The authors have no conflicts of interest to declare.
Work ability can be understood as the result of an interaction between the individual and work factors (3, 4). Individuals’ health, functional capacity, and the characteristics of one’s work have consistently been found to be the most significant contributors to work ability (3–5).
The Work Ability Index (WAI) was developed as an occupational measurement, taking into consideration self-rated work ability in relation to the physical and mental demands of work, and the health and resources of the employee (6). The WAI has been used extensively and evaluated in different working or general populations in a range of countries (7, 9–13), including Sweden (12, 13). The WAI has been shown to predict sickness absence, long-term sick leave, or future disability pension reliably in samples of people working (12, 14) and already on sick leave (13).
In populations of workers, the WAI has displayed acceptable to good reliability in terms of test-retest (8, 11) and internal consistency (7, 11, 15), as well as construct validity (7, 9–11). The WAI can be seen as a unidimensional construct, albeit having different components, all of which affect work ability (3, 4). However, in previous studies, different factor structures have been reported (7, 9–11, 15, 16). The single-item work ability score (WAS), sometimes used as a sole measure of work ability, has shown strong correlation to the total WAI (13), and similar predictive validity (12–14).
Evaluations of psychometric properties of the WAI in clinical pain populations are needed. Chronic pain is associated with co-morbidity, mental ill-health and work limitations (1, 17). To the best of our knowledge, there are no evaluations of psychometric properties in terms of construct validity or reliability of the WAI in clinical settings, or among patients with chronic pain specifically.
The aim of this study was to evaluate the construct validity and internal consistency reliability of the Swedish Work Ability Index (WAI) in a clinical sample of patients with chronic pain in secondary and tertiary care, of working age (between 18 and 64 years). Specific research questions regarding the psychometric properties (18) of the WAI in the study sample were:
- What is the structural validity of the WAI?
- What is the reliability of the WAI in terms of internal consistency?
- What are the results of the hypothesis testing for construct validity of the WAI regarding:
- Comparisons with other outcome measurements: health-related quality of life, pain severity and pain interference, and depression and anxiety symptoms?
- Discriminant validity regarding participants working and participants on sick leave, disability pension, or early retirement (comparisons between subgroups)?
- What is the construct validity of the single-item WAS?
METHODS
Setting and sample
Data were collected from the first 200 participants in a clinical cohort of patients > 18 years of age, who were referred to the pain centre at Uppsala University Hospital; the U-PAIN cohort (19). The U-PAIN longitudinal cohort has the overall aim of identifying predictors for risk and benefit of chronic opioid therapy. At baseline, participants are assessed by a range of digitized patient-reported outcome measures (PROMs), diagnostic interviews, physical performance tests, and biomarkers. Psychometric evaluation of the WAI in this sample has been approved by the Swedish Ethical Review Authority regional ethics board in Uppsala (EPN Uppsala D-No 2016-376, 2020-05283). The COnsensus-based Standards for the selection of health Measurement Instruments (COSMIN) checklist was followed for planning and conducting the study (20).
The sample was consecutively recruited among patients with chronic pain who were referred to secondary and tertiary care at the pain centre from June 2018 to January 2021. Inclusion criteria were: age 18 years or older, first visit of their current referral to the pain centre, and a pain duration of more than 3 months at the time of referral. In addition, only individuals with a complete WAI were included in this study. Exclusion criteria were: acute care related to active cancer treatment, palliative care, cognitive impairment, or being illiterate in the Swedish language. Moreover, an exclusion criterion of age 65 years or older combined with self-reported retirement pension was used in this study, based on the decision not to evaluate the WAI among those retired. Regarding the other measures, participants who had not answered a specific questionnaire were excluded from the particular analysis where this questionnaire was needed.
Procedures
Eligible individuals received written information about the study, together with the invitation letter for the clinical consultation at the pain clinic. They were phoned by the research staff, when questions could be answered and participants could express an interest in participation. All participants provided written and informed consent before the research visit. Prior to the clinical consultation, patients completed the questionnaires using the Swedish Healthcare Guide’s digital platform. Paper versions were available on demand, and Swedish versions of all questionnaires were used. Screening, recruitment, and data collection were performed by trained research staff.
Measures
Characteristics. Demographic information about age, self-identified gender, education level, occupational status, and pain duration were assessed by study specific questions. Pain classification according to the IASP classification of chronic pain for the International Classification of Diseases (ICD-11) (21) was based on data from medical records. As a measure of co-morbidity, the item in the WAI on current diseases diagnosed by a physician was used, which covers 14 sub-items, including injury due to trauma, musculoskeletal, cardiovascular and respiratory diseases, and mental disorders.
Work Ability Index
The Work Ability Index (WAI) (6) is a measurement of work ability that covers 7 items: item 1, current work ability compared with lifetime best, 0–10 points; item 2, work ability in relation to the demands of the job, 2–10 points; item 3, number of current diseases diagnosed by a physician, 1–7 points; item 4, estimated work impairment due to diseases, 1–6 points; item 5, sick leave during the past year, 1–5 points; item 6, own prognosis of work ability 2 years from now, 1, 4, or 7 points; and item 7, mental resources, 1–4 points. Items 2, 3, and 7 comprise 2, 14, and 3 sub-items, respectively.
The items are scored and summarized into a total index ranging from 7 to 49 points, where higher values indicate higher work ability (6). The WAI results are categorized as 7–27 = poor, 28–36 = moderate, 37–43 = good, and 44–49 = excellent work ability. In the single-item WAS (item 1), participants score on a numerical rating scale (NRS), anchored as 0 = completely unable to work, 10 = my work ability is at its best. The WAS has been categorized as 0–5 = poor, 6–7 = moderate, 8–9 = good, and 10 = excellent work ability (3).
In the U-PAIN cohort, an additional instruction to estimate work ability based on current or previous employment or studies was added to WAI, to facilitate the use for participants who were unemployed or on long-term sick leave or on disability pension: “Answer the questions based on your current work/studies. If you are not working, estimate your current work ability based on a hypothetical salaried employment or studies. It could be work you previously had and/or tried.”
EQ-5D-5L
Health-related quality of life and overall rating of health were measured using the EuroQol EQ-5D-5L. The measurement has been evaluated extensively in various populations, including patients with pain, and shown to have excellent psychometric properties in terms of validity and reliability (22). The EQ-5D-5L is used as a general health measure and comprises 5 dimensions: mobility, self-care, usual activities, pain/discomfort, and anxiety/depression, which has 5 levels: none, slight, moderate, severe, and extreme problems. In addition, it comprises the EQ-VAS, which records the patient’s self-rated health on a vertical visual analogue scale 0–100, where the endpoints are labelled “The best health you can imagine”’ and “The worst health you can imagine.” The ratings on 5 dimensions can be converted into a single measure of health utility, using preference-based (general population) weights: the EQ-5D index. In this study, the UK value set was used for calculations of the EQ-5D index scores by the EQ-5D-5L Index Value Calculator (EuroQol Group) (23). Cronbach’s alpha in this study was 0.77.
Brief Pain Inventory Short form. Pain severity and pain interference were measured using the short form Brief Pain Inventory (BPI-SF). The BPI is a widely used measure in pain populations, with good reliability and validity (24, 25). On pain severity there are 4 items in the BPI, and in this study the item pain on the average (item 5) was used for pain severity. It is rated on NRS, anchored as 0 = no pain and 10 = pain as bad as you can imagine. In the pain interference subscale, the impact of pain on function in daily life covers general activity, mood, walking, work, relations with others, sleep and enjoyment of life, and is rated on NRS, where 0 = does not interfere and 10 = completely interferes. A mean interference value is calculated. Cronbach’s alpha in this study was 0.86.
Patient Health Questionnaire 9-item depression module. Symptoms of depression were measured using the Patient Health Questionnaire 9-item depression module (PHQ-9), where patients rate the frequency of symptoms during the last 2 weeks. A total score in the range 0–27 is calculated, and the measurement has acceptable reliability and validity (26, 27). PHQ-9 has also been used for screening for depression, with scores of 5–9 indicating mild, 10–14 moderate, 15–19 moderately severe, and ≥20 severe levels of depression. Cut-offs between 10 and 15 points have been used to identify individuals with depression (27). Cronbach’s alpha in this study was 0.84.
Generalized Anxiety Disorder 7-item scale. Symptoms of anxiety were measured using the Generalized Anxiety Disorder 7-item scale (GAD-7), which has demonstrated good reliability and validity (28). Similar to the PHQ-9, patients rate the frequency of symptoms during the last 2 weeks. A total score of 0–21 is calculated, with scores of 5–9 indicating mild, 10–14 moderate, and 15–21 severe levels of anxiety. A cut-off on 10 points has been used to identify individuals with GAD. Cronbach’s alpha in this study was 0.92.
Data management and statistical analyses
Exploratory factor analysis was conducted to investigate the factor structure and item loadings for WAI in the study sample. The exploratory approach was chosen because of the evaluation in a new sample and the diverse previous findings on the factor structure for the WAI. The extraction method was maximum likelihood, the rotation model was goemin oblique, and a Spearman correlation matrix was used. When interpreting different factor structures, the following aspects were considered: scree plot and eigen values, total variance explained, number of items per factor, item loadings and factor correlations, and interpretability of factors in relation to theory and previous models. An item loading above 0.5 was considered acceptable, and above 0.7 preferable (29). The following goodness of fit indices were used: χ2 test (acceptable if not significant p > 0.05), the Tucker-Lewis index (TLI) and the comparative fit index (CFI) (for both ≥ 0.95 good fit, ≥ 0.90 adequate fit), the root mean square error of approximation (RMSEA) (< 0.05 good fit, 0.05–0.08 adequate fit, 0.08–0.10 marginal fit, > 0.10 poor fit), and the standardized root mean square residual (SRMR) (< 0.05 good fit, 0.05–0.09 adequate fit) (30, 31).
The internal consistency was calculated using Cronbach’s alpha for WAI, including the corrected item-total correlation and Cronbach’s alpha if the item was deleted. A Cronbach’s alpha of around 0.8 was desirable (32). For the corrected item-total correlation, a coefficient > 0.30 was considered preferable (33). For each item, the Cronbach’s alpha, if the item was deleted, should not exceed the overall alpha.
Since the results on the WAI were unevenly distributed in the sample, non-parametric tests were chosen for the analyses. Spearman’s rho correlation was used for correlations between the WAI and other measures, and Mann-Whitney U test for differences between the subgroups regarding the WAI scores. Correlation coefficients were interpreted as zero (0.0), weak (0.1–0.3), moderate (0.4–0.6), strong (0.7–0.9), and perfect (1.0) (34).
In testing for construct validity, the hypotheses were: for convergent validity, moderate correlations were expected between the WAI and EQ-5D, BPI pain interference, PHQ-9, and GAD-7, based on previous findings (7, 9–11). A lower correlation was expected between the WAI and pain intensity, hypothesized as divergent validity (35). Positive correlations were expected in relation to the EQ-5D, and in a negative direction for the BPI, PHQ-9, and GAD-7. Participants who were working were expected to have a higher WAS compared with those non-working, in testing of discriminant validity. Finally, the WAS was expected to correlate strongly with the total WAI (13).
The packages lavaan, semPlot, and nFactors in R version 4.1.1 (The R Foundation for Statistical Computing, Vienna, Austria) were used for the factor analysis. The Statistical package for the Societal Sciences (SPSS version 27.0) (IBPM Corp., Armonk, New York, USA) was used for the other analyses. Throughout, statistical tests were 2-tailed and treated as statistically significant at the level of p < 0.05.
RESULTS
Included participants and missing data
The final sample consisted of 118 participants. Among those excluded, 28 lacked complete WAI. The individuals with missing WAI did not differ in terms of age t(144) = t 1.73, p = 0.086 or gender χ2 (2, N = 146) = 1.93, p = 0.381 compared with those with complete WAI. However, they were, to a larger degree, non-working, 75% compared with 49% in the sample with complete WAI, χ2 (1, N = 146) = 6.09, p = 0.014. Fourteen individuals had missing values only for item 4 in the WAI. Fig. 1 displays a flowchart of the included and excluded data.
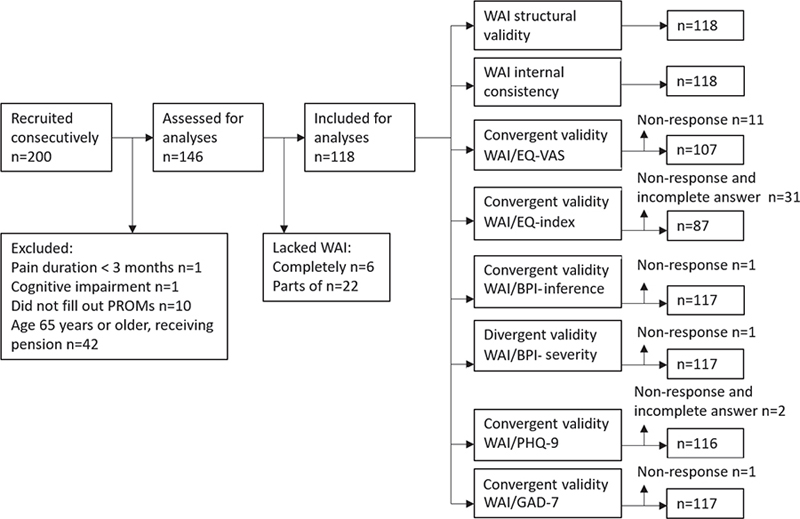
Fig. 1. Flowchart of included and excluded data. WAI: Work Ability Index; EQ-VAS: EuroQoL- Visual Analogue Scale; EQ-index: EuroQoL - index; BPI: Brief Pain Inventory; PHQ-9: Patient Health Questionnaire 9-item depression module; GAD-7: Generalized Anxiety Disorder 7-item scale; PROMs: Patient Reported Outcome Measures.
Sample characteristics
Among the participants, 50.8% (n = 60) were classified as in the work force, i.e. working, studying, or available for the labour market (e.g. job seeking). The other 49.2% (n = 58) were not working, i.e. on long-term sick leave, disability pension, or early retirement. Pain duration for more than 3 years was reported by a majority (80.4%). For those classified with chronic secondary pain, the most common conditions were chronic post-surgical or post-traumatic, chronic neuropathic, and chronic secondary musculoskeletal pain. Co-morbidity was prevalent, with participants reporting, on average, 3 ongoing health conditions. Work ability was poor. Demographic and clinical variables are shown in Table I.
| Frequency, n = 118 | |
| Age, years, mean (SD) | 44.6 (12.0) |
| Gender, n (%) | |
| Women | 78 (66.1) |
| Men | 39 (33.1) |
| Unsure | 1 (0.8) |
| Education, n (%) | |
| Middle school or lower | 23 (19.4) |
| High school or vocational education | 60 (50.9) |
| University or college education < 3 years | 16 (13.6) |
| University or college education > 3 years | 19 (16.1) |
| Occupation, n (%) | |
| Work as an employee | 44 (37.3) |
| Entrepreneur | 4 (3.4) |
| Student | 2 (1.7) |
| Job seeker or in a labour market policy measure | 8 (6.8) |
| Other | 2 (1.7) |
| On long-term sick-leave (> 3 months) | 46 (39.0) |
| Pensioner (by disability or early retirement) | 12 (10.2) |
| Pain duration (n = 117), n (%) | |
| 3 months – 1 year | 4 (3.4) |
| >1 year – 3 years | 19 (16.2) |
| >3 years – 10 years | 34 (29.1) |
| >10 years | 60 (51.3) |
| Pain classificationa, n (%) | |
| Chronic primary pain, n | 70 |
| Chronic secondary pain, n | 80 |
| Number of ongoing health conditionsb, mean (SD) | 3.1 (2.1) |
| Work Ability Index (WAI)c, total, n = 118, median (IQR), range | 18.0 (13.0–26.0), 7.0–49.0 |
| Single-item question on work abilityd, n = 118 | 2.0 (0–5.0), 0–10.0 |
| Health-related quality of life | |
| EQ-5D indexe, n = 87 | 0.464 (0.273–0.646), –0.091–0.937 |
| EQ-VASf, n = 107 | 40.0 (25.0–52.0), 0–90.0 |
| Pain severity on averageg, BPI-SF, n = 117 | 6.0 (5.0–8.0), 2.0–10.0 |
| Pain interferenceh, BPI-SF, n = 117 | 7.4 (5.6–8.6), 1.9–10.0 |
| Depressive symptomsi, PHQ-9, n = 116 | 12.0 (7.0–17.0), 0–25.0 |
| Anxiety symptomsj, GAD-7, n = 117 | 6.0 (2.0–13.0), 0–21.0 |
| aAccording to the IASP classification. bNumber of current diseases diagnosed by a physician, self-reported from WAI. cWAI scores range 7–49: 7–27 = poor, 28–36 = moderate, 37–43 = good, and 44–49 = excellent work ability. dSingle-item rating of work ability in the WAI, 0 = completely unable to work, 10 = my work ability is at its best. eIndex scores for the EQ-5D-5L, worse than dead (<0) to 1 (full health), anchoring dead at 0. fRating overall health, 0 = worse imaginable health, 100 = best imaginable health. gPain severity, item 5 in the Brief Pain Inventory short form (BPI-SF), pain on the average, 0 = no pain, 10 = pain as bad as you can imagine. hPain interference subscale, BPI, 0 = does not interfere, 10 = completely interferes. iPatient Health Questionnaire 9-item depression module: range 0–27, where higher scores indicate worse symptoms. jGeneralized Anxiety Disorder 7-item scale: range 0–21, where higher scores indicate worse symptoms. | |
| SD: standard deviation; IQR: interquartile range. | |
Structural validity
From the exploratory factor analysis, a single-factor model and a 2-factor model were proposed. Three out of 4 outcomes favoured a single-factor model in the scree plot. The eigenvalues, which favoured a 2-factor model, were 3.62 and 1.05 for the first and second factors and 0.82 for the third factor. Proportion of variance explained was 46.2% in the single-factor model. In the 2-factor model, factor 1 explained 41.9% of the variance and factor 2 explained 13.3%. The correlation between factors 1 and 2 in the 2-factor model was moderate, rs = 0.66. In Table II, loadings for items in the single-factor and 2-factor models are described. Overall, both models were interpreted as having an adequate fit, according to the indices. For the single-factor model, the index of fit values was χ2 (14, N = 118) = 29.66, p < 0.01, TLI 0.955, CFI 0.933, RMSEA 0.097 (95% CI 0.047–0.146) and SRMR 0.057. For the 2-factor model, the index of fit values was χ2 (8, N = 118) = 14.88, p = 0.06, TLI 0.980, CFI 0.949, RMSEA 0.085 (95% CI 0.00–0.152) and SRMR 0.057.
The single-factor was the favoured model in the scree-plots, and there were no major differences between the models on indexes of fit. Altogether, the single-factor model was considered to best represent the factor structure of the WAI in this sample, based on the data and interpretation of factors. Items 3 (diseases) and 7 (mental resources) had the lowest loadings, a pattern observed in both models.
Internal consistency
The Cronbach’s alpha for the overall WAI score (n = 118) was 0.813. The corrected item-total correlation ranged between 0.272 and 0.805, and the Cronbach’s alpha if the item was deleted varied between 0.743 and 0.833, as shown in Table III. The lowest values for internal consistency were found for items 3 (diseases) and 7 (mental resources).
| WAI item | Corrected item-total correlationa | Cronbach’s alpha if the item was deletedb |
| 1 | 0.781 | 0.743 |
| 2 | 0.746 | 0.750 |
| 3 | 0.272 | 0.832 |
| 4 | 0.805 | 0.763 |
| 5 | 0.507 | 0.798 |
| 6 | 0.545 | 0.793 |
| 7 | 0.427 | 0.814 |
| aShould be larger than 0.3. bShould not be larger than the overall Chronbach’s alpha = 0.813. | ||
Hypothesis testing for construct validity
Comparisons with other outcome measurements. Convergent validity displayed moderate correlations between the WAI and EQ-5D index rs = 0.53 (p < 0.001), EQ-VAS rs = 0.47 (p < 0.001), BPI pain interference rs = –0.52 (p < 0.001), PHQ-9 rs = –0.49 (p < 0.001) and GAD-7 rs = –0.49 (p < 0.001). Divergent validity was supported by a weak correlation between the WAI and BPI pain severity rs = –0.21 (p = 0.023). All correlations were in the hypothesized direction and strength. For pain interference, depressive and anxiety symptoms, lower levels were related to better work ability; the same for pain intensity, however with a weak association. For health-related quality of life, higher levels were related to better work ability.
Discriminant validity (comparisons between the subgroups). Among participants in the work force, the median WAI score (25th to 75th percentile) was 25.0 (21.0–30.0). Among participants non-working, the median score was 13.5 (10.0–16.0). For the WAS, the corresponding values were 4.5 (3–6) and 0 (0–1) for the groups. The distribution between the groups differed significantly for the WAI (Mann–Whitney U = 283.5, n1 = 60, n2 = 58, p < 0.001) and for the WAS (Mann–Whitney U = 419.0, n1 = 60, n2 = 58, p < 0.001), meaning they effectively discriminated between the subgroups.
Construct validity for the WAS
An item-total correlation for the WAS for the total WAI displayed a strong positive correlation, rs = 0.86* (*p < 0.001), illustrated with a scatterplot in Fig. 2.
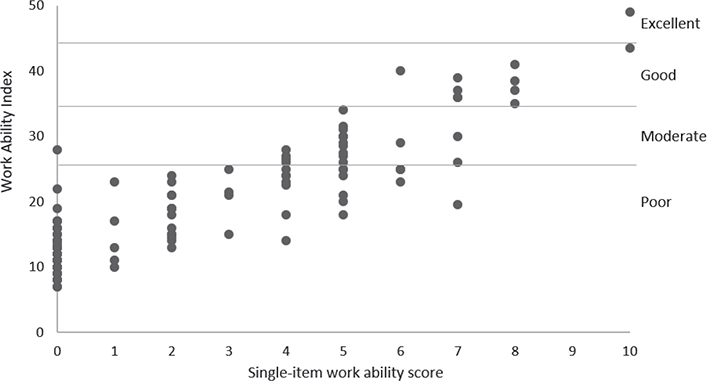
Fig. 2. Scatterplot of the Work Ability Index (WAI) and the single-item work ability score (WAS) (n = 118). Horizontal lines indicate the WAI categories “poor”, “moderate”, “good”, and “excellent work ability”. Correlation coefficient rs = 0.86*. Item-total correlations for the other items were: (2) rs = 0.81*. (3) rs = 0.44*, (4) rs = 0.86*, (5) rs = 0.62, (6) rs = 0.73, (7) rs = 0.40*. *p<0.001.
DISCUSSION
These results support the psychometric properties of the WAI in a sample of patients with chronic pain who were referred to secondary and tertiary care. Construct validity and internal consistency reliability were acceptable, indicating that the WAI is a valid measure of work ability for the population. In addition, the single-item WAS displayed good construct validity.
A single-factor structure of the WAI was considered most adequate in this sample, which supports the interpretation of work ability as a unidimensional construct (4). The single-factor structure of WAI has also been observed previously (7, 15), including in a random sample of a Swedish working population (36). A 2-factor structure of the WAI has also been proposed, 1 factor called “subjectively estimated work ability” with items 1, 2, 6, and 7, and a second factor “diseases and health-related restrictions,” most often composed of items 3, 4, and 5 (7, 10, 15, 16). The 3-factor structure presented in the literature adds “mental resources” as a separate factor (9, 11). In this study, there was no support for the interpretation of factors accordingly, since the pattern of item loadings was different. Hence, the versions of the 2- or 3-factor structures of the WAI presented in previous studies were not replicated in this sample. This might be because the components of work ability are distributed differently in various populations, affecting the factor structure and interpretation. Interestingly, Torgén also found the single-factor structure to be robust among those with low work ability (36). In this study, the single-factor was the favoured model in the scree-plots; altogether, the single-factor model was considered here to best represent the factor structure of the WAI.
The items with notable differences in the factor loading and internal consistency between the current study and previous studies were those on diseases and sick leave. These are also areas where one could expect differences in the prevalence between the clinical and occupational samples, which is supported by our data on co-morbidity and the proportion of those on sick leave. Another reflection is that patients with chronic pain share prerequisites, in the sense that work ability and prevalence of sick leave might relate to the pain condition specifically. An interpretation of the findings of this study could be that, among patients with chronic pain in specialized care, the prevalence of sick leave is high and related to overall work ability. In previous evaluations of the WAI in working populations the item on sick leave has been suggested to contribute little and display low reliability (7, 10). However, the Cronbach’s alpha for the WAI in this study was similar or higher compared with previous reports (7, 11, 15), supporting the overall internal consistency of the WAI despite differences in the samples.
In hypothesis testing for construct validity, it should be noted that correlations are just below 0.5 for several measures in this study, which is a suggested cut-off for convergent validity (35). It has been argued that convergent validity should preferably be > 0.7 (35). However, these results are in line with previous findings on correlations between the WAI and health measures (7, 9–11), although not previously presented as convergent or divergent. The somewhat low convergent validity could be argued to reflect that health aspects are related to work ability; however, not capturing the same overall construct (3, 4). It could also be noted that the reported correlations vary over studies, with a range from weak to strong correlations (7, 9–11). This could indicate that different characteristics in the samples might affect the co-variance between WAI and dimensions of health. The correlation between work ability and pain severity was weak in this study, as has also been reported previously (9, 10).
Work ability was poor among participants in this study, both among working and non-working participants (e.g. those on disability pension). Discriminative validity of WAI for these subgroups was still good. A study by Bethge et al. (37) found similar levels of work ability among patients with chronic low back pain and suggested a cut-off of ≤ 20 to be predictive of future disability pension. In our sample, this cut-off would discriminate against the subgroups, whereas the standard categories of poor, moderate, etc. work ability does not. Poor or moderate work ability, or a WAI score ≤ 37, has been suggested to indicate a need for rehabilitation among workers (38). Among patients with chronic pain entering multimodal pain rehabilitation, work ability according to the WAS and occupational status have shown to be prognostic for beneficial long-term outcomes (39, 40), indicating the importance of addressing work ability. However, for interpretation of WAS and its associations with different needs among patients with chronic pain, more knowledge is needed.
Work ability has been found to be substantially lower among patients with chronic pain, and lower than in working or general populations (3, 10–12). The characteristics of the participants in this study, recruited from secondary and tertiary care, should be taken into consideration when interpreting the results, and when considering transferability to other pain populations. The prevalence of long-term sick leave, disability pension, and early retirement was high (49%). The results also show low perceived health, prevalence of depressive symptoms, and high pain interference among the participants, reflecting the burden and co-morbidity among these patients (17).
Further research on the predictive validity of the WAI and the WAS among patients with pain is prioritized, as well as evaluation of the test–retest reliability in pain populations. The WAI could also be further explored in pain care by evaluation of its psychometric properties in subgroups or among patients in primary care. In addition, clinically relevant change in work ability rating during rehabilitation is of interest, for use in both randomized controlled trials and on an individual level; for example, in clinical care or single-case design research. Of course, work ability needs to be within a broader range of outcomes for chronic pain in clinical research, including, for example, health-related quality of life and pain-related outcomes.
For this study, some limitations are worth mentioning. Regarding structural validity, an alternative would have been to use a confirmatory factor analysis. The decision to use an explorative analysis was based on the lack of consensus and that the current study sample was hypothesized to differ in many aspects from the samples in previous studies. However, the limited sample size might have affected the findings of factor structure.
The additional instruction in the WAI in this study, to estimate work ability based on current or previous employment or studies, should be taken into consideration when interpreting the results, specifically for non-working individuals. For these, the instruction aimed to facilitate responding to the WAI; however, we cannot determine how it might have affected the measurement properties. Importantly, the item content of the WAI was not modified. One could also note that the WAI still might have been perceived as being difficult or unnecessary to fill in, based on higher rates of missing WAI in the U-PAIN cohort among individuals who were not working.
Another limitation is the demographic data on occupational status. For discriminative validity, it would have been beneficial to use register-based data on sick leave, in addition to self-report. Still, this study evaluated several aspects of construct validity of the WAI, including structural validity and hypothesis testing, as well as internal consistency reliability, altogether providing information of relevance for future research.
In conclusion, this study supports the use of the WAI as a valid measurement of work ability among patients with chronic pain in specialized care. The single-item WAS displayed good construct validity in relation to the full WAI, indicating that it could be used as an alternative. The construct validity of the WAI was supported, with a single-factor model proposed, and convergent validity toward health-related quality of life, pain interference, and depressive and anxiety symptoms showing moderate correlations, whereas correlation with pain severity was low. Internal consistency was good; however, it indicated a lower reliability for the items about diseases and mental resources.
In this study, the WAI was evaluated in a sample of patients with poor work ability, indicating that it could be used in groups with individuals on sick leave or retired, using an additional instruction. Future research should further address test–retest reliability, predictive validity, categorizations, and sensitivity to change among patients with chronic pain, for increased knowledge on usability of the WAI and the WAS as screening or outcome measurements in this population.
ACKNOWLEDGEMENTS
The authors sincerely thank all the participants and the pain clinic for their contributions in the U-PAIN cohort.
This study was funded by grants from the Swedish Research Council, and the Swedish state under the agreement between the Swedish government and the county council, the ALF-agreement. The study was conducted according to the guidelines of the Declaration of Helsinki, and approved by the Swedish Ethical Review Authority regional ethics board in Uppsala (EPN Uppsala D-No 2016-376, 2020-05283). Informed consent was obtained from all subjects involved in the study. The data presented in this study are available on request.
REFERENCES
- Breivik H, Collett B, Ventafridda V, Cohen R, Gallacher D. Survey of chronic pain in Europe: Prevalence, impact on daily life, and treatment. Eur J Pain 2006; 10: 287–287. DOI: 10.1016/j.ejpain.2005.06.009
- OECD. Sickness, disability and work: breaking the barriers: a synthesis of findings across OECD countries. OECD; 2010 [cited 2020 Dec 7]. Available from: https://www.oecd-ilibrary.org/social-issues-migration-health/sickness-disability-and-work-breaking-the-barriers_9789264088856-en.
- Gould R, Ilmarinen J, Järvisalo J, Koskinen S, editors. Dimensions of Work Ability. Results of the Health 2000 Survey. Helsinki; 2008 [cited 2022 May 10]. Available from: https://sivusto.kykyviisari.fi/wp-content/uploads/2018/09/Gould-Dimensions-of-work-ability.pdf
- Ilmarinen J, Tuomi K, Seitsamo J. New dimensions of work ability. Int Congr Ser 2005; 1280: 3–7. DOI: 10.1016/j.ics.2005.02.060
- van den Berg TIJ, Elders LAM, de Zwart BCH, Burdorf A. The effects of work-related and individual factors on the Work Ability Index: a systematic review. Occup Environ Med 2008; 66: 211–220. DOI: 10.1136/oem.2008.039883
- Tuomi K, Ilmarinen J, Jahkola M, Katajarinne L, Tulkki A. Work Ability Index. 2nd revised edn. Helsinki: Finnish Institute of Occupational Health; 2006.
- Radkiewicz P, Widerszal-Bazyl M. Psychometric properties of Work Ability Index in the light of comparative survey study. Assess Promot Work Abil Health Well-Ageing Work 2005; 1280: 304–309. DOI: 10.1016/j.ics.2005.02.089
- de Zwart BC, Frings-Dresen MH, van Duivenbooden JC. Test-retest reliability of the Work Ability Index questionnaire. Occup Med Lond 2002; 52: 177–181. DOI: 10.1093/occmed/52.4.177
- Bascour-Sandoval C, Soto-Rodríguez F, Muñoz-Poblete C, Marzuca-Nassr GN. Psychometric properties of the Spanish Version of the Work Ability Index in working individuals. J Occup Rehabil 2020; 30: 288–297. DOI: 10.1007/s10926-019-09871-0
- Alexopoulos E. Work Ability Index: validation of the Greek version and descriptive data in heavy industry employees. Br J Med Med Res 2013; 3: 608–621. DOI: 10.9734/BJMMR/2013/2552
- Abdolalizadeh M, Arastoo AA, Ghsemzadeh R, Montazeri A, Ahmadi K, Azizi A. The psychometric properties of an Iranian translation of the Work Ability Index (WAI) questionnaire. J Occup Rehabil 2012; 22: 401–408. DOI: 10.1007/s10926-012-9355-3
- Lundin A, Leijon O, Vaez M, Hallgren M, Torgén M. Predictive validity of the Work Ability Index and its individual items in the general population. Scand J Public Health 2017; 45: 350–356. DOI: 10.1177/1403494817702759
- Ahlstrom L, Grimby-Ekman A, Hagberg M, Dellve L. The Work Ability Index and single-item question: associations with sick leave, symptoms, and health – a prospective study of women on long-term sick leave. Scand J Work Environ Health 2010; 36: 404–412. DOI: 10.5271/sjweh.2917
- Alavinia SM, de Boer AGEM, van Duivenbooden JC, Frings-Dresen MHW, Burdorf A. Determinants of work ability and its predictive value for disability. Occup Med 2009; 59: 32–37. DOI: 10.1093/occmed/kqn148
- Mateo Rodríguez I, Knox ECL, Oliver Hernández C, Daponte Codina A, the esTAR Group. psychometric properties of the Work Ability Index in Health Centre workers in Spain. Int J Environ Res Public Health 2021; 18: 12988. DOI: 10.3390/ijerph182412988
- Martus P, Jakob O, Rose U, Seibt R, Freude G. A comparative analysis of the Work Ability Index. Occup Med 2010; 60: 517–524. DOI: 10.1093/occmed/kqq093
- Tunks ER, Crook J, Weir R. Epidemiology of chronic pain with psychological comorbidity: prevalence, risk, course, and prognosis. Can J Psychiatry 2008; 53: 224–234. DOI: 10.1177/070674370805300403
- Mokkink LB, Terwee CB, Patrick DL, Alonso J, Stratford PW, Knol DL, et al. The COSMIN study reached international consensus on taxonomy, terminology, and definitions of measurement properties for health-related patient-reported outcomes. J Clin Epidemiol 2010; 63: 737–745. DOI: 10.1016/j.jclinepi.2010.02.006
- Ljungvall H, Lind AL, Zetterberg H, Wagner S, Ekselius L, Karlsten R, et al. U-PAIN cohort study among patients with chronic pain in specialised pain care: a feasibility study. BMJ Open 2022; 12: e062265. DOI: 10.1136/bmjopen-2022-062265
- Mokkink L, Prinsen C, Patrick D, Alonso J, Bouter LM, de Vet HCW, et al. COSMIN Study Design checklist for patient-reported outcome measurement instruments. 2019 [cited 2021 Dec 6]. Available from: https://www.cosmin.nl/wp-content/uploads/COSMIN-study-designing-checklist_final.pdf#
- Treede RD, Rief W, Barke A, Aziz Q, Bennett MI, Benoliel R, et al. Chronic pain as a symptom or a disease: the IASP Classification of Chronic Pain for the International Classification of Diseases (ICD-11). Pain 2019; 160: 19–27. DOI: 10.1097/j.pain.0000000000001384
- Garratt AM, Furunes H, Hellum C, Solberg T, Brox JI, Storheim K, et al. Evaluation of the EQ-5D-3L and 5L versions in low back pain patients. Health Qual Life Outcomes 2021; 19: 155. DOI: 10.1186/s12955-021-01792-y
- van Hout B, Janssen MF, Feng YS, Kohlmann T, Busschbach J, Golicki D, et al. Interim scoring for the EQ-5D-5L: mapping the EQ-5D-5L to EQ-5D-3L value sets. Value Health 2012; 15: 708–715. DOI: 10.1016/j.jval.2012.02.008
- Cleeland CS, Ryan KM. Pain assessment: global use of the Brief Pain Inventory. Ann Acad Med Singap 1994; 23: 129–138.
- Tan G, Jensen MP, Thornby JI, Shanti BF. Validation of the brief pain inventory for chronic nonmalignant pain. J Pain 2004; 5: 133–137. DOI: 10.1016/j.jpain.2003.12.005
- Kroenke K, Spitzer RL, Williams JBW. The PHQ-9: Validity of a brief depression severity measure. J Gen Intern Med 2001; 16: 606–613. DOI: 10.1046/j.1525-1497.2001.016009606.x
- Hansson M, Chotai J, Nordstöm A, Bodlund O. Comparison of two self-rating scales to detect depression: HADS and PHQ-9. Br J Gen Pract 2009; 59: e283–288. DOI: 10.3399/bjgp09X454070
- Spitzer RL, Kroenke K, Williams JBW, Löwe B. A brief measure for assessing generalized anxiety disorder: the GAD-7. Arch Intern Med 2006; 166: 1092. DOI: 10.1001/archinte.166.10.1092
- Kline RB. Principles and practice of structural equation modeling. Third edition. New York: The Guilford Press; 2011.
- Hu L, Bentler PM. Cutoff criteria for fit indexes in covariance structure analysis: Conventional criteria versus new alternatives. Struct Equ Model Multidiscip J 1999; 6: 1–55. DOI: 10.1080/10705519909540118
- Collier JE. Applied structural equation modeling using AMOS: basic to advanced techniques. New York London: Routledge; 2020.
- Tavakol M, Dennick R. Making sense of Cronbach’s alpha. Int J Med Educ 2011; 2: 53–55. DOI: 10.5116/ijme.4dfb.8dfd
- Field AP. Discovering statistics using SPSS. 3rd edn. Los Angeles: Sage Publications; 2009.
- Dancey CP, Reidy. Statistics without maths for psychology. Pearson Education, Harlow, England; 2007.
- Carlson KD, Herdman AO. Understanding the Impact of convergent validity on research results. Organ Res Methods 2012; 15: 17–32. DOI: 10.1177/1094428110392383
- Torgén M. Experiences of WAI in a random sample of the Swedish working population. Int Congr Ser 2005; 1280: 328–232. DOI: 10.1016/j.ics.2005.01.016
- Bethge M, Gutenbrunner C, Neuderth S. Work Ability Index predicts application for disability pension after work-related medical rehabilitation for chronic back pain. Arch Phys Med Rehabil 2013; 94: 2262–2268. DOI: 10.1016/j.apmr.2013.05.003
- Bethge M, Radoschewski F, Gutenbrunner C. The Work Ability Index as a screening tool to identify the need for rehabilitation: longitudinal findings from the Second German Sociomedical Panel of Employees. J Rehabil Med 2012; 44: 980–987. DOI: 10.2340/16501977-1063
- Tseli E, Vixner L, LoMartire R, Grooten W, Gerdle B, Äng B. Prognostic factors for improved physical and emotional functioning one year after interdisciplinary rehabilitation in patients with chronic pain: results from a national quality registry in Sweden. J Rehabil Med 2020; 52: jrm00019. DOI: 10.2340/16501977-2648
- Pietilä-Holmner E, Enthoven P, Gerdle B, Molander P, Stålnacke B. Long-term outcomes of multimodal rehabilitation in primary care for patients with chronic pain. J Rehabil Med 2020; 52: jrm00023. DOI: 10.2340/16501977-2649a